1 Introduction
When a layer of fluid between two horizontal boundaries is heated from below, convection instabilities can arise. This is the well-known Rayleigh–Bénard problem. When the temperature difference across the fluid passes a critical level, instabilities can develop. This critical value is expressed in terms of the Rayleigh number
 $$\begin{eqnarray}Ra=\frac{g\unicode[STIX]{x1D6FC}\unicode[STIX]{x0394}TH^{3}}{\unicode[STIX]{x1D708}\unicode[STIX]{x1D705}},\end{eqnarray}$$
where
 $g$
is the acceleration due to gravity,
 $\unicode[STIX]{x1D6FC}$
the coefficient of thermal expansion,
 $\unicode[STIX]{x0394}T$
the imposed temperature difference,
 $H$
the distance between the boundaries,
 $\unicode[STIX]{x1D708}$
the kinematic viscosity and
 $\unicode[STIX]{x1D705}$
the thermal diffusivity. The well-known critical Rayleigh number for this problem is
 $Ra=27\unicode[STIX]{x03C0}^{4}/4$
for stress-free boundaries and
 $Ra=1707.8$
for no-slip boundaries (see, for example, Drazin & Reid Reference Drazin and Reid1981).
When a semi-infinite body of fluid is heated from below by a sudden increase in temperature at its horizontal boundary, the heat diffuses into the fluid, penetrating a distance of order
 $(\unicode[STIX]{x1D705}t)^{1/2}$
from the boundary, where
 $t$
is the time since the onset of heating. A simplistic argument would suggest that, as this buoyant layer has a depth
 $H=O((\unicode[STIX]{x1D705}t)^{1/2})$
, the effective Rayleigh number grows as
 $t^{3/2}$
. This would mean that the thermal layer would start off being stable, and become unstable at a later time.
The transition from stability to instability some time after the initial application of a destabilizing effect has been observed experimentally in other situations. For example, in the experiments of Chen, Briggs & Wirtz (Reference Chen, Briggs and Wirtz1971), water with a vertical salinity gradient was heated from a vertical boundary. In one example, shown in their figure 8(b), instabilities are observed to start forming in the middle of the wall around 8 min after the wall temperature was raised. In the related experiments of Narusawa & Suzukawa (Reference Narusawa and Suzukawa1981), where a constant heat flux was applied at a vertical wall bounding a salinity gradient, the authors observed instabilities first appearing in some cases an hour or more after the onset of heating. In both these cases the background state is intrinsically unsteady.
The linear stability analysis for the Rayleigh–Bénard problem is made simpler because there exists a background state that is steady – the conduction solution. In these cases it is common to be able to perform a normal-mode analysis, where the form of the instability can be separated into a time-dependent part and a spatial part, with the growth of the disturbances being exponential in time. For a steady background state, an exponentially growing linear instability will eventually reach a finite amplitude where it can be observed and nonlinearity becomes important. In this case the concept of marginal stability – the condition separating the situation where no modes grow exponentially from cases where at least one mode grows – is important. There are many examples of investigations of the stability of steady flows and background states in many branches of fluid mechanics (again see, for example, Drazin & Reid Reference Drazin and Reid1981).
In the problems that interest us here, we have an evolving system where the form and growth rate of instabilities may change with time, and indeed stop growing. In this case it is not just the presence of growth that is important, but by how much the instability grows. If an instability has insufficient total growth, then the evolution of any initial disturbance may pass unnoticed. The decision as to what growth of an instability is required for a system to be considered unstable is not clear. There is always some background disturbance to a fluid, either from random molecular fluctuations, from ambient noise and vibration, or from deviations of the real background state from the mathematical idealization. This last case could be from imperfections in the walls, from non-uniform heating or just from residual motions from the filling of an experimental tank. The form and magnitude of these potential initial disturbances are hard to estimate, and so the required growth for instabilities to be observed, or nonlinearities to become important, is also unclear. For this reason, in our study we will look at a range of possible growths. Even for stability problems where the background state is steady, it is sometimes possible to get significant transient growth of instabilities in circumstances where all linear disturbances will eventually decay (see, for example, Trefethen et al. Reference Trefethen, Trefethen, Reddy and Driscoll1993). In such circumstances, as with instabilities of an evolving background state, the importance of the instabilities may depend on whether the amplitude of the instabilities will reach some threshold level where, say, nonlinearity becomes important.
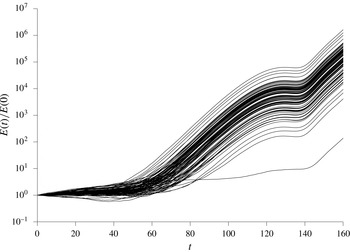
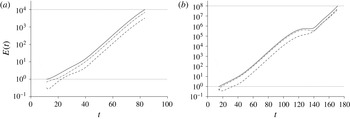
The growth of the size of 100 sets of instabilities when a semi-infinite body of fluid is heated from a vertical wall subject to random perturbations. Each realization differs only in the seed for the random number generator for the noise. Further details are provided in § 5.

One way to approach an investigation of the stability of an evolving system numerically is to subject a simulation of the background flow to random noise and to look at the evolution of instabilities. This was used by, for example, Kim & Kim (Reference Kim and Kim1986) in an investigation of the heating of a layer of fluid from below. They applied a constant heat flux at the heated boundary, while here we will apply a fixed temperature rise. In figure 1 are shown the results of 100 such runs for one of the problems under consideration here: the heating of a semi-infinite body of fluid from a vertical sidewall. The details of these calculations will be left to the relevant section of this paper. These calculations show the evolution of an energy-like measure of the amplitude of the disturbances renormalized so that they all start at 1 when
 $t=0$
, the time of the onset of wall heating. The only differences between all these runs is the value of the seed number used in the random number generator. Even if we ignore the outlying curve at the bottom, these exhibit a significant spread of amplitudes at
 $t=160$
. If one were to look for the time when instabilities start to grow, or the time they take to reach a given threshold of
 $E(t)/E(0)$
, there would also be a high level of uncertainty. The approach that we will take in this paper aims to provide well-defined answers to these points.
In this paper we will primarily be concerned with two convection problems. Firstly, we consider the case of heating a large body of fluid from below at a horizontal boundary. Secondly, we will look at the related problem where the heating is from a vertical wall. Before we do this, we will outline the method that we use. This involves following the evolution of all possible linear instabilities from an initial time,
 $t_{0}$
(which may or may not be the time of the onset of heating), to some later time,
 $t_{1}$
. For some measure of the amplitude of the disturbances, we will then find the optimum initial conditions that give rise to the maximum growth over this time interval.
The above follows the same basic idea as used by Foster (Reference Foster1965, Reference Foster1968) in his study of heating fluid from a bottom boundary. He used the kinetic energy as a measure of the amplitude of the disturbances, which were expressed in terms of a function expansion of the temperature and velocity perturbation. He used
 $t_{0}=0$
and only allowed a limited set of initial perturbations to the velocity, and no initial perturbations to the temperature. We will see that this approach will tend to underestimate the growth.
The use of non-modal stability theory to look at the transient growth of instabilities has been looked at by numerous authors (for a review, see Schmid Reference Schmid2007). Of particular relevance here is the analysis of time-evolving problems by deriving the set of adjoint differential equations for the problem under consideration, and then developing an iterative scheme where the initial value problem is solved forwards in time using the original equations and using the final solution thus found to give the initial conditions for the adjoint problem. This was then solved backwards in time to the initial point, which in turn provides the initial conditions for solving the original differential equations for the next iteration. This approach has been reviewed in Luchini & Bottaro (Reference Luchini and Bottaro2014). This approach was used to look at time-dependent Rayleigh–Bénard–Marangoni convection by Doumenc et al. (Reference Doumenc, Boeck, Guerrier and Rossi2010). It will be seen that this method is fundamentally equivalent to the approach taken here; however, the formulation of the problem and the numerical approach are quite different. No adjoint differential equations will be derived or explicitly solved here.
In § 2 we will set out the basic convection problems that we will consider, and the numerical approach taken to find the optimum disturbances. We will then apply this approach in § 3 to the classic Rayleigh–Bénard problem to verify the approach. It will be seen how the growth predicted is dependent on the choice of the measure of the amplitude, and that an inappropriate choice of this measure can lead to overpredictions of growth, even predicting growth in stable systems. Considering a problem with a time-independent background state enables some of the features, and potential drawbacks, of measures of the amplitude to be examined without the confounding effects of an evolving background state. When the measure is chosen appropriately, the analysis will reveal the exponential growth found by more conventional analysis, even for growth over quite restricted time intervals.
In § 4 we will apply the methods developed to the investigation of the problem of heating a semi-infinite body of fluid from a horizontal lower boundary, and in § 5 the problem of heating a semi-infinite body of fluid from a vertical boundary. Again, a warm layer develops near the boundary, but in this case the buoyant region generates an upflow near the wall. We will mainly focus on results for the case of Prandtl number
 $\unicode[STIX]{x1D70E}=\unicode[STIX]{x1D708}/\unicode[STIX]{x1D705}=7$
, which is appropriate for water, but also has a relatively complex behaviour for the sidewall problem where the instabilities observed straddle two different regimes. We will also look at the trends for more general Prandtl numbers.
2 Problem formulation and solution method
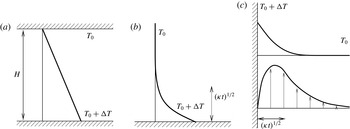
We will look at three basic problems. Firstly we consider the heating of a horizontal layer of fluid from below. This is the classic Rayleigh–Bénard problem, as shown schematically in figure 2(a). The second case is where we look at the heating of a semi-infinite body of fluid from a single horizontal boundary below the fluid. In this situation there is a growing destabilizing temperature gradient of height of order
 $(\unicode[STIX]{x1D705}t)^{1/2}$
, where
 $t$
is the time since the onset of heating and
 $\unicode[STIX]{x1D705}$
the thermal diffusivity. This is shown schematically in figure 2(b). The last case is where a semi-infinite body of fluid is heated from a vertical sidewall, shown schematically in figure 2(c). Again, there is a growing buoyant layer of fluid next to the boundary of width
 $(\unicode[STIX]{x1D705}t)^{1/2}$
, which, in this case, causes the fluid near the wall to rise. We will look at the growth of linear perturbations to these background states.
Schematic diagrams showing the temperature profiles for (a) Rayleigh–Bénard convection between two parallel horizontal plates, (b) heating from a single lower boundary, and (c) the temperature profile (upper line) and velocity profile (lower line) for heating from a single vertical wall.

The linearized equations for the perturbations to the velocity,
 $\boldsymbol{u}$
, and the temperature,
 $T$
, for all the cases are
 $$\begin{eqnarray}\displaystyle & \displaystyle \frac{\unicode[STIX]{x2202}\boldsymbol{u}}{\unicode[STIX]{x2202}t}+\overline{\boldsymbol{U}}(\boldsymbol{x},t)\boldsymbol{\cdot }\unicode[STIX]{x1D735}\boldsymbol{u}+\boldsymbol{u}\boldsymbol{\cdot }\unicode[STIX]{x1D735}\overline{\boldsymbol{U}}(\boldsymbol{x},t)=-\frac{1}{\unicode[STIX]{x1D70C}_{0}}\unicode[STIX]{x1D735}p+g\unicode[STIX]{x1D6FC}T\hat{\boldsymbol{z}}+\unicode[STIX]{x1D708}\unicode[STIX]{x1D6FB}^{2}\boldsymbol{u}, & \displaystyle\end{eqnarray}$$
 $$\begin{eqnarray}\displaystyle & \unicode[STIX]{x1D735}\boldsymbol{\cdot }\boldsymbol{u}=0, & \displaystyle\end{eqnarray}$$
 $$\begin{eqnarray}\displaystyle & \displaystyle \frac{\unicode[STIX]{x2202}T}{\unicode[STIX]{x2202}t}+\overline{\boldsymbol{U}}(\boldsymbol{x},t)\boldsymbol{\cdot }\unicode[STIX]{x1D735}T+\boldsymbol{u}\boldsymbol{\cdot }\unicode[STIX]{x1D735}\overline{T}(\boldsymbol{x},t)=\unicode[STIX]{x1D705}\unicode[STIX]{x1D6FB}^{2}T, & \displaystyle\end{eqnarray}$$
 $\overline{\boldsymbol{U}}(\boldsymbol{x},t)$
and
 $\overline{T}(\boldsymbol{x},t)$
are the background velocity and temperature profiles,
 $g$
the acceleration due to gravity,
 $\unicode[STIX]{x1D6FC}$
the coefficient of thermal expansion,
 $\unicode[STIX]{x1D708}$
the kinematic viscosity,
 $\unicode[STIX]{x1D70C}_{0}$
the density at temperature
 $T_{0}$
, and
 $\hat{\boldsymbol{z}}$
a unit vector pointing upwards. Here we have made the Boussinesq approximation and assumed a linear equation of state. For the horizontal layer we look at instabilities to the steady-state case where the lower boundary at
 $z=0$
is held at a temperature
 $T_{0}+\unicode[STIX]{x0394}T$
, while the upper boundary at
 $z=H$
is kept at
 $T_{0}$
. For the two cases of single boundaries we consider the case of a stationary fluid which initially has a uniform temperature
 $T_{0}$
, and, at some initial time
 $t=0$
, the boundary temperature is increased to
 $T_{0}+\unicode[STIX]{x0394}T$
and held at this level.
The boundary conditions for the disturbances that we consider are that the velocity and temperature perturbations are zero at the solid boundaries, and tend to zero away far from the walls for the semi-infinite cases.
In this study we will restrict ourselves to looking at two-dimensional motions, and so we can use the vorticity–streamfunction formulation. We take the curl of the momentum equation (2.1a
) and consider the
 $y$
-component of the vorticity,
 $\unicode[STIX]{x1D714}$
. We will non-dimensionalize the equations using the rescalings
 $$\begin{eqnarray}\boldsymbol{x}^{\prime }=\boldsymbol{x}/D,\quad t^{\prime }=\unicode[STIX]{x1D705}t/D^{2},\quad \unicode[STIX]{x1D714}^{\prime }=D^{2}\unicode[STIX]{x1D714}/\unicode[STIX]{x1D705},\quad T^{\prime }=T/\unicode[STIX]{x0394}T,\end{eqnarray}$$
where
 $D$
is an appropriate length scale. For the case of two parallel boundaries, the distance between the walls,
 $H$
, is an obvious and conventional choice of a length scale for non-dimensionalizing the equations. For the case
 $D=H$
we derive the non-dimensional equations for the vorticity and the streamfunction,
 $\unicode[STIX]{x1D713}^{\prime }$
:
 $$\begin{eqnarray}\displaystyle & \displaystyle \frac{1}{\unicode[STIX]{x1D70E}}\left(\frac{\unicode[STIX]{x2202}\unicode[STIX]{x1D714}^{\prime }}{\unicode[STIX]{x2202}t^{\prime }}-\frac{\unicode[STIX]{x2202}\unicode[STIX]{x1D713}^{\prime }}{\unicode[STIX]{x2202}z^{\prime }}\frac{\unicode[STIX]{x2202}^{2}\overline{W^{\prime }}}{\unicode[STIX]{x2202}x^{\prime 2}}+\overline{W^{\prime }}\frac{\unicode[STIX]{x2202}\unicode[STIX]{x1D714}^{\prime }}{\unicode[STIX]{x2202}z^{\prime }}\right)=-Ra\frac{\unicode[STIX]{x2202}T^{\prime }}{\unicode[STIX]{x2202}x^{\prime }}+\unicode[STIX]{x1D6FB}^{\prime 2}\unicode[STIX]{x1D714}^{\prime }, & \displaystyle\end{eqnarray}$$
 $$\begin{eqnarray}\displaystyle & \unicode[STIX]{x1D6FB}^{\prime 2}\unicode[STIX]{x1D713}^{\prime }=-\unicode[STIX]{x1D714}^{\prime }, & \displaystyle\end{eqnarray}$$
 $$\begin{eqnarray}u^{\prime }=-\frac{\unicode[STIX]{x2202}\unicode[STIX]{x1D713}^{\prime }}{\unicode[STIX]{x2202}z^{\prime }},\quad w^{\prime }=\frac{\unicode[STIX]{x2202}\unicode[STIX]{x1D713}^{\prime }}{\unicode[STIX]{x2202}x^{\prime }}.\end{eqnarray}$$
The vertical component of the background velocity,
 $\overline{\boldsymbol{U}}^{\prime }$
, is denoted by
 $\overline{W}^{\prime }$
. This is only non-zero for the vertical sidewall problem.
Here the Rayleigh number,
 $Ra$
, is the non-dimensional measure of the heating, defined by (1.1). For the case of a semi-infinite fluid, the length scale
 $H$
is not available. For an evolving system that has the heating turned on at some initial time, the distance the heat diffuses into the fluid is of order
 $(\unicode[STIX]{x1D705}t)^{1/2}$
. This length scale steadily increases. If we were to imagine this being substituted into the Rayleigh number, then we would see that the Rayleigh number would start from zero, and increase without bound. Thus we may expect that the fluid would start stable and become unstable at some point when the Rayleigh number passes some critical value. If we choose the Rayleigh number being
 $1$
as giving us an indication of when we may expect instabilities to form, then this gives us the corresponding length scale
 $$\begin{eqnarray}L=\left(\frac{\unicode[STIX]{x1D708}\unicode[STIX]{x1D705}}{g\unicode[STIX]{x1D6FC}\unicode[STIX]{x0394}T}\right)^{1/3}.\end{eqnarray}$$
This is the scale used by Foster (Reference Foster1965, Reference Foster1968). If we use
 $D=L$
then the non-dimensional equations would be the same as (2.3), but without the Rayleigh number.
For the Rayleigh–Bénard problem the difference in using the length scale (2.5) as opposed to
 $H$
would be that the upper boundary conditions would be imposed at
 $z=H/L$
instead of the more conventional
 $z=1$
. The stability problem would then consist of finding the critical value of
 $H/L$
above which the fluid would be unstable instead of finding the critical value of
 $Ra$
. For the classical Rayleigh–Bénard problem these critical values are related by
 $H/L=Ra^{1/3}$
.
The perturbation temperature equation for both cases with horizontal boundaries is given by
 $$\begin{eqnarray}\frac{\unicode[STIX]{x2202}T^{\prime }}{\unicode[STIX]{x2202}t^{\prime }}+\frac{\unicode[STIX]{x2202}\unicode[STIX]{x1D713}^{\prime }}{\unicode[STIX]{x2202}x^{\prime }}\frac{\unicode[STIX]{x2202}\overline{T}^{\prime }}{\unicode[STIX]{x2202}z^{\prime }}=\unicode[STIX]{x1D6FB}^{\prime 2}T^{\prime },\end{eqnarray}$$
and for vertical boundaries by
 $$\begin{eqnarray}\frac{\unicode[STIX]{x2202}T^{\prime }}{\unicode[STIX]{x2202}t^{\prime }}-\frac{\unicode[STIX]{x2202}\unicode[STIX]{x1D713}^{\prime }}{\unicode[STIX]{x2202}z^{\prime }}\frac{\unicode[STIX]{x2202}\overline{T}^{\prime }}{\unicode[STIX]{x2202}x^{\prime }}+\overline{W}^{\prime }\frac{\unicode[STIX]{x2202}T^{\prime }}{\unicode[STIX]{x2202}z^{\prime }}=\unicode[STIX]{x1D6FB}^{\prime 2}T^{\prime }.\end{eqnarray}$$
Henceforth we will drop the primes.
For the cases of semi-infinite fluids, the temperature and velocity profiles are intrinsically time-dependent. We want to investigate the development of linear instabilities in these cases. The method of analysis that we will use here is to assume that the instability is periodic along the boundary, with wavenumber
 $\unicode[STIX]{x1D6FC}$
, and look at two-dimensional disturbances. These will be calculated numerically in a layer parallel to the wall where the far boundary is sufficiently far away from the heated wall that we can assume that it plays no significant role in the background state, nor the instabilities that develop. This assumption is tested. In our numerics we will calculate the evolution of this linear solution on an evenly spaced grid, usually with 256 interior points, using a Crank–Nicolson scheme for the evolution of the vorticity and temperature on a staggered grid in time with central differences for the spatial derivatives. With the choice of the location of the far wall, the vorticity is located near the heated wall for the semi-infinite cases, dropping from the peak value by, typically, five orders of magnitude towards the far wall of the computational domain. Hence, in the far field, the streamfunction satisfies
 $\unicode[STIX]{x1D6FB}^{2}\unicode[STIX]{x1D713}\approx 0$
. By using the fact that the vorticity is minimal at this far wall, we set the numerical condition that it is zero, and allowing non-zero
 $\unicode[STIX]{x1D713}$
that decays exponentially as
 $\text{e}^{-\unicode[STIX]{x1D6FC}z}$
or
 $\text{e}^{-\unicode[STIX]{x1D6FC}x}$
as appropriate by setting the derivative of
 $\unicode[STIX]{x1D713}$
to
 $-\unicode[STIX]{x1D6FC}\unicode[STIX]{x1D713}$
. In this way we can further reduce the effect on the solution of using a finite domain.
In general we allow for initial conditions for the perturbations to be applied at some time,
 $t_{0}$
, after the start of heating, although for many of our calculations we will set
 $t_{0}=0$
. We then monitor the growth in the magnitude of the disturbances by using a suitable measure, which can be thought of as being like a generalized ‘energy’ of the disturbances. For a fluid heated from a horizontal boundary in a semi-infinite fluid, we will use
 $$\begin{eqnarray}E(t)=\frac{1}{2P}\int _{0}^{\infty }\int _{0}^{P}|\boldsymbol{u}|^{2}+\unicode[STIX]{x1D706}T^{2}\,\text{d}x\,\text{d}z,\end{eqnarray}$$
where
 $P=2\unicode[STIX]{x03C0}/\unicode[STIX]{x1D6FC}$
is the horizontal periodicity of the disturbances. If we take the vorticity to be the real part of
 $\unicode[STIX]{x1D714}(z,t)\text{e}^{\text{i}\unicode[STIX]{x1D6FC}x}$
, with similar definitions for
 $\unicode[STIX]{x1D713}$
and
 $T$
, then we can write (2.8) as
 $$\begin{eqnarray}E(t)=\frac{1}{4}\int _{0}^{\infty }\unicode[STIX]{x1D713}_{r}\unicode[STIX]{x1D714}_{r}+\unicode[STIX]{x1D713}_{i}\unicode[STIX]{x1D714}_{i}+\unicode[STIX]{x1D706}(T_{r}^{2}+T_{i}^{2})\,\text{d}z=E_{K}(t)+\unicode[STIX]{x1D706}E_{T}(t),\end{eqnarray}$$
where
 $\unicode[STIX]{x1D713}_{r}$
and
 $\unicode[STIX]{x1D713}_{i}$
are the real and imaginary parts of
 $\unicode[STIX]{x1D713}(z,t)$
, and similarly for
 $\unicode[STIX]{x1D714}$
and
 $T$
. The square root of this integral is a weighted norm of the disturbances where the positive parameter
 $\unicode[STIX]{x1D706}$
is as yet unspecified. For instabilities between two horizontal plates the upper limit in the integral is replaced by the location of the upper boundary. For a semi-infinite fluid heated from a vertical wall, the roles of
 $x$
and
 $z$
are swapped in (2.8) and (2.9). Other measures could be used, for example the enstrophy could replace the kinetic energy,
 $E_{K}(t)$
. These alternatives are not considered here.
Our objective is to find the optimal perturbation at
 $t_{0}$
to give the greatest growth in this ‘energy’ at some later time
 $t_{1}$
. In the studies of Foster (Reference Foster1965, Reference Foster1968) the focus was on the growth of the kinetic energy of disturbances that were initiated at
 $t_{0}=0$
with no temperature perturbation. This is equivalent to setting
 $\unicode[STIX]{x1D706}=0$
and restricting perturbations in the initial conditions to the vorticity only.
We express the numerical solution at the interior points as a vector
 $$\begin{eqnarray}\unicode[STIX]{x1D733}(t)=({T_{r}}_{1},{T_{r}}_{2},\ldots ,{T_{r}}_{N},{T_{i}}_{1},{T_{i}}_{2},\ldots ,{T_{i}}_{N},{\unicode[STIX]{x1D714}_{r}}_{1},{\unicode[STIX]{x1D714}_{r}}_{2},\ldots ,{\unicode[STIX]{x1D714}_{r}}_{N},{\unicode[STIX]{x1D714}_{i}}_{1},{\unicode[STIX]{x1D714}_{i}}_{2},\ldots ,{\unicode[STIX]{x1D714}_{i}}_{N})^{\text{T}},\end{eqnarray}$$
where
 $N$
is the number of interior points. For heating from horizontal boundaries, the lateral symmetry allows us to simplify the problem by setting, say, the real part of
 $T$
and the imaginary parts of
 $\unicode[STIX]{x1D714}$
and
 $\unicode[STIX]{x1D713}$
to zero. We can then express the numerical approximation to the ‘energy’ as
 $$\begin{eqnarray}E(t)=\unicode[STIX]{x1D733}(t)^{\text{T}}\unicode[STIX]{x1D63C}(\unicode[STIX]{x1D706})\unicode[STIX]{x1D733}(t)\end{eqnarray}$$
for an invertible symmetric matrix
 $\unicode[STIX]{x1D63C}(\unicode[STIX]{x1D706})$
, where T indicates the transpose. Note that the symmetry of this matrix is due to the numerical scheme used here. Other numerical schemes, for example ones using a non-uniform grid, may lead to an asymmetric
 $\unicode[STIX]{x1D63C}$
. This has a small effect on the analysis, which is mentioned below.
For given
 $t_{0}$
,
 $t_{1}$
and
 $\unicode[STIX]{x1D706}$
, we want to find the nature of the disturbance at
 $t_{0}$
that will maximize
 $E(t_{1})/E(t_{0})$
, or equivalently maximize
 $E(t_{1})$
with
 $E(t_{0})=1$
. As we are only looking at the linear evolution of the disturbances, the vector representation of the final solution at
 $t=t_{1}$
is linearly dependent on the vector representation at
 $t=t_{0}$
, and so we have
 $$\begin{eqnarray}\unicode[STIX]{x1D733}(t_{1})=\unicode[STIX]{x1D648}\unicode[STIX]{x1D733}(t_{0})\end{eqnarray}$$
for some transfer matrix
 $\unicode[STIX]{x1D648}$
. We find
 $\unicode[STIX]{x1D648}$
by performing repeated calculations of the numerical scheme with the initial conditions,
 $\unicode[STIX]{x1D733}(t_{0})$
, chosen so that one component is set to 1, with all other components set to 0. Each vector,
 $\unicode[STIX]{x1D733}(t_{1})$
, found by calculating the evolution from one of these initial conditions then gives the column of the transfer matrix,
 $\unicode[STIX]{x1D648}$
, corresponding to the non-zero initial component. Because of the translational symmetry of the problem, we only need to perform these calculations to find the columns of
 $\unicode[STIX]{x1D648}$
corresponding to, say, the components of
 $T_{r}$
and
 $\unicode[STIX]{x1D714}_{r}$
being set to 1. The columns corresponding to the components
 $T_{i}$
and
 $\unicode[STIX]{x1D714}_{i}$
being perturbed can then be inferred directly from these. The numerical calculation of this transfer matrix lends itself to simple parallelization.
We can now express our optimization problem as finding the vector
 $\unicode[STIX]{x1D733}$
that maximizes
 $$\begin{eqnarray}(\unicode[STIX]{x1D648}\unicode[STIX]{x1D733})^{\text{T}}\unicode[STIX]{x1D63C}(\unicode[STIX]{x1D648}\unicode[STIX]{x1D733})\quad \text{with }\unicode[STIX]{x1D733}^{\text{T}}\unicode[STIX]{x1D63C}\unicode[STIX]{x1D733}=1.\end{eqnarray}$$
Using a Lagrange multiplier,
 $\unicode[STIX]{x1D707}$
, this maximization problem requires finding the solution to
 $$\begin{eqnarray}\unicode[STIX]{x1D648}^{\text{T}}\unicode[STIX]{x1D63C}\unicode[STIX]{x1D648}\unicode[STIX]{x1D733}=\unicode[STIX]{x1D648}^{\text{T}}\unicode[STIX]{x1D63C}\unicode[STIX]{x1D648}\unicode[STIX]{x1D63C}^{-1}(\unicode[STIX]{x1D63C}\unicode[STIX]{x1D733})=\unicode[STIX]{x1D707}\unicode[STIX]{x1D63C}\unicode[STIX]{x1D733},\end{eqnarray}$$
an eigenvalue problem with eigenvector
 $\unicode[STIX]{x1D63C}\unicode[STIX]{x1D733}$
. If the numerical method used has an asymmetric
 $\unicode[STIX]{x1D63C}$
, then the resulting eigenvalue problem replaces
 $\unicode[STIX]{x1D63C}$
with its symmetric part:
 $(\unicode[STIX]{x1D63C}+\unicode[STIX]{x1D63C}^{\text{T}})/2$
.
If we premultiply (2.14) by
 $\unicode[STIX]{x1D733}^{\text{T}}$
we find
 $$\begin{eqnarray}\unicode[STIX]{x1D733}^{\text{T}}\unicode[STIX]{x1D648}^{\text{T}}\unicode[STIX]{x1D63C}\unicode[STIX]{x1D648}\unicode[STIX]{x1D733}=(\unicode[STIX]{x1D648}\unicode[STIX]{x1D733})^{\text{T}}\unicode[STIX]{x1D63C}(\unicode[STIX]{x1D648}\unicode[STIX]{x1D733})=\unicode[STIX]{x1D707}\unicode[STIX]{x1D733}^{\text{T}}\unicode[STIX]{x1D63C}\unicode[STIX]{x1D733}=\unicode[STIX]{x1D707}.\end{eqnarray}$$
From this it is clear that the maximum growth in ‘energy’,
 $E(t_{1})$
, is also the largest eigenvalue,
 $\unicode[STIX]{x1D707}$
. As all the eigenvalues are positive, we can find an eigenvector
 $\unicode[STIX]{x1D731}=\unicode[STIX]{x1D63C}\unicode[STIX]{x1D733}$
with the largest eigenvalue by the iteration scheme
 $$\begin{eqnarray}\unicode[STIX]{x1D731}_{n+1}=\frac{\unicode[STIX]{x1D648}^{\text{T}}\unicode[STIX]{x1D63C}\unicode[STIX]{x1D648}\unicode[STIX]{x1D63C}^{-1}\unicode[STIX]{x1D731}_{n}}{|\unicode[STIX]{x1D648}^{\text{T}}\unicode[STIX]{x1D63C}\unicode[STIX]{x1D648}\unicode[STIX]{x1D63C}^{-1}\unicode[STIX]{x1D731}_{n}|}.\end{eqnarray}$$
The initial values of the problem,
 $\unicode[STIX]{x1D733}$
, can then be determined by multiplying
 $\unicode[STIX]{x1D731}$
by
 $\unicode[STIX]{x1D63C}^{-1}$
and rescaling to ensure that
 $E(t_{0})=1$
. We will assume henceforth that
 $E(t_{0})=1$
in all cases, and so
 $E(t_{1})$
is the measure of the growth in the disturbance between
 $t=t_{0}$
and
 $t=t_{1}$
.
It should be noted that in this iteration
 $\unicode[STIX]{x1D731}_{1}$
is multiplied by
 $$\begin{eqnarray}(\unicode[STIX]{x1D648}^{\text{T}}\unicode[STIX]{x1D63C}\unicode[STIX]{x1D648}\unicode[STIX]{x1D63C}^{-1})^{n}=\unicode[STIX]{x1D648}^{\text{T}}\unicode[STIX]{x1D63C}\unicode[STIX]{x1D648}\unicode[STIX]{x1D63C}^{-1}\cdots \unicode[STIX]{x1D648}(\unicode[STIX]{x1D63C}^{-1}\unicode[STIX]{x1D648}^{\text{T}}\unicode[STIX]{x1D63C})\unicode[STIX]{x1D648}(\unicode[STIX]{x1D63C}^{-1}\unicode[STIX]{x1D648}^{\text{T}}\unicode[STIX]{x1D63C})\unicode[STIX]{x1D648}\cdots \unicode[STIX]{x1D648}^{\text{T}}\unicode[STIX]{x1D63C}\unicode[STIX]{x1D648}\unicode[STIX]{x1D63C}^{-1}.\end{eqnarray}$$
The grouping
 $(\unicode[STIX]{x1D63C}^{-1}\unicode[STIX]{x1D648}^{\text{T}}\unicode[STIX]{x1D63C})$
is the adjoint mapping,
 $\unicode[STIX]{x1D648}^{\ast }$
, of
 $\unicode[STIX]{x1D648}$
in the inner product vector space with inner product defined by
 $$\begin{eqnarray}\langle \unicode[STIX]{x1D733},\unicode[STIX]{x1D731}\rangle =\unicode[STIX]{x1D733}^{\text{T}}\unicode[STIX]{x1D63C}\unicode[STIX]{x1D731},\end{eqnarray}$$
that is to say, the matrix
 $\unicode[STIX]{x1D648}^{\ast }$
with the property
 $$\begin{eqnarray}\langle \unicode[STIX]{x1D733},\unicode[STIX]{x1D648}\unicode[STIX]{x1D731}\rangle =\langle \unicode[STIX]{x1D648}^{\ast }\unicode[STIX]{x1D733},\unicode[STIX]{x1D731}\rangle\end{eqnarray}$$
for all
 $\unicode[STIX]{x1D733}$
and
 $\unicode[STIX]{x1D731}$
. This means that this approach is essentially equivalent to the approach of deriving the adjoint differential equations and using an iterative scheme to find the optimum solutions by solving the full equations in the forward direction in time, followed by using the solution to these calculations as an initial condition for solving the adjoint differential equations backwards in time. These in turn provide the initial conditions for the forward calculations in the next iteration (see Luchini & Bottaro Reference Luchini and Bottaro2014). However, here we do not explicitly derive or solve the underlying adjoint differential equations.
The parameter
 $\unicode[STIX]{x1D706}$
has not yet been specified. For a set of calculations over the time interval from
 $t_{0}$
to
 $t_{1}$
, the bulk of the computational effort is involved in calculating the matrix
 $\unicode[STIX]{x1D648}$
, which is independent of
 $\unicode[STIX]{x1D706}$
. The parameter only appears in
 $\unicode[STIX]{x1D63C}$
, and thus finding the effect of varying
 $\unicode[STIX]{x1D706}$
on the optimum value of
 $E(t_{1})$
can be done independently of finding
 $\unicode[STIX]{x1D648}$
, and is relatively quick.
We will discuss the selection of
 $\unicode[STIX]{x1D706}$
in the following section, where the method is applied to the classical problem of heating a fluid from below in a horizontal layer. In the subsequent sections we apply the same principles for its selection to the cases of heating a semi-infinite fluid from a horizontal and from a vertical boundary.
3 Choosing the measure of the magnitude of the disturbances
In this section we look at the classic Rayleigh–Bénard problem of a linear temperature gradient between two horizontal boundaries in order to get an insight into the selection of the parameter
 $\unicode[STIX]{x1D706}$
in the measure of the size of the instabilities. Here we adopt the conventional non-dimensionalization, using the distance between the boundaries,
 $H$
, for the length scale, and so the Rayleigh number is the measure of the applied temperature difference.
For two horizontal boundaries the non-dimensional steady background state and boundary conditions for the perturbations are
 $$\begin{eqnarray}\overline{\boldsymbol{U}}(\boldsymbol{x},t)=\mathbf{0},\quad \overline{T}(\boldsymbol{x},t)=T_{0}/\unicode[STIX]{x0394}T+1-z,\end{eqnarray}$$
with
 $$\begin{eqnarray}\boldsymbol{u}=\mathbf{0},\quad T=0\quad \text{on }z=0,1.\end{eqnarray}$$
The approach of Foster (Reference Foster1965, Reference Foster1968) was to allow only a vorticity perturbation at the start
 $t=0$
, and then optimize the initial conditions to maximize the growth in kinetic energy. This is achieved here by setting
 $\unicode[STIX]{x1D706}=0$
and requiring the initial perturbation to the temperature to be zero. We can then find the optimal initial conditions for some choice of
 $t_{1}$
, and then follow the evolution of the disturbances. Doumenc et al. (Reference Doumenc, Boeck, Guerrier and Rossi2010) considered this case, and also the similar approach of maximizing the growth in
 $E_{T}(t)$
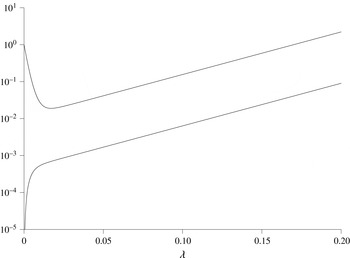
while restricting the initial perturbation to the velocity to be zero. A typical plot of the evolution of the kinetic energy,
 $E_{K}(t)$
, and the corresponding measure of the temperature perturbation,
 $E_{T}(t)$
, is shown in figure 3 for a supercritical
 $Ra=3000$
for
 $\unicode[STIX]{x1D6FC}=3.117$
and
 $t_{1}=0.2$
. Here there is an initial decrease in the kinetic energy, with a corresponding rise in
 $E_{T}(t)$
. They then both settle down to a linear growth in figure 3, which on this logarithmic plot corresponds to exponential growth of the disturbances. This final growth rate corresponds to the fastest-growing exponential mode of the basic steady state that can be found by more traditional linear stability analysis. If one were only to estimate the growth rate from the change of energy from the value at
 $t_{0}=0$
to the final value at some finite
 $t_{1}$
, then the growth rate found would always be less than this expected value. If
 $t_{1}$
were sufficiently large, this may not be a problem. Similarly, if one could identify the initial transient part of this evolution and ignore it, then what remains would be the exponential growth.
Plots of
 $E_{K}(t)/E_{K}(0)$
(upper line) and corresponding measure for the temperature,
 $E_{T}(t)/E_{K}(0)$
(
 $\times$
100) (lower line) for
 $Ra=3000$
,
 $\unicode[STIX]{x1D6FC}=3.117$
,
 $t_{0}=0$
and
 $t_{1}=0.2$
.

If we use the more general measure of the disturbance,
 $E(t)$
, given by (2.9), then we have to select an appropriate value of
 $\unicode[STIX]{x1D706}$
. Here we will identify two approaches that give the exponential growth rate obtained from traditional linear analysis. The first method is to look at the ratio of the kinetic energy,
 $E_{K}(t)$
, and temperature contributions,
 $\unicode[STIX]{x1D706}E_{T}(t)$
, to
 $E(t)$
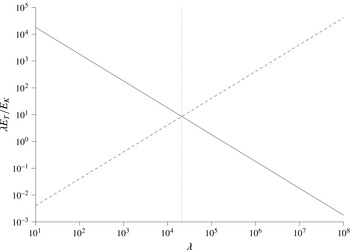
. For exponential growth, this ratio will remain constant. In figure 4 are plotted the ratios of
 $\unicode[STIX]{x1D706}E_{T}(t)$
to
 $E_{K}(t)$
at the start and end of a time interval as functions of
 $\unicode[STIX]{x1D706}$
for optimized growth. In this example the two lines
 $\unicode[STIX]{x1D706}E_{T}(t_{0})/E_{K}(t_{0})$
and
 $\unicode[STIX]{x1D706}E_{T}(t_{1})/E_{K}(t_{1})$
are very close to being straight lines on this log–log plot, with slopes
 $-1$
and +1, respectively. The two lines cross at
 $\unicode[STIX]{x1D706}=20\,994$
where the ratios are the same at the start and end of the time interval.
Graphs of the ratio
 $\unicode[STIX]{x1D706}E_{T}(0)/E_{K}(0)$
(solid line) and
 $\unicode[STIX]{x1D706}E_{T}(t_{1})/E_{K}(t_{1})$
at
 $t_{1}=0.2$
(dashed line) for
 $Ra=3000$
and
 $\unicode[STIX]{x1D6FC}=3.117$
. Also shown is the line (dotted) indicating
 $\unicode[STIX]{x1D706}=20\,994$
.

The second approach for selecting
 $\unicode[STIX]{x1D706}$
is to look at the estimated growth rates of the disturbances based on the growth of the disturbances using
 $$\begin{eqnarray}\frac{\ln (E(t_{1}))}{2(t_{1}-t_{0})}.\end{eqnarray}$$
Again using
 $Ra=3000$
and
 $\unicode[STIX]{x1D6FC}=3.117$
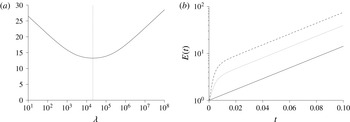
as a typical example, we get the results shown in figure 5(a) showing the estimated growth rate as a function of
 $\unicode[STIX]{x1D706}$
. This graph has a clearly defined minimum that is located at
 $\unicode[STIX]{x1D706}=20\,994$
, the same point as found by the crossing lines in figure 4. If we look at the evolution of
 $E(t)$
from
 $t_{0}=0$
to
 $t_{1}=0.1$
for the same example but with different values of
 $\unicode[STIX]{x1D706}$
, then we get the results as shown in figure 5(b). For
 $\unicode[STIX]{x1D706}=20\,994$
the growth is a straight line on this logarithmic plot, indicating exponential growth, which is at the growth rate expected from conventional linear stability analysis. For all other values of
 $\unicode[STIX]{x1D706}$
, there is an initial phase of faster growth before the growth of the instability settles down to the same exponential rate. Unless
 $\unicode[STIX]{x1D706}$
is chosen appropriately, the growth rate is always overestimated if the average growth from
 $t_{0}$
to
 $t_{1}$
is used. Some of the features we have seen here can be clarified by considering a simple model presented in appendix A.
Graphs showing (a) the estimated growth rate of the instabilities,
 $\ln (E(t_{1}))/(2(t_{1}-t_{0}))$
as a function of
 $\unicode[STIX]{x1D706}$
with
 $t_{1}=0.2$
, and (b) the evolution of
 $E(t)$
for
 $\unicode[STIX]{x1D706}=100\,000$
(dashed line),
 $\unicode[STIX]{x1D706}=1000$
(dotted) and
 $\unicode[STIX]{x1D706}=20\,993$
(solid line) for the case
 $Ra=3000$
,
 $\unicode[STIX]{x1D6FC}=3.117$
,
 $t_{0}=0$
and
 $t_{1}=0.1$
. Also shown in (a) is the dotted line indicating
 $\unicode[STIX]{x1D706}=20\,994$
.

We have seen that, unless we choose the parameter
 $\unicode[STIX]{x1D706}$
appropriately, we get an overestimate of the growth rate of the fastest-growing mode for the Rayleigh–Bénard problem. We identified two possible selection procedures that yield the expected exponential growth rate for a heated layer:
-
(i) equate the ratio of the contribution to
 $E(t)$
from
$E_{K}(t)$
and
$\unicode[STIX]{x1D706}E_{T}(t)$
at
$t_{0}$
and
$t_{1}$
,
-
(ii) minimize the optimal growth rate.


These approaches will give the expected exponential growth rate even if the total growth of the instabilities is only a few per cent, and the time interval
 $[t_{0},t_{1}]$
lies in the period of the initial adjustments before the disturbance settles down to the exponential growth, seen at the left end of figure 5(b).
Where the underlying disturbance of interest is an exponentially growing mode, as in this case, it is clear that the two alternative approaches will give the same value of
 $\unicode[STIX]{x1D706}$
. What may not be so obvious is that this is a more general result. The structure of the matrix
 $\unicode[STIX]{x1D63C}$
is
 $$\begin{eqnarray}\unicode[STIX]{x1D63C}=\left(\begin{array}{@{}cc@{}}\unicode[STIX]{x1D706}\unicode[STIX]{x1D63D} & 0\\ 0 & \unicode[STIX]{x1D63E}\end{array}\right),\end{eqnarray}$$
where
 $\unicode[STIX]{x1D63D}$
and
 $\unicode[STIX]{x1D63E}$
are symmetric matrices. For general
 $\unicode[STIX]{x1D733}(t)$
we have
 $$\begin{eqnarray}E_{T}(t)=\unicode[STIX]{x1D733}^{\text{T}}\left(\begin{array}{@{}cc@{}}\unicode[STIX]{x1D63D} & 0\\ 0 & 0\end{array}\right)\unicode[STIX]{x1D733}\quad \text{and}\quad E_{K}(t)=\unicode[STIX]{x1D733}^{\text{T}}\left(\begin{array}{@{}cc@{}}0 & 0\\ 0 & \unicode[STIX]{x1D63E}\end{array}\right)\unicode[STIX]{x1D733}.\end{eqnarray}$$
We observe that
 $$\begin{eqnarray}\frac{\unicode[STIX]{x2202}E(t)}{\unicode[STIX]{x2202}\unicode[STIX]{x1D706}}=E_{T}(t)+2\unicode[STIX]{x1D733}^{\text{T}}\unicode[STIX]{x1D63C}\frac{\unicode[STIX]{x2202}\unicode[STIX]{x1D733}}{\unicode[STIX]{x2202}\unicode[STIX]{x1D706}}.\end{eqnarray}$$
Our optimized solutions satisfy (2.14). Differentiating with respect to
 $\unicode[STIX]{x1D706}$
gives
 $$\begin{eqnarray}\unicode[STIX]{x1D648}^{\text{T}}\left(\begin{array}{@{}cc@{}}\unicode[STIX]{x1D63D} & 0\\ 0 & 0\end{array}\right)\unicode[STIX]{x1D648}\unicode[STIX]{x1D733}+\unicode[STIX]{x1D648}^{\text{T}}\unicode[STIX]{x1D63C}\unicode[STIX]{x1D648}\frac{\unicode[STIX]{x2202}\unicode[STIX]{x1D733}}{\unicode[STIX]{x2202}\unicode[STIX]{x1D706}}=\frac{\unicode[STIX]{x2202}\unicode[STIX]{x1D707}}{\unicode[STIX]{x2202}\unicode[STIX]{x1D706}}\unicode[STIX]{x1D63C}\unicode[STIX]{x1D733}+\unicode[STIX]{x1D707}\left(\begin{array}{@{}cc@{}}\unicode[STIX]{x1D63D} & 0\\ 0 & 0\end{array}\right)\unicode[STIX]{x1D733}+\unicode[STIX]{x1D707}\unicode[STIX]{x1D63C}\frac{\unicode[STIX]{x2202}\unicode[STIX]{x1D733}}{\unicode[STIX]{x2202}\unicode[STIX]{x1D706}}.\end{eqnarray}$$
If we premultiply this by
 $\unicode[STIX]{x1D733}^{\text{T}}$
and substitute in (3.6) evaluated at both
 $\unicode[STIX]{x1D733}(t_{0})$
and
 $\unicode[STIX]{x1D733}(t_{1})=\unicode[STIX]{x1D648}\unicode[STIX]{x1D733}(t_{0})$
, we find (after some manipulation)
 $$\begin{eqnarray}\frac{\unicode[STIX]{x2202}E(t_{1})}{\unicode[STIX]{x2202}\unicode[STIX]{x1D706}}=E_{T}(t_{1})-E(t_{1})E_{T}(t_{0}).\end{eqnarray}$$
We have used here that
 $E(t_{0})=1$
and so is independent of
 $\unicode[STIX]{x1D706}$
. It is straightforward to show that the statement
 $\unicode[STIX]{x1D706}E_{T}(t_{0})/E_{K}(t_{0})=\unicode[STIX]{x1D706}E_{T}(t_{1})/E_{K}(t_{1})$
is equivalent to the right side of (3.8) being zero. Hence the ratio test and the minimum growth-rate criteria are equivalent for more general
 $\unicode[STIX]{x1D648}$
representing the evolution of disturbances other than just exponential growth. This analysis assumes that the growth
 $E(t)$
has a smooth minimum as
 $\unicode[STIX]{x1D706}$
varies. However, we will see later that in some cases the derivative at the minimum can be undefined, and the above result may not hold (see figure 12
b).
Using the above criteria for selecting
 $\unicode[STIX]{x1D706}$
, it is found that it depends on
 $Ra$
,
 $\unicode[STIX]{x1D70E}$
and
 $\unicode[STIX]{x1D6FC}$
. No simple relationship has been found between these variables, except for the special case of marginal stability at the critical wavenumber, where
 $$\begin{eqnarray}\unicode[STIX]{x1D706}=\unicode[STIX]{x1D70E}Ra.\end{eqnarray}$$
This can be derived from the energy stability analysis of Joseph (Reference Joseph1965), where he showed that, for this choice of
 $\unicode[STIX]{x1D706}$
,
 $E(t)$
would decay for
 $Ra$
less than the critical value required for linear instability, even if the disturbances were nonlinear.
Although we have identified two equivalent ways of selecting
 $\unicode[STIX]{x1D706}$
that give what may be considered the ‘correct’ answer for the Rayleigh–Bénard problem, this may not be the appropriate choice in all circumstances. In real-world problems it may be that ambient disturbances to the velocity and temperature that initiate the linear instabilities may have a different ratio to those of the exponentially growing disturbances. For example, a large amount of background vibration may boost the velocity disturbances, or poorly designed heating elements in an experiment may give rise to a temperature field that is not as close to the ideal linear gradient as one would like, effectively boosting the temperature component. In these cases, imposing a restriction on the initial conditions and their contributions to
 $E_{K}(t)$
and
 $E_{T}(t)$
would seem to be unphysical. However, the selection methods here have the advantage of eliminating modes of instability that may be considered to be artificial in that they rely on the transfer of energy between the initial thermal disturbances and the kinetic energy to get an initial boost to
 $E(t)$
. Indeed, for large or small values of
 $\unicode[STIX]{x1D706}$
there would be apparently unstable modes even in the absence of a destabilizing background temperature gradient.
In the above example, the choices of
 $\unicode[STIX]{x1D706}$
would seem to provide a relatively robust way of identifying instability. Both methods for making the choice of
 $\unicode[STIX]{x1D706}$
are numerically straightforward. This will also be the case in the next section. However, there were found to be some cases for the problem of heating at a vertical sidewall where the presence of more than one unstable mode makes the selection criterion less straightforward. We will return to this later.
4 Heating semi-infinite fluid from a horizontal boundary
In this section we look at the stability of a semi-infinite fluid heated from below at a horizontal boundary. We restrict ourselves to the case where the dimensional wall temperature is assumed to instantaneously rise by
 $\unicode[STIX]{x0394}T$
at the initial time
 $t=0$
. The non-dimensional background state for a boundary at
 $z=0$
is
 $$\begin{eqnarray}\overline{\boldsymbol{U}}(\boldsymbol{x},t)=\mathbf{0},\quad \overline{T}(\boldsymbol{x},t)=\frac{T_{0}}{\unicode[STIX]{x0394}T}+\text{erfc}\left(\frac{z}{2t^{1/2}}\right),\end{eqnarray}$$
where
 $\text{erfc}(x)$
is the complementary error function. This is independent of the length scale in the non-dimensionalization, although we used (2.5). The boundary conditions are
 $$\begin{eqnarray}\boldsymbol{u}=\mathbf{0},\quad T=0\quad \text{on }z=0,\quad \text{and}\quad \boldsymbol{u}\rightarrow \mathbf{0},\quad T\rightarrow 0\quad \text{as }z\rightarrow \infty .\end{eqnarray}$$
One approach to evolving background states that has been used is to apply a quasi-static analysis. This assumes that the evolution of the background state can be ignored and an instantaneous stability analysis carried out. We include the results of such an analysis here for the purpose of comparison with later results, which do not make this assumption.
In the quasi-static or frozen-time analysis, we assume that the background temperature profile is steady, i.e. the dimensional
 $t$
in the temperature profile is taken to be a parameter, say
 $t_{q}$
, and we use the length scale
 $H=(\unicode[STIX]{x1D705}t_{q})^{1/2}$
. This makes the non-dimensional
 $t_{q}=1$
. The stability of this will then depend on the value of the Rayleigh number. A linear stability analysis of this profile tells us that the thermal layer is unstable for a no-slip boundary when
 $$\begin{eqnarray}Ra=\frac{g\unicode[STIX]{x1D6FC}\unicode[STIX]{x0394}TH^{3}}{\unicode[STIX]{x1D708}\unicode[STIX]{x1D705}}=\frac{g\unicode[STIX]{x1D6FC}\unicode[STIX]{x0394}T(\unicode[STIX]{x1D705}t_{q})^{3/2}}{\unicode[STIX]{x1D708}\unicode[STIX]{x1D705}}>\sqrt{\unicode[STIX]{x03C0}}.\end{eqnarray}$$
It should be noted that the critical value of
 $Ra=\unicode[STIX]{x03C0}^{1/2}$
(Kerr Reference Kerr2016) is around 1000 times smaller than the corresponding critical Rayleigh number for the Rayleigh–Bénard problem for a layer with two boundaries separated by a distance
 $H=(\unicode[STIX]{x1D705}t_{q})^{1/2}$
. The stability boundary of the critical value of
 $Ra$
as a function of the wavenumber,
 $\unicode[STIX]{x1D6FC}$
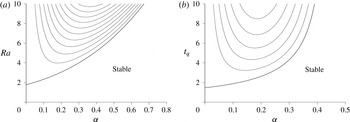
, is shown in figure 6(a). This does not depend on the Prandtl number,
 $\unicode[STIX]{x1D70E}$
. Also shown in figure 6(a) are the contours of the growth rate for unstable modes for
 $\unicode[STIX]{x1D70E}=7$
. These curves are dependent on the Prandtl number. This instability is a long-wave instability, with the growth rate proportional to
 $\unicode[STIX]{x1D6FC}^{2}$
for small
 $\unicode[STIX]{x1D6FC}$
for a given
 $Ra$
.
Stability boundary showing the critical value of (a)
 $Ra$
with
 $t_{q}=1$
and (b)
 $t_{q}$
with
 $Ra=1$
under the quasi-static assumption with
 $\unicode[STIX]{x1D70E}=7$
. Also shown in both cases are growth-rate contours with intervals of 0.02.

If we use the alternative formulation where
 $Ra=1$
, then, instead of looking for a critical value of
 $Ra$
, we look for the critical value of the non-dimensional time
 $t_{q}$
to instability. This gives the alternative, but equivalent, stability diagram shown in figure 6(b). Now the onset of instability is at
 $t_{q}=\unicode[STIX]{x03C0}^{1/3}$
. It should be noted that in both cases the rise in the growth rates as
 $Ra$
or
 $t_{q}$
increases is relatively slow. Although under this analysis instabilities may start growing for moderate values of, say,
 $t_{q}$
such as those shown in figure 6(b), under this quasi-static assumption the instabilities will not grow significantly in amplitude on this time scale. This means that the assumption that the evolution of the background state can be ignored on the time scale of growth of instabilities is violated. In other problems, if the transition from a stable regime to a fast-growing unstable regime is reasonably quick, then the quasi-static assumption could give a good indication of when the onset of instabilities will occur.
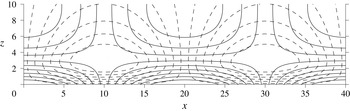
Typical marginally stable solutions found on the quasi-static stability boundary are shown in figure 7. The structure of the instabilities is split into two parts: a boundary layer with thickness of the order of the depth of temperature penetration that drives the instabilities, and an external region with size of the order of the wavelength of the instabilities where the fluid adjusts in response to the convection in the boundary layer. This general structure applies to all the instabilities in a semi-infinite fluid heated from below that will be covered in this section, and not just those found using the quasi-static assumption.
Contour plots of the instabilities showing the vorticity (solid lines) and temperature perturbation (dashed lines) for marginal stability for
 $\unicode[STIX]{x1D6FC}=0.15708$
.

In the study of the stability of the time-dependent thermal boundary layer, Foster (Reference Foster1965, Reference Foster1968) used a truncated orthonormal function expansion in
 $z$
for the temperature and vertical velocity. He fixed the initial condition, which consisted of a vertical velocity perturbation. His tests revealed that varying this initial condition had little effect on the results. He then monitored the change in the kinetic energy. He used the natural length scale
 $L$
given by (2.5). We first mimic Foster by fixing
 $t_{0}=0$
and only allowing initial conditions that are perturbations of the initial velocity, and look to maximize the growth of kinetic energy. We can then find the earliest time
 $t_{1}$
for instabilities to have grown so that their kinetic energy
 $E_{K}(t_{1})/E_{K}(0)$
has grown by some predetermined factor. The dependence of
 $t_{1}$
on the wavenumber,
 $\unicode[STIX]{x1D6FC}$
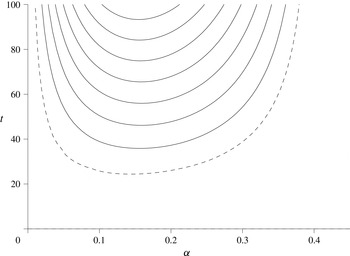
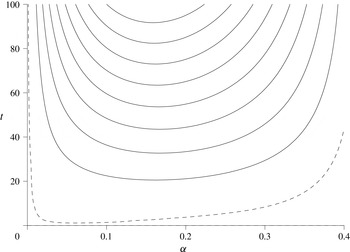
, is shown in figure 8 for a range of energy ratios. As with the Rayleigh–Bénard case, where there was only an initial perturbation to the velocity there is an initial decrease in the kinetic energy. Also shown in figure 8 is the time taken for the energy of the instabilities to return to their original levels (dashed line).
Graphs of the earliest times for the kinetic energy,
 $E_{K}(t)$
, to have grown by a factor of
 $10^{2},10^{4},10^{6},\ldots$
with
 $t_{0}=0$
(solid lines) as functions of the wavenumber,
 $\unicode[STIX]{x1D6FC}$
, for
 $\unicode[STIX]{x1D70E}=7$
and with initial perturbations restricted to the vorticity. Also shown is the time taken for the kinetic energy to first get back to its original level (dashed line).

For larger times than shown in figure 8 all the contours converge towards the axis at
 $\unicode[STIX]{x1D6FC}=0$
. However, by this stage the growth in amplitude of the instabilities will be very large, and assumptions of linearity are likely to have broken down.
If we now optimize
 $E(t_{1})$
, while still retaining
 $t_{0}=0$
, then the picture is altered. We now have to select an appropriate value of
 $\unicode[STIX]{x1D706}$
. We can use either of the two equivalent methods for selecting this value in the previous section: ensuring the ratio of the contributions of the kinetic energy and the temperature to
 $E(t)$
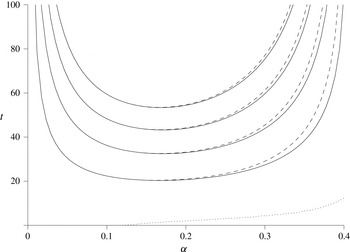
are the same at the start and at the finish, or minimizing the optimized growth as both are equivalent here. The results are as shown in figure 9. One notable difference between these results and the Foster (Reference Foster1965, Reference Foster1968) case shown in figure 8 is that the dashed line, which indicates the time taken for
 $E(t)$
to get back to its initial value, is significantly lower. This is more in line with the quasi-static analysis, which showed the existence of slowly growing solutions for quite small values of
 $t$
. The initial dip in the kinetic energy when there was no initial temperature perturbation was noted in the Rayleigh–Bénard case, but it is exacerbated here by the absence of a vertical background temperature gradient when
 $t=0$
. The need for this gradient to develop further delays the creation of the temperature perturbation. However, for the cases shown in figure 9, there is an initial temperature perturbation appropriate for a growing instability. This slows down the reduction in the kinetic energy, and all that is required is for the background temperature gradient to develop sufficiently for instabilities to grow. As we saw from the quasi-static analysis, the time when appropriate disturbances can start growing can be in the low single figures, which is compatible with the results seen in figure 9. For later times the growth in
 $E(t)$
is more that 100 times larger than the corresponding growth in the Foster case.
Plots of the earliest time for
 $E(t)$
to have grown by a factor of
 $10^{2},10^{4},10^{6},\ldots$
with
 $t_{0}=0$
(solid lines) as functions of the wavenumber,
 $\unicode[STIX]{x1D6FC}$
, for
 $\unicode[STIX]{x1D70E}=7$
with
 $\unicode[STIX]{x1D706}$
optimized. Also shown are the times taken for
 $E(t)$
to get back to its original level (dashed line).

Up to now we have only considered the case
 $t_{0}=0$
. When we optimize with respect to
 $t_{0}$
, to find the earliest time that any instability can grow by a given factor, then we obtain the results shown in figure 10. The corresponding values of
 $t_{0}$
are also shown as the dotted curve for the case
 $E(t_{1})=100$
. The curves for
 $t_{0}$
for the other values of
 $E(t_{1})$
lie almost exactly on the same curve, and are not shown. The dashed lines show the corresponding results with
 $t_{0}$
set to zero seen previously in figure 9. These two sets of curves only diverge towards the right-hand end. At the low point of each curve, where the globally optimal instabilities are to be found, the curves are almost indistinguishable. The left-hand ends of these graphs have low values of the wavenumbers, and the natural dissipation rate for these modes, which have a significant proportion of the disturbances outside the thermal boundary layers, is small. As such, an initial condition imposed at
 $t=0$
will change little before instability sets in.
The optimal value of
 $t_{1}$
(solid lines) as a function of
 $\unicode[STIX]{x1D6FC}$
for
 $E(t_{1})/E(t_{0})=10^{2}$
,
 $10^{4}$
,
 $10^{6}$
and
 $10^{8}$
, along with the corresponding value of
 $t_{0}$
for
 $E(t_{1})=10^{2}$
(dotted line). For comparison, the corresponding optimal values of
 $t_{1}$
with
 $t_{0}=0$
are also shown (dashed lines). These are for
 $\unicode[STIX]{x1D70E}=7$
with
 $\unicode[STIX]{x1D706}$
optimized.

All the above results presented so far have been for Prandtl number
 $\unicode[STIX]{x1D70E}=7$
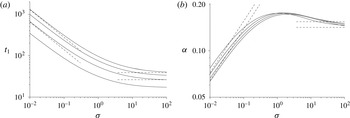
, a value appropriate for, say, water. Looking at a range of Prandtl numbers, we find that the minimum time for the growth of instabilities,
 $t_{1}$
, varies as shown in figure 11(a) for the case
 $t_{0}=0$
. These show that for large Prandtl numbers the time taken to the onset of instabilities levels off, while for small Prandtl numbers the slopes of the curves tend towards
 $-2/3$
and so the time to instability grows with
 $t_{1}\propto \unicode[STIX]{x1D70E}^{-2/3}$
. The wavenumbers,
 $\unicode[STIX]{x1D6FC}$
, decrease as
 $\unicode[STIX]{x1D70E}^{1/3}$
for small Prandtl numbers. For large Prandtl numbers the picture is not as clear, but there is an apparent levelling off of the curves.
Plots for
 $t_{0}=0$
showing the dependence on the Prandtl number of (a) time for instabilities to grow,
 $t_{1}$
, and (b) the wavenumber,
 $\unicode[STIX]{x1D6FC}$
, for
 $E(t_{1})=100$
,
 $10^{4}$
,
 $10^{6}$
and
 $10^{8}$
(from bottom to top in (a), and from top to bottom at the left end in (b)). Also shown are the small- and large-Prandtl-number asymptotics (dashed lines) for
 $E(t_{1})=10^{4}$
and
 $10^{8}$
. In all cases the optimal value of
 $\unicode[STIX]{x1D706}$
is used.

For the low-Prandtl-number limit, the viscous dissipation term becomes insignificant in comparison to the inertia terms. If we neglect the
 $\unicode[STIX]{x1D6FB}^{2}\unicode[STIX]{x1D714}$
term, and use the rescalings
 $$\begin{eqnarray}t=\unicode[STIX]{x1D70E}^{-2/3}t^{\prime },\quad \boldsymbol{x}=\unicode[STIX]{x1D70E}^{-1/3}\boldsymbol{x}^{\prime },\quad \unicode[STIX]{x1D714}=\unicode[STIX]{x1D70E}^{-2/3}\unicode[STIX]{x1D714}^{\prime },\quad \unicode[STIX]{x1D713}=\unicode[STIX]{x1D713}^{\prime },\quad T=T^{\prime },\end{eqnarray}$$
then the governing equations reduce to
 $$\begin{eqnarray}\displaystyle & \displaystyle \frac{\unicode[STIX]{x2202}\unicode[STIX]{x1D714}^{\prime }}{\unicode[STIX]{x2202}t^{\prime }}=\frac{\unicode[STIX]{x2202}T^{\prime }}{\unicode[STIX]{x2202}x^{\prime }}, & \displaystyle\end{eqnarray}$$
 $$\begin{eqnarray}\displaystyle & \displaystyle \left(\frac{\unicode[STIX]{x2202}^{2}}{\unicode[STIX]{x2202}x^{\prime 2}}+\frac{\unicode[STIX]{x2202}^{2}}{\unicode[STIX]{x2202}z^{\prime 2}}\right)\unicode[STIX]{x1D713}^{\prime }=-\unicode[STIX]{x1D714}^{\prime }, & \displaystyle\end{eqnarray}$$
 $$\begin{eqnarray}\displaystyle & \displaystyle \frac{\unicode[STIX]{x2202}T^{\prime }}{\unicode[STIX]{x2202}t^{\prime }}-\frac{\text{e}^{-(z^{\prime })^{2}/4t^{\prime }}}{(\unicode[STIX]{x03C0}t^{\prime })^{1/2}}w^{\prime }=\left(\frac{\unicode[STIX]{x2202}^{2}}{\unicode[STIX]{x2202}x^{\prime 2}}+\frac{\unicode[STIX]{x2202}^{2}}{\unicode[STIX]{x2202}z^{\prime 2}}\right)T^{\prime }. & \displaystyle\end{eqnarray}$$
 $\unicode[STIX]{x1D708}$
, that was present in the original length scaling (2.5). These equations can be solved in a similar way to the previous set of equations, with optimization for
 $\unicode[STIX]{x1D706}$
as before. For example, with
 $t_{0}=0$
and
 $E(t_{1})=10^{4}$
the optimum wavenumber is found to be
 $\unicode[STIX]{x1D6FC}^{\prime }=0.3353$
and
 $t_{1}^{\prime }=29.94$
, giving the corresponding asymptotic predictions
 $\unicode[STIX]{x1D6FC}=0.3353\unicode[STIX]{x1D70E}^{1/3}$
and
 $t_{1}=29.94\unicode[STIX]{x1D70E}^{-2/3}$
shown in figure 11, along with the corresponding low-Prandtl-number asymptotics for
 $E(t_{1})=10^{8}$
.
For the high-Prandtl-number limit, the inertial term becomes insignificant, with the fluid motion being a balance between the buoyancy forces and the viscous dissipation. With the inertia term neglected,
 $\unicode[STIX]{x1D70E}$
no longer appears in the governing equations, and so the instabilities do not depend on the Prandtl number at leading order. The governing equations now have the vorticity dependent directly on the instantaneous temperature, and so we only optimize over all possible initial conditions for the temperature. Otherwise the method is essentially the same as before. For example, with
 $t_{0}=0$
and with
 $E(t_{1})=10^{4}$
, the optimum
 $t_{1}$
and corresponding wavenumber are given by
 $t_{1}=26.30$
and
 $\unicode[STIX]{x1D6FC}=0.1543$
. These asymptotes are shown to the right of the graphs in figure 11 along with the corresponding lines for
 $E(t_{1})=10^{8}$
. The asymptotics for
 $t_{1}$
show good agreement; however those for
 $\unicode[STIX]{x1D6FC}$
are not as convincing.
If one also includes optimization for
 $t_{0}$
, then these curves and asymptotics are little changed. The low-Prandtl-number asymptotics indeed have
 $t_{0}=0$
. There is no viscous dissipation, and the instantaneous Rayleigh number becomes infinite as soon as the heating starts. However, the instabilities still take a finite time to grow. For the large-Prandtl-number asymptotics, we find
 $t_{1}$
to be weakly dependent on
 $t_{0}$
, with a small decrease in
 $t_{1}$
of around 0.6 % for
 $E(t_{1})=10^{4}$
when
 $t_{0}=2.60$
.
In this section we have investigated the optimal time for instabilities to grow for a semi-infinite fluid heated from below by a sudden increase in the temperature at the boundary. Because the initial state allows perturbations to both the vorticity and the temperature, the onset of instability is sooner than that found by Foster (Reference Foster1965, Reference Foster1968) and the overall growth is subsequently significantly larger. Allowing the instabilities to start at some time after the onset of heating did not, unfortunately, have a significant impact with, at best, only a marginal decrease in the time for a given growth of the instabilities.
5 Heating a semi-infinite fluid from a vertical boundary
In this section we look at the instabilities that can form at a heated vertical boundary. For a semi-infinite fluid the heat diffuses into the fluid just as for the horizontal boundary, but now the buoyant boundary layer induces an upwards flow parallel to the wall. The non-dimensional vertical flow and temperature profiles are given by (for
 $\unicode[STIX]{x1D70E}\neq 1$
)
 $$\begin{eqnarray}\displaystyle \overline{\boldsymbol{U}}(\boldsymbol{x},t)=\overline{W}(x,t)\hat{\boldsymbol{z}} & = & \displaystyle \frac{\unicode[STIX]{x1D70E}}{(1-\unicode[STIX]{x1D70E})}\left(\left(t+\frac{x^{2}}{2}\right)\text{erfc}\left(\frac{x}{2t^{1/2}}\right)-\frac{xt^{1/2}}{\unicode[STIX]{x03C0}^{1/2}}\exp \left(-\frac{x^{2}}{4t}\right)\right.\nonumber\\ \displaystyle & & \displaystyle -\left.\left(t+\frac{x^{2}}{2\unicode[STIX]{x1D70E}}\right)\text{erfc}\left(\frac{x}{2(\unicode[STIX]{x1D70E}t)^{1/2}}\right)+\frac{xt^{1/2}}{(\unicode[STIX]{x1D70E}\unicode[STIX]{x03C0})^{1/2}}\exp \left(-\frac{x^{2}}{4\unicode[STIX]{x1D70E}t}\right)\right)\hat{\boldsymbol{z}},\nonumber\\ \displaystyle & & \displaystyle\end{eqnarray}$$
 $$\begin{eqnarray}\displaystyle \overline{T}(\boldsymbol{x},t) & = & \displaystyle \frac{T_{0}}{\unicode[STIX]{x0394}T}+\text{erfc}\left(\frac{x}{2t^{1/2}}\right).\end{eqnarray}$$
 $$\begin{eqnarray}\boldsymbol{u}=\mathbf{0},\quad T=0\quad \text{on }x=0,\quad \text{and}\quad \boldsymbol{u}\rightarrow \mathbf{0},\quad T\rightarrow 0\quad \text{as }x\rightarrow \infty .\end{eqnarray}$$
Here we have used the natural scaling (2.5) in the non-dimensionalization. For lateral heating in a vertical slot of width
 $H$
, the Grashof number, given by
 $$\begin{eqnarray}Gr=\frac{g\unicode[STIX]{x1D6FC}\unicode[STIX]{x0394}TH^{3}}{\unicode[STIX]{x1D708}^{2}},\end{eqnarray}$$
is often used instead of the Rayleigh number. This could also be used to define a length scale by using the length
 $H$
that makes this unity. This would result in an alternative length scale that differs from the length scale (2.5) by a factor of
 $\unicode[STIX]{x1D70E}^{1/3}$
, with corresponding changes to other scalings used in the non-dimensionalization. However, we will retain our previous definition of
 $L$
to maintain compatibility between the problems considered here.
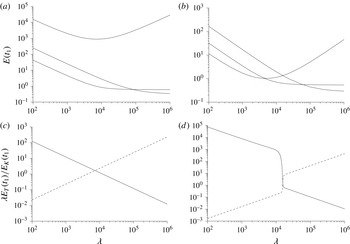
Graphs of the growth
 $E(t_{1})$
as functions of
 $\unicode[STIX]{x1D706}$
for the three most unstable modes for
 $\unicode[STIX]{x1D70E}=7$
,
 $t_{0}=0$
and
 $t_{1}=160$
with (a)
 $\unicode[STIX]{x1D6FC}=0.030$
and (b)
 $\unicode[STIX]{x1D6FC}=0.035$
. The corresponding ratios
 $\unicode[STIX]{x1D706}E_{T}(0)/E_{K}(0)$
(solid lines) and
 $\unicode[STIX]{x1D706}E_{T}(t_{1})/E_{K}(t_{1})$
(dashed lines) for the most unstable mode are shown in (c) and (d), respectively.

The governing equations for linear disturbances are solved in a similar numerical way to those of the previous section but with one main difference. Because there is a background flow along the wall, we no longer have stationary instabilities and have to calculate both the real and imaginary parts of
 $\unicode[STIX]{x1D714}$
,
 $\unicode[STIX]{x1D713}$
and
 $T$
.
The two equivalent methods for selecting
 $\unicode[STIX]{x1D706}$
usually worked well. A typical example of the growth of the instabilities as a function of
 $\unicode[STIX]{x1D706}$
is shown in the upper curve of figure 12(a), and the corresponding ratios
 $\unicode[STIX]{x1D706}E_{T}(0)/E_{K}(0)$
and
 $\unicode[STIX]{x1D706}E_{T}(t_{1})/E_{K}(t_{1})$
are shown in figure 12(c). As expected, the minimum of the former coincides with the crossing of the two lines in the latter, both being at
 $\unicode[STIX]{x1D706}=6676$
in this example. The bottom two lines in figure 12(a) show the growth of the eigenvectors of (2.14) with the next two largest eigenvalues, calculated using the numerical package LAPACK. These extra eigenmodes are not significant for this case. However, for some values of the parameters, it is possible to have a change in the most unstable mode as
 $\unicode[STIX]{x1D706}$
varies. This was not found to happen in the bottom heating case of the previous sections. An example of this transition is shown in figure 12(b,d) for a case with the wavenumber,
 $\unicode[STIX]{x1D6FC}$
, slightly larger than the previous example. The corresponding growth of the three modes with the largest eigenvalues is shown in figure 12(b) as functions of
 $\unicode[STIX]{x1D706}$
. This time the lines all cross over each other. Although the curve found for the maximum growth as a function of
 $\unicode[STIX]{x1D706}$
still has a well-defined minimum, it is no longer as smooth, but has a discontinuity in its derivative at its lowest point. The lines for
 $\unicode[STIX]{x1D706}E_{T}(0)/E_{K}(0)$
and
 $\unicode[STIX]{x1D706}E_{T}(t_{1})/E_{K}(t_{1})$
in figure 12(d) still cross over near the minimum of the growth rate, but the apparent continuity of these curves, although rapidly changing near the crossover, would appear to be due to numerical effects in the eigenvalue solver, which results in a degree of smoothing in what one would expect to be curves with discontinuities.
Growth in energy of instabilities, with
 $\unicode[STIX]{x1D70E}=7$
. Contours at
 $E(t_{1})=10,100,1000,\ldots$
with
 $t_{0}=0$
.

Growth in
 $E(t)$
of instabilities for (a)
 $\unicode[STIX]{x1D70E}=0.1$
, (b)
 $\unicode[STIX]{x1D70E}=1$
, (c)
 $\unicode[STIX]{x1D70E}=3$
, (d)
 $\unicode[STIX]{x1D70E}=7$
, (e)
 $\unicode[STIX]{x1D70E}=10$
and (f)
 $\unicode[STIX]{x1D70E}=20$
as functions of
 $\unicode[STIX]{x1D6FC}$
. The contours are for
 $E(t_{1})=10,100,1000,\ldots$
with
 $t_{0}=0$
.

When the same mode is the most unstable for all values of
 $\unicode[STIX]{x1D706}$
, then the selection of the appropriate value is straightforward. When we have the more complex picture, then we can still choose the value of
 $\unicode[STIX]{x1D706}$
corresponding to the minimum of the maximized growth in energy. At such a point there is a degree of degeneracy in the problem, and the eigenvector from (2.14) is no longer uniquely defined. It would be possible to look at each eigenmode individually and find its minimum growth rate, or point where the initial and final energy ratios are the same. However, this does not necessarily make much sense physically, as for any such choice of
 $\unicode[STIX]{x1D706}$
the most unstable mode will not be one that is identified by such an approach.
The above argument would seem to indicate that the most appropriate method of choosing
 $\unicode[STIX]{x1D706}$
is to select the value corresponding to the minimum growth. However, this is not without some practical difficulties. As can be seen towards the right of figure 12(a,b), some modes have very flat sections in their growth. The value of
 $\unicode[STIX]{x1D706}$
for minimum growth for such modes can be relatively hard to identify numerically. Problematic cases were only found for modes that did not grow significantly, or which had grown and then subsequently reduced in magnitude, and are not relevant to the main results presented here.
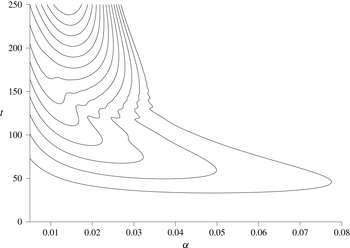
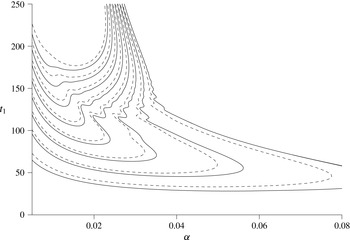
Contours of the optimized growth ratios
 $E(t_{1})$
of instabilities as functions of the wavenumber,
 $\unicode[STIX]{x1D6FC}$
, for
 $\unicode[STIX]{x1D70E}=7$
and
 $t_{0}=0$
are shown in figure 13. There appears to be a transition in the behaviour around
 $t=120$
. Below this value is a relatively short wavelength instability that grows and then decays, having reached a maximum
 $E(t)$
of at most around
 $10^{4}$
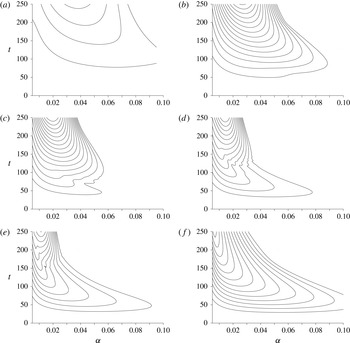
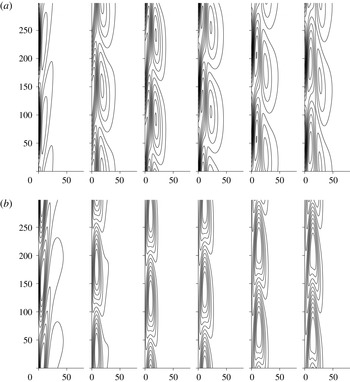
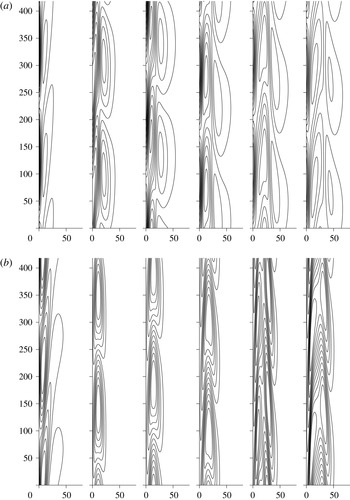
. At subsequent times a marginally longer wavelength instability takes over which can display much more substantial and sustained growth. How this picture varies as the Prandtl number changes is shown in figure 14, where the equivalent plots are shown for a range of Prandtl numbers. Here we see that there is a transition between the small- and large-Prandtl-number behaviours, with
 $\unicode[STIX]{x1D70E}=7$
in the midst of this transition. The region corresponding to
 $t\lesssim 120$
for
 $\unicode[STIX]{x1D70E}=7$
is dominated by the large-Prandtl-number mode. This region grows as the Prandtl number increases. The first indication of the presence of the large-Prandtl-number mode can be seen in the case
 $\unicode[STIX]{x1D70E}=1$
, and more clearly seen when
 $\unicode[STIX]{x1D70E}=3$
. By the time the Prandtl number approaches 20, the large-Prandtl-number mode dominates as seen in figure 14(e,f), but it is still taken over by the small-Prandtl-number mode for larger times than is shown here. However, as
 $E(t_{1})>10^{13}$
it is not clear that this linear analysis will be relevant in practical problems, as nonlinear effects are likely to be important by this stage.
It is the presence of the two modes that can be used to explain the wiggles in the contours observed in figure 13 and in some of the examples in figure 14. If two different modes are present, they will typically move upwards at different rates. For given amplitudes of the modes, we would expect that in some alignments the value of
 $E(t)$
is enhanced and in some alignments it will be decreased. For some time intervals,
 $[t_{0},t_{1}]$
, it is possible for the modes to start off in an alignment that diminishes
 $E(t)$
, and end up in an alignment that enhances it. This will result in some boost in the apparent growth. For other time intervals, the modes would start and finish with either
 $E(t)$
enhanced at both
 $t_{0}$
and
 $t_{1}$
, or diminished. In these cases there would not be such an apparent boost to the growth. Hence in the region where neither mode dominates, one could expect there to be the possibility of some variability in the growth of
 $E(t)$
due to the variation in the length of the time interval
 $[t_{0},t_{1}]$
, in addition to that caused by the underlying growth of the instabilities. This effect is shown by the wiggly contours.
The most unstable modes, where a given growth in
 $E(t)$
is attained soonest for the case
 $t_{0}=0$
, are given by the minimum of these curves. If we look at the effect of varying the Prandtl number on the most unstable modes for growths of
 $E(t)$
by factors of
 $10^{2}$
,
 $10^{4}$
,
 $10^{6}$
and
 $10^{8}$
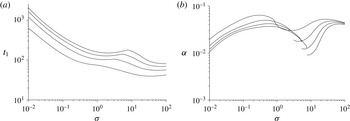
, then we obtain the results shown in figure 15. The general trends are similar to those for heating from a lower boundary found in the previous section. The most unstable modes have a transition due to the appearance of the large-Prandtl-number mode. There is a transition indicated by the kinks in the curves for
 $t_{1}$
for
 $E(t_{1})=10^{4}$
,
 $10^{6}$
and
 $10^{8}$
, where the minimum associated with the large-Prandtl-number mode takes over as the global minimum. This is shown by the corresponding jumps in the wavenumbers,
 $\unicode[STIX]{x1D6FC}$
. In the limits of both large and small Prandtl numbers, the approaches that yielded the asymptotics for the bottom heating cases did not yield results as readily. It seems that the shear is important to these instabilities. The analysis of shear-driven instabilities is more complicated (see, for example, Drazin & Reid Reference Drazin and Reid1981) and is beyond the scope of this paper.
Plots showing the dependence on the Prandtl number of (a) time for instabilities to grow,
 $t_{1}$
, and (b) the wavenumber,
 $\unicode[STIX]{x1D6FC}$
, for
 $E(t_{1})=10^{2},~10^{4},~10^{6}$
and
 $10^{8}$
(from bottom to top in (a), and from top to bottom at both ends in (b)) for
 $t_{0}=0$
.

The above results have
 $t_{0}=0$
. If we allow
 $t_{0}$
to vary and find the corresponding optimized values of
 $t_{1}$
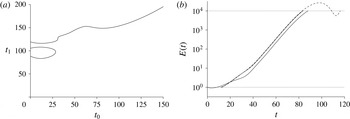
, we often find that there is a relatively complex relationship between the two. An example is shown in figure 16(a) for the case
 $E(t_{1})=10^{4}$
, with
 $\unicode[STIX]{x1D6FC}=0.02106$
and
 $\unicode[STIX]{x1D70E}=7$
. This choice of
 $\unicode[STIX]{x1D6FC}$
corresponds to the overall optimal instability for
 $E(t_{1})=10^{4}$
, as we shall see later. The overall minimum value of
 $t_{1}$
is found at the bottom of the isolated loop at the left of this plot. The maximum of this loop and the overall minimum of the main line both have a role in the overall stability boundary. When we vary
 $\unicode[STIX]{x1D6FC}$
we find that the loop observed in figure 16(a) merges with the main line for smaller values of
 $\unicode[STIX]{x1D6FC}$
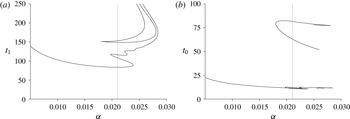
, while as
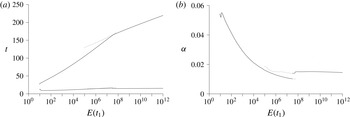
 $\unicode[STIX]{x1D6FC}$
increases this loop shrinks and vanishes. Not shown here is that the main line in figure 16(a) continues to rise and then doubles back on itself to form a larger loop that rejoins the axis to the left at much higher values of
 $t_{1}$
, and so the optimized solution eventually decays with
 $E(t)<10^{4}$
for this value of
 $\unicode[STIX]{x1D6FC}$
.
(a) The optimal value of the end time,
 $t_{1}$
, as a function of the start time,
 $t_{0}$
, for growth
 $E(t_{1})=10^{4}$
, with
 $\unicode[STIX]{x1D6FC}=0.02106$
and
 $\unicode[STIX]{x1D70E}=7$
. (b) The evolution of
 $E(t)$
for the examples with
 $t_{0}=0$
and the global minimum of (a) (solid lines). Also shown is the growth corresponding to the minimum of the main curve (dashed line).

The evolution of
 $E(t)$
for the mode with the overall minimum value of
 $t_{1}$
and the optimal mode with
 $t_{0}=0$
are shown by the two solid lines of figure 16(b). These cross over after a short time and then grow approximately in parallel, showing that the optimal solution, which starts at a slightly later time, avoids a brief period of decay and an initial period of more sluggish growth experienced when
 $t_{0}=0$
. The dashed curve in figure 16(b) represents the growth of the mode corresponding to the first minimum of the upper branch in figure 16(a). In the evolution of this mode,
 $E(t)$
exceeds
 $10^{4}$
before undergoing a short period of decay, dropping to below the threshold level and then rising again. It can be observed that this dashed line reaches the level of
 $10^{4}$
fractionally before the optimal value. This is because the value of
 $\unicode[STIX]{x1D706}$
is optimized for each mode, and the two cases will have different values. When
 $\unicode[STIX]{x1D706}$
is optimized for the overall minimum growth, other values of
 $\unicode[STIX]{x1D706}$
will result in apparently faster-growing modes.
The variation with
 $\unicode[STIX]{x1D6FC}$
of the values of
 $t_{1}$
at the maxima and minima of the curves in figure 16(a) are shown in figure 17(a). The corresponding values of
 $t_{0}$
are shown in figure 17(b). The dotted lines indicates
 $\unicode[STIX]{x1D6FC}=0.02106$
, the overall minimum of the curves in figure 17(a). This is the value used for the results in figure 16. The main line in figure 17(a) cuts the dotted line three times. These correspond to the two minima and the maximum at the left of figure 16(a). The S-shaped nature of the curve as it passes through the points corresponds to the joining of the isolated loop with the main branch of solutions for lower
 $\unicode[STIX]{x1D6FC}$
, and the vanishing of the loop for larger values mentioned earlier. The boomerang-shaped curve corresponds to the other maximum and minimum in figure 17(a) and do not play a significant part in overall stability of this problem. It occurs for larger values of
 $t_{0}$
, which are shown in the upper curve of figure 17(b). For values of
 $\unicode[STIX]{x1D6FC}$
beyond the right end of the main curve in figure 17, no optimized instabilities have
 $E(t)$
that reach
 $10^{4}$
.
(a) The locations of the maxima and minima of the
 $t_{0}$
–
 $t_{1}$
plots as functions of
 $\unicode[STIX]{x1D6FC}$
for
 $E(t_{1})=10^{4}$
, with
 $\unicode[STIX]{x1D70E}=7$
. (b) The corresponding values of
 $t_{0}$
. The vertical dotted line shows
 $\unicode[STIX]{x1D6FC}=0.02106$
, the value used in figure 16.

The minimum time,
 $t_{1}$
, of the first instabilities to grow by factors of
 $10,10^{2},\ldots ,10^{8}$
as functions of
 $\unicode[STIX]{x1D6FC}$
(solid lines) when the initial time,
 $t_{0}$
, is optimized for
 $\unicode[STIX]{x1D70E}=7$
. The dashed lines show the corresponding curves when
 $t_{0}=0$
.

The curves of
 $t_{1}$
as functions of
 $\unicode[STIX]{x1D6FC}$
for a selection of values of
 $E(t_{1})$
and all optimized with respect to
 $t_{0}$
are shown in figure 18. Only shown are the curves corresponding to the main curve of figure 17(a). The lowest parts of the solid curves show the first times,
 $t_{1}$
, for the growth of
 $E(t)$
by factors of
 $10,100,\ldots ,10^{8}$
and corresponds to the full optimal solutions for these problems. Also shown are the corresponding values of
 $t_{1}$
when
 $t_{0}=0$
(dashed lines) as previously seen in figure 13. From this we see that optimizing for
 $t_{0}$
does result in an earlier growth in the instabilities by the given factors, but not by a large amount. All the features associated with the
 $t_{0}=0$
instabilities such as the wiggly lines are again present. The upper part of the
 $E(t_{1})=10$
curve with
 $0.033\lesssim \unicode[STIX]{x1D6FC}\lesssim 0.066$
is the only section of these curves where the minimum in the maximum growth as
 $\unicode[STIX]{x1D706}$
is varied is not a simple minimum, but corresponds to a change in the most unstable mode similar to the case illustrated in figure 12(b).
The form of the instabilities is different for the small- and large-Prandtl-number modes. The evolution of the instabilities between
 $t_{0}$
and
 $t_{1}$
for the lowest value of
 $t_{1}$
with
 $E(t_{1})=10^{4}$
and
 $\unicode[STIX]{x1D70E}=7$
is shown in figure 19. This case lies entirely within the large-Prandtl-number regime. The temperature perturbation settles down to an arrowhead shape centred on the centre of the background upwards flow.
The evolution of (a) the vorticity perturbations and (b) the temperature perturbations for the mode with the earliest growth
 $E(t_{1})=10^{4}$
, for
 $\unicode[STIX]{x1D6FC}=0.02106$
for
 $\unicode[STIX]{x1D70E}=7$
. At the left are the initial conditions at
 $t_{0}=11.52$
and at the right the evolved instabilities at
 $t_{1}=83.42$
with the intermediate steps shown at equal time intervals.

The evolution of (a) the vorticity perturbations and (b) the temperature perturbations for the mode with the earliest growth
 $E(t_{1})=10^{4}$
, for
 $\unicode[STIX]{x1D6FC}=0.01503$
and
 $\unicode[STIX]{x1D70E}=7$
. At the left are the initial conditions at
 $t=t_{0}=14.17$
and at the right the evolved instabilities at
 $t=t_{1}=171.34$
with the intermediate steps shown at equal time intervals.

If we look at the evolution of the instabilities for the case
 $E(t_{1})=10^{8}$
, as shown in figure 20, we see that initially their form is similar to the previous case. Roughly two-thirds of the way through the growth of the instabilities their form changes. This point corresponds to the transition from the region of instability associated with high Prandtl number to that associated with low Prandtl number identified in figure 14. The maximum vorticity perturbation is now closer to the wall in the region of greatest shear. The temperature perturbation no longer has a maximum near the location of the maximum upwards velocity, but has a wider shape, with maxima on either side of the maximum upflow.
The difference between the initial and later phases of the instability can also be seen in the plots of the contribution to
 $E(t)$
from
 $E_{K}(t)$
and
 $\unicode[STIX]{x1D706}E_{T}(t)$
shown in figure 21 for the above two cases. For the case where
 $E(t_{1})=10^{4}$
, most of the contribution to
 $E(t)$
comes from the temperature component. The instabilities are centred on the region of maximum upwards velocity in the background flow – the region of least shear. This is also true in the first part of the case with
 $E(t_{1})=10^{8}$
. Here
 $E(t)$
grows until it reaches a local maximum at a level that is in line with maxima observed in the evolution of the large-Prandtl-number modes. There is then a transition to a new mode where
 $E_{K}(t)$
and
 $\unicode[STIX]{x1D706}E_{T}(t)$
are much closer in size.
Growth in
 $E(t)$
of optimized instabilities with
 $E(t_{0})=1$
for
 $t$
between
 $t_{0}$
and
 $t_{1}$
for (a)
 $E(t_{1})=10^{4}$
and (b)
 $E(t_{1})=10^{8}$
. Also shown are the contributions to these from
 $E_{K}(t)$
(dashed line) and
 $\unicode[STIX]{x1D706}E_{T}(t)$
(chained line). These have
 $\unicode[STIX]{x1D70E}=7$
.

In the above examples, although the initial growth rate of
 $E(t)$
is reasonably constant, there are signs of small adjustments in
 $E_{K}(t)$
and
 $\unicode[STIX]{x1D706}E_{T}(t)$
similar to those observed when
 $\unicode[STIX]{x1D706}$
was not optimal for the Rayleigh–Bénard case. One possible explanation of this is that the selection method for
 $\unicode[STIX]{x1D706}$
ensures that the ratios
 $E_{T}(t_{0})/E_{K}(t_{0})$
and
 $E_{T}(t_{1})/E_{K}(t_{1})$
are identical. This ratio is determined at the end primarily by the fastest-growing mode, and so the initial conditions have to satisfy a constraint that may not match up to the ratio in the initial mode of growth. The mismatch is greater in the
 $E(t_{1})=10^{8}$
case where the initial and final growth modes are clearly different. In addition, the optimal initial conditions found for both cases do not resemble the instabilities once they have evolved. The initial conditions have a slope that is the opposite direction to that which you get when the shear acts on the instabilities, and which is observed for the later stages of their evolution. This could allow the instabilities to have an initial stage of boosted growth before shear starts to have a limiting effect.
The results of simulations with random noise shown in figure 1 correspond to the calculations shown in figure 21(b), using the same values of
 $\unicode[STIX]{x1D6FC}$
and
 $\unicode[STIX]{x1D706}$
. The simulations were subject to random noise being added to the temperature perturbation throughout the run, which started at
 $t=-160$
to allow the perturbations to settle down to an approximate statistically steady state before the heating of the wall starts. The general growth of the randomly driven simulations in the last half of the time interval shown are clearly similar to the growth shown in figure 21(b) for nearly all cases. However, details of the onset of instability, and of the size of the growth, are hidden by the random noise in the first half of the interval.
The earliest times,
 $t_{1}$
, taken for instabilities to grow by a given factor when optimized for the wavenumber,
 $\unicode[STIX]{x1D6FC}$
, and the start time,
 $t_{0}$
, are shown in figure 22(a), where the values of
 $t_{0}$
are also shown. The corresponding value of
 $\unicode[STIX]{x1D6FC}$
is shown in figure 22(b). Each result is made up of two parts. For lower values of
 $E(t_{1})$
these correspond to the minimum of the large-Prandtl-number modes, while for larger values it is the minimum of the small-Prandtl-number mode. In the transition region there are at least two minima, with the values corresponding to the continuations of the global minima shown here. The presence of the wiggles leads to other short-lived minima, which are not significant in the overall dynamics. Clearly visible in this plot is the transition between the two modes of instability, with the relatively slow-growing large-Prandtl-number mode giving way to the faster-growing small-Prandtl-number modes for larger growths.
Graphs of (a)
 $t_{1}$
(upper curves) and
 $t_{0}$
(lower curves) and (b)
 $\unicode[STIX]{x1D6FC}$
for the fully optimized solutions as functions of
 $E(t_{1})$
for
 $\unicode[STIX]{x1D70E}=7$
.

One feature of interest is that for both the large- and small-Prandtl-number branches the relationship between
 $t_{1}$
and
 $E(t_{1})$
is approximately linear on these graphs, indicating no significant change in the growth rates once the instabilities are established. This is despite the fact that the temperature profile and the background flow are evolving. Both the instantaneous Rayleigh number and Reynolds number grow as
 $t^{3/2}$
.
There is also a significant variation in the wavenumber for the most unstable modes as the growth increases for the initial large-Prandtl-number mode. However, there is relatively little variation once the small-Prandtl-number mode takes over; thus the instabilities that one may observe could have a relatively well-defined wavelength.
In this section we have investigated the growth of instabilities in the evolving boundary-layer flow generated by the heating of a fluid at a vertical wall. In looking for the earliest growth of the size of the instabilities, as measured by
 $E(t)$
, we have shown that this growth can be advanced by delaying the imposition of the initial conditions. However, this enhancement is not huge for this problem.
6 Conclusions
The developments of instabilities of a fluid with an evolving background temperature gradient are investigated using an approach that finds the optimal initial conditions to ensure the maximum growth in terms of a measure of the amplitude of the instabilities. This measure is adjusted in order to minimize this maximum growth, to ensure that the growth observed is real and not an artefact caused by the transfer of energy from the initial temperature perturbation to the velocity, or the reverse. This selection method is the equivalent of ensuring the ratio of the contributions to the measure of the size of the instabilities,
 $E(t)$
, from the velocity and the temperature are the same at the start and end of the growth period. This approach ensures that the instabilities predicted here, and their growth rates, are the same as those predicted using a more traditional stability analysis for the Rayleigh–Bénard problem. Only allowing the initial perturbations to be to the velocity and monitoring the growth of the kinetic energy can lead to an underestimate in the growth by an order of magnitude. Similarly, using an inappropriate balance between the measure of the contribution from the kinetic energy and from the temperature can lead to exaggerated growth, or even apparent instability when none is really there.
The instabilities when a body of fluid is heated from below start to grow far sooner than one might expect based on an estimate of the instantaneous Rayleigh number and comparison with the Rayleigh–Bénard problem. The instabilities have a long wavelength when compared to the thickness of the buoyant thermal layer. The general behaviour of the instabilities changed continuously over a range of Prandtl numbers, and the large- and small-Prandtl-number asymptotics were identified. The decay rate for disturbances of this size is relatively small, and so there is little, if any, significant decay before instability starts. Over the range of Prandtl numbers, optimizing the initial time for start of instabilities had little or no effect.
When fluid is heated from a sidewall, it was found that there were two instability modes corresponding to large and small Prandtl numbers. For intermediate Prandtl numbers, such as that of water, both modes played a role. For lower growths in the amplitude of the instabilities in this intermediate range, the optimal instabilities were large-Prandtl-number modes. For larger growths, the initial development of the optimal instabilities was as a large-Prandtl-number mode, before undergoing a transition to the small-Prandtl-number mode. The large-Prandtl-number modes were centred around the region of maximum velocity of the buoyant upflow caused by the heating, while the small-Prandtl-number modes had a more complex structure. For both modes, the growth rate of the instabilities seems relatively constant even though the background state and the form of the instabilities were both evolving.
We have used the method for identifying the most unstable modes to look at the evolution of linear disturbances to semi-infinite bodies of fluid in the two cases of heating from below at a horizontal boundary and heating from a vertical boundary. We have identified these instabilities by finding the initial conditions that maximized the growth of a measure of the amplitude instabilities,
 $E(t)$
. For the bottom heating case the instabilities were stationary – they did not move along the wall. For the sidewall case the instabilities travelled upwards with the boundary layer flow. In other problems where the approach used here could be applied, the instabilities may possibly be oscillatory in their nature. For example, one could look at the standing oscillatory double-diffusive convection observed when a layer of fluid with a stable salinity gradient is heated from below (Baines & Gill Reference Baines and Gill1969), where the instabilities predicted could take the form of standing oscillatory instabilities or travelling waves of instability, or combination of the two. Although only one undetermined parameter was involved here in the measure of the amplitude of the disturbances, for double-diffusive convection, where there are contributions to the density from both temperature and salinity, a minimum of two parameters would be required, say, by adding a
 $\unicode[STIX]{x1D707}S^{2}$
term to the integral in (2.8), where
 $S$
is the salinity perturbation. However, the energy stability analysis of Kerr (Reference Kerr1990) required three parameters, the equivalent of adding
 $\unicode[STIX]{x1D707}(S-\unicode[STIX]{x1D6FE}T)^{2}$
to the integral. This may be required if the current method is applied to double-diffusive problems. In the regimes where instabilities are oscillatory, unless the instability is purely a travelling wave, then the contributions of the velocity, temperature and, in this case, salinity to
 $E(t)$
would have oscillatory components as the disturbance grew. For a standing instability, the kinetic energy could vanish regularly even though the instability as a whole would be growing. It would be expected that, with the appropriate choice of the measure of the amplitude, these oscillations would not prove problematic.
Although the approach taken here differs in its formulation and numerical method from the adjoint equation method (Luchini & Bottaro Reference Luchini and Bottaro2014), it is fundamentally equivalent. However, the adjoint partial differential equations for this problem are neither derived nor explicitly solved. For most of the problems looked at using the adjoint equations, there has been no temperature component, and just looking at the kinetic energy of the perturbations would be an appropriate measure of the amplitude of the disturbances, and the results previously obtained should be the same as any found using the current approach.
In the problems looked at here, the adjoint mapping
 $(\unicode[STIX]{x1D63C}^{-1}\unicode[STIX]{x1D648}^{\text{T}}\unicode[STIX]{x1D63C})$
depends on the parameter
 $\unicode[STIX]{x1D706}$
, through the matrices
 $\unicode[STIX]{x1D63C}^{-1}$
and
 $\unicode[STIX]{x1D63C}$
. The bulk of the calculations are spent finding
 $\unicode[STIX]{x1D648}$
, which is independent of the measure of the amplitude. So varying
 $\unicode[STIX]{x1D706}$
to optimize the growth for given
 $t_{0}$
and
 $t_{1}$
is a relatively quick step.
The choice of expressing the solutions as a simple vector (2.10) and the numerical approach used here for obtaining the matrices
 $\unicode[STIX]{x1D648}$
was primarily chosen for simplicity. It would also be possible to use other methods such as using functional expansions for the temperature and vorticity. These will alter the details of the various matrices involved, but not the overall method. The same approach for finding optimal solutions could be applied to these more advanced numerical methods.
Although optimizing for the start time for the instabilities,
 $t_{0}$
, was almost entirely unimportant for the heating of a semi-infinite body of fluid from below, it had a small effect when the boundary was vertical. For other problems where there may be a significant delay before the onset of instabilities, it could be important. As we have mentioned in the introduction, there are some convection problems where there was a significant period between the onset of heating and the observation of instabilities.
Acknowledgement
We would like to acknowledge the financial support provided to Z.G. by The School of Engineering and Mathematical Sciences, City University, London.
Appendix A
Here we present a simple model to help explain the variations of
 $E(t)=E_{K}(t)+\unicode[STIX]{x1D706}E_{T}(t)$
for the most unstable modes as
 $\unicode[STIX]{x1D706}$
is varied as seen in figure 5(a). We will consider a two-component analogue. Over a time interval from
 $t_{0}$
to
 $t_{1}$
an initial state
 $(1,a)$
grows by a factor of
 $G$
to
 $G(1,a)$
, while a second mode
 $(1,b)$
decays to zero. We also require that
 $ab<0$
. If we consider the first component of these vectors to correspond to the velocity and the second to the temperature, then the initial ‘energy’ of a general disturbance
 $A(1,a)+B(1,b)$
will be
 $$\begin{eqnarray}E_{0}={\textstyle \frac{1}{4}}[(A+B)^{2}+\unicode[STIX]{x1D706}(Aa+Bb)^{2}].\end{eqnarray}$$
The final energy will be
 $$\begin{eqnarray}E_{1}={\textstyle \frac{1}{4}}[G^{2}A^{2}(1+\unicode[STIX]{x1D706}a^{2})],\end{eqnarray}$$
and so the growth in the energy is
 $$\begin{eqnarray}\frac{E_{1}}{E_{0}}=\frac{G^{2}A^{2}(1+\unicode[STIX]{x1D706}a^{2})}{(A+B)^{2}+\unicode[STIX]{x1D706}(Aa+Bb)^{2}}=\frac{G^{2}(1+\unicode[STIX]{x1D706}a^{2})}{(R+1)^{2}+\unicode[STIX]{x1D706}(Rb+a)^{2}},\end{eqnarray}$$
where
 $R=B/A$
. For a given
 $\unicode[STIX]{x1D706}$
, we want to find the
 $R$
value that maximizes this growth. This occurs when
 $$\begin{eqnarray}R=-\frac{1+\unicode[STIX]{x1D706}ba}{1+\unicode[STIX]{x1D706}b^{2}},\end{eqnarray}$$
giving
 $$\begin{eqnarray}\frac{E_{1}}{E_{0}}=\frac{G^{2}(1+\unicode[STIX]{x1D706}a^{2})(1+\unicode[STIX]{x1D706}b^{2})}{\unicode[STIX]{x1D706}(b-a)^{2}}.\end{eqnarray}$$
For large
 $\unicode[STIX]{x1D706}$
we see that
 $E_{1}/E_{0}$
is approximately proportional to
 $\unicode[STIX]{x1D706}$
, while for small
 $\unicode[STIX]{x1D706}$
it is approximately proportional to
 $1/\unicode[STIX]{x1D706}$
. This is the behaviour seen in figure 5(a). The minimum of (A 5) occurs when
 $\unicode[STIX]{x1D706}^{2}a^{2}b^{2}=1$
. Since
 $ab<0$
this gives
 $\unicode[STIX]{x1D706}=-1/(ab)$
, and hence
 $E_{1}/E_{0}=G^{2}$
, the growth that would occur if we had only the mode
 $(1,a)$
present at the start. This is also the only initial condition that has the ratio of the first component to the second component the same at the start and finish.
Some of the above features, such as the minimum in the optimized growth, have clear parallels in the full problem. At the end of the time interval, the instabilities are essentially the most unstable exponentially growing modes, and as such the ratio of
 $E_{T}(t_{1})$
and
 $E_{K}(t_{1})$
is fixed (and so
 $\unicode[STIX]{x1D706}E_{T}(t_{1})/E_{K}(t_{1})$
is proportional to
 $\unicode[STIX]{x1D706}$
). At the start of the time interval,
 $t_{0}$
, for low values of
 $\unicode[STIX]{x1D706}$
, the temperature perturbation can be large and have little effect on
 $E(t_{0})$
, but once the motion starts, the buoyancy forces it generates can drive large velocities, which are picked up by
 $E_{K}(t)$
and so boost
 $E(t)$
. Similarly, when
 $\unicode[STIX]{x1D706}$
is large, then
 $E(t)$
is relatively insensitive to perturbations in the velocity, and large initial velocities can then generate large variations in the temperature, which will boost
 $E(t)$
.
There is one other limit in (A 5) that is of interest when we consider the heating at a vertical sidewall, and that is the case where
 $a$
is small,
 $b$
is of order one and
 $\unicode[STIX]{x1D706}$
is large, but with
 $\unicode[STIX]{x1D706}a^{2}$
small enough to be neglected. In this case
 $E_{1}/E_{0}\approx G^{2}$
, and is to a first approximation independent of
 $\unicode[STIX]{x1D706}$
, giving a flattened minimum. In the full problem this would correspond to the case where the fastest-growing mode was dominated by the vorticity and not by the temperature, as may be expected in a shear-driven instability.