Automated text analysis now is widely used in political science. For example, in order to identify the ideology of politicians and(or) parties, automated-scaling tools are applied to political speeches and manifestos (Laver, Benoit and Garry Reference Laver, Benoit and Garry2003; Slapin and Proksch Reference Slapin and Proksch2008). Machines are also employed to code news sources that describe relations between the Israelis and Palestinians, outbreaks of civil conflict, and repression (King and Lowe Reference King and Lowe2003; Schrodt and Van Brackle Reference Schrodt and Van Brackle2013). The potential for using machines to track such relations and events in real time is well recognized (Beieler et al. Reference Beieler, Brandt, Halterman, Schrodt and Simpson2016).
Grimmer and Stewart (Reference Grimmer and Stewart2013) propose four principles for the use of machine-coded text. The fourth is “validate, validate, validate.” There are two kinds of validation: internal and external. The former is the demonstration that machines and human coders extract the same information from the same text (Grimmer and Stewart Reference Grimmer and Stewart2013, 279). The latter is the demonstration that the information extracted from the text by the machine and human coders corresponds to ground truth or to what actually happened at some location at a particular time. Internal validation alone is a pyrrhic victory if the text on which it is based is itself inaccurate and(or) incomplete. Comparative politics and international relations scholars use machine coding under the rubric of “event data.” However, the news sources that are used for (machine or human)-coding event data often do not record every military exchange with insurgents or human rights violation. This undermines the external validity of event data.
Our validation efforts focus on the prevalence and severity of underreporting bias in externally validating event data. This problem is caused by, among other things, reporters’ tendencies to imperfectly detect events that occur in remote areas (Weidmann, Reference Weidmann2015). Cook et al. (Reference Cook, Blas, Carroll and Sinha2017) propose a multi-source maximum likelihood estimator to address this problem, and to gauge its seriousness in human-coded data. We evaluate Cook et al.’s estimator via Monte Carlo experiments, and then use their estimator to compare the prevalence and seriousness of underreporting when comparable texts are machine coded and recorded in the World-Integrated Crisis Early Warning System (ICEWS) dataset. Here, we replicate Cook’s investigation of state repression and, using Fariss’s (Reference Fariss2014) Latent Rights Protection Scores, compare the external validity of the machine and human-coded data. We also use the Cook et al.’s estimator to gauge the seriousness and prevalence of underreporting in machine and human-coded textual data on human rights violations in Colombia. The external validity of the Colombian machine and human-coded data is assessed against records of human rights violations reported by the Centro de Investigación y Educación Popular (CINEP). Notably, in both applications, we find that the machine-coded data are as valid as the human-coded data.
COOK ET AL.’S TWO SOURCE MISCLASSIFICATION MODEL
Cook et al. (Reference Cook, Blas, Carroll and Sinha2017) introduce a binary response model that accounts for under-misclassification in one’s binary dependent variable, which is the precise situation that we expect to arise within human- and machine-coded event data due to news media reporting bias issues. The authors motivate their multi-source model with the standard binary response model:
 $${\rm Pr}({\bf Y}_{{{\bf True}}} \,{\equals}\,1{\!}{\!}\mid{\!}{\bf X})\,{\equals}\,F(\beta _{0}^{{True}} {\plus}\beta _{1}^{{True}} {\bf X}),$$
where Y True is a binary dependent variable that equals 1 if an event occurs, X a vector of covariates, and F(⋅) the probit cumulative distribution function (CDF). In cases where some events (Y T =1) are misclassified as nonevents (Y T =0), misclassification occurs in one’s binary outcome variable. When misclassification is non-differential, Cook et al. (Reference Cook, Blas, Carroll and Sinha2017) define the probability of accurate classification as:
 $$\matrix{ {{\rm Pr}({\bf Y}\,{\equals}\,1{\!}{\!}\mid{\!}{\bf Y}_{{\bf T}} \,{\equals}\,1,{\bf X})\,{\equals}\,{\rm Pr}({\bf Y}\,{\equals}\,1{\!}{\!}\mid{\!}{\bf Y}_{{\bf T}} \,{\equals}\,1)\,{\equals}\,\pi _{1} ,} \hfill \cr {{\rm Pr}({\bf Y}\,{\equals}\,0{\!}\mid{\!}{\!}{\bf Y}_{{\bf T}} \,{\equals}\,0,{\bf X})\,{\equals}\,{\rm Pr}({\bf Y}\,{\equals}\,0{\!}\mid{\!}{\bf Y}_{{\bf T}} \,{\equals}\,0)\,{\equals}\,\pi _{0} .} \hfill \cr } $$
When either π 0 or π 1 is not 0, this implies that the proper binary response model for Pr(Y=1|X) is not the standard model in Equation 1, but rather:
 $${\rm Pr}({\bf Y}\,{\equals}\,1{\!}\mid{\!}{\bf X})\,{\equals}\,(1{\minus}\pi _{0} ){\plus}(\pi _{1} {\plus}\pi _{0} {\minus}1)F(\beta _{0} {\plus}\beta _{1} {\bf X}),$$
where π 0 corresponds to the probability of a zero-case being classified correctly, and π 1 corresponds to the probability of a one-case being classified correctly. Cook et al. (Reference Cook, Blas, Carroll and Sinha2017) introduce a multi-source component into the probability expression in Equation 3 by assuming that a given binary outcome variable Y T has two sources (e.g., news sources) that each imperfectly report on the occurrence or nonoccurrence of a series of events. Defining these two source-specific reports as Y 1 and Y 2 , source-specific predictors of (mis)classification (Z 1 and Z 2 ) can then be included via a set of probit CDFs, α 1(⋅) and α 2(⋅) for each source. This leads Cook et al. to define the following source-specific misclassification probability statements:
 $$\matrix{ {\alpha _{1} \,({\bf X},\,{\bf Z}_{{\bf 1}} )\,{\equals}\,{\rm Pr}\,({\bf Y}_{{\bf 1}} \,{\equals}\,0{\!}\mid{\!}{\bf Y}_{{\bf T}} \,{\equals}\,1,{\bf X},\,{\bf Z}_{{\bf 1}} ),} \hfill \cr {\alpha _{2} \,({\bf X},\,{\bf Z}_{{\bf 2}} )\,{\equals}\,{\rm Pr}\,({\bf Y}_{{\bf 2}} \,{\equals}\,0{\!}\mid{\!}{\bf Y}_{{\bf T}} \,{\equals}\,1,{\bf X},\,{\bf Z}_{{\bf 2}} ).} \hfill \cr } $$
If one assumes only under-misclassification—that is, that some “1s” are misclassified as “0s,” but not the reverse—π 0 can be restricted to one in Equation 3, which, after substituting the two source-specific misclassification probabilities in Equation 4 for π 1, yields the joint probability statement for Cook et al.’s two source under-misclassification model:
 $$\matrix{ {{\rm Pr}({\bf Y}_{{\bf 1}} \,{\equals}\,0,{\bf Y}_{{\bf 2}} \,{\equals}\,0{\!}\mid{\!}{\bf X},{\bf Z}_{{\bf 1}} ,{\bf Z}_{{\bf 2}} )\,{\equals}\,[1{\minus}F({\bf X},\beta )]{\plus}\alpha _{1} ({\bf X},{\bf Z}_{{\bf 1}} )\alpha _{2} ({\bf X},{\bf Z}_{{\bf 2}} )F({\bf X},\beta );} \hfill \cr {{\rm Pr}({\bf Y}_{{\bf 1}} \,{\equals}\,0,{\bf Y}_{{\bf 2}} \,{\equals}\,1{\!}\mid{\!}{\bf X},{\bf Z}_{{\bf 1}} ,{\bf Z}_{{\bf 2}} )\,{\equals}\,\alpha _{1} ({\bf X},{\bf Z}_{{\bf 1}} )\left[ {1{\minus}\alpha _{2} ({\bf X},{\bf Z}_{{\bf 2}} )} \right]F({\bf X},\beta )\,;\,} \hfill \cr {{\rm Pr}({\bf Y}_{{\bf 1}} \,{\equals}\,1,{\bf Y}_{{\bf 2}} \,{\equals}\,0{\!}\mid{\!}{\bf X},{\bf Z}_{{\bf 1}} ,{\bf Z}_{{\bf 2}} )\,{\equals}\,\left[ {1{\minus}\alpha _{1} ({\bf X},{\bf Z}_{{\bf 1}} )} \right]\alpha _{2} ({\bf X},{\bf Z}_{{\bf 2}} )F({\bf X},\beta )\,;} \hfill \cr {{\rm Pr}({\bf Y}_{{\bf 1}} \,{\equals}\,1,{\bf Y}_{{\bf 2}} \,{\equals}\,1{\!}\mid{\!}{\bf X},{\bf Z}_{{\bf 1}} ,{\bf Z}_{{\bf 2}} )\,{\equals}\,\left[ {1{\minus}\alpha _{1} ({\bf X},{\bf Z}_{{\bf 1}} )} \right]\left[ {1{\minus}\alpha _{2} ({\bf X},{\bf Z}_{{\bf 2}} )} \right]F({\bf X},\beta )} \hfill \cr } $$
The corresponding likelihood function appears in the Supplemental Appendix.
Cook et al. (Reference Cook, Blas, Carroll and Sinha2017) demonstrate via Monte Carlo experiments that when moderate underreporting exists within two binary records (sources) of an event’s occurrence,Footnote 1 their estimator outperforms standard probit models and several alternative misclassification estimators. We conduct new Monte Carlo experiments in our Supplemental Appendix for two scenarios that often arise in event data analyses: (i) instances where both sources exhibit severe underreportingFootnote 2 and (ii) instances where one source exhibits severe underreporting and the other exhibits minimal underreporting.Footnote 3 We find that having one good source and one bad source is preferable to having two bad sources, but that either scenario is less preferable to having two moderately good sources. In each new experiment, we also find that Cook et al.’s model outperforms other binary models in bias and coverage. Thus, even with two bad sources, the Cook et al. estimator is still preferable to analyzing one’s binary (collapsed) data with simpler models. As such, the Cook et al. estimator is the most appropriate estimator for the validation exercises performed below.
APPLICATION 1: AFRICAN REPRESSION
Our first application revisits state repression in Africa. Here we replicate and extend Cook et al. (Reference Cook, Blas, Carroll and Sinha2017), who examine the prevalence of reporting bias for monthly instances of state repression across African countries (2012–2013). Cook et al. (Reference Cook, Blas, Carroll and Sinha2017) employ the Social Conflict Analysis Database (SCAD; Hendrix et al. Reference Hendrix, Salehyan, Hamner, Case, Linebarger, Stull and Williams2012). SCAD is a human-coded event data set that records a wide range of political and social conflict. It provides an ideal application of the misclassification methods developed by Cook et al. (Reference Cook, Blas, Carroll and Sinha2017) given its inclusion of an indicator variable recording whether (or not) each coded event was identified in (i) the Associated Press (AP) and (ii) Agence France-Presse (AFP). We replicate Cook et al.’s study of state repression in Africa, both with the authors’ human-coded SCAD data and with comparable machine-coded state repression events derived from the ICEWS dataset (Boschee et al., Reference Boschee, Lautenschlager, O’Brien, Shellman, Starz and Ward2016).
ICEWS is fully machine-coded. It uses ~300 electronic news sources to code relational events at a global scale for the years 1995-Present. Similar to SCAD, ICEWS includes an indicator variable for the newswire or news agency that was used in coding each event. This allows us to recover only those ICEWS “state repression” events for African countries that were coded from AFP and AP. We therefore are able to make controlled comparisons of human and machine-coded event data, for the same news sources, locations, time-frames, source/target-actors, and event types. After accounting for underreporting issues within our human- and machine-coded event data, these comparisons allow us to gauge the relative quality of modern human- and machine-coded event data for political repression in Africa. In the Supplemental Appendix we describe our Africa repression data, covariates, and aggregation decisions in extensive detail.
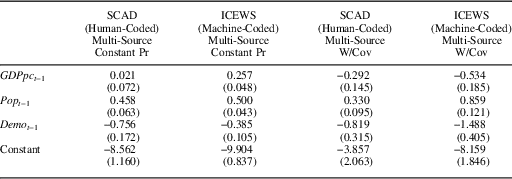
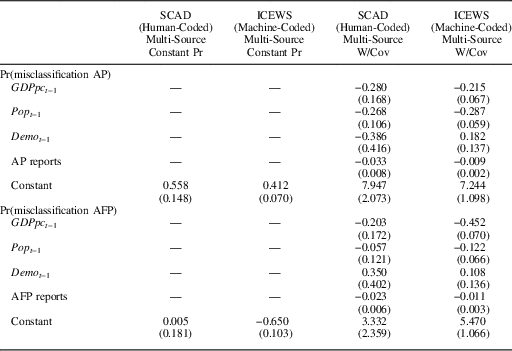
Turning to our model-based comparisons, we first replicate Cook et al.’s SCAD application using their proposed multi-source estimators. We then repeat this exercise using the machine-coded ICEWS data in place of SCAD. In each case, we follow Cook et al. (Reference Cook, Blas, Carroll and Sinha2017) by first estimating a set of multi-source constant specifications. These specifications include only a constant term within the misclassification stages of the Cook et al. multi-source estimator, and include the following covariates within the repression stage of the model: GDP per capita t−1, Population t−1, and Democracy t−1. Next, for each dependent variable (from SCAD and ICEWS), we estimate multi-source with covariates specifications that include GDP per capita t−1, Population t−1, and Democracy t−1 in all repression and misclassification equations of the Cook et al. multi-source estimators. We also add the source-specific covariates AFP reports and AP reportsFootnote 4 to the relevant misclassification equations. All estimates appear in Tables 1–2.
Models of Repression in Africa, 2012–2013

Note: N=1,092. Values in parentheses are standard errors.
SCAD=Social Conflict Analysis Database; ICEWS=World-Integrated Crisis Early Warning System.
Models of Reporting Bias in Africa, 2012–2013

Note: N=1,092. Values in parentheses are standard errors.
SCAD=Social Conflict Analysis Database; ICEWS=World-Integrated Crisis Early Warning System; AP=Associated Press; AFP=Agence France-Presse.
We find in Table 1 that the estimated effects of GDP per capita t−1, Population t−1, and Democracy t−1 on repression are remarkably similar for the human-coded SCAD and machine-coded ICEWS data. The most notable difference across our SCAD and ICEWS specifications is that GDP per capita t−1 is positive and not statistically significant in the SCAD multi-source constant specification, but positive and statistically significant (p<0.01) in the ICEWS multi-source constant specification. This implies that more developed African countries are more likely to exhibit monthly repression. However, in the SCAD and ICEWS multi-source with covariates specifications in Table 1, we find that GDP per capita t−1 is negative and statistically significant (p<0.01) in each case. This suggests that development is associated with less repression, thereby underscoring the value-added of Cook et al.’s multi-source with covariates model over its multi-source constant counterpart. This consistency in estimated effect—alongside those for Population t−1 and Democracy t−1—underscores the comparability of our repression-determinants across human- and machine-coded event data. In this regard, Table 1 demonstrates that using machine-coded event data in place of human-coded data for reporting bias-adjusted analyses of African repression yields comparable theoretical findings.
Table 2 offers additional evidence of the comparability of estimates derived from machine- and human-coded event data. This table reports the AP- and AFP-misclassification equation estimates for the models reported in Table 1. The most noticeable differences in our SCAD- and ICEWS-based estimates arise in the case of GDP per capita t−1. Looking specifically at the multi-source with covariates specifications, we find that more developed countries are significantly (p<0.10) less likely to exhibit reporting bias in the AP equation of the SCAD specification, but that GDP per capita t−1 is not statistically significant in the AFP equation of the SCAD specification. By comparison, GDP per capita t−1 is negative and statistically significant in both the AP and AFP equations of the ICEWS multi-source with covariates misclassification specification. The coefficient on Population t−1 is consistently negative across the SCAD and ICEWS misclassification equations, though it is not statistically significant in the SCAD AFP equation. Finally, in all cases, the coefficients on AP Reports and AFP Reports are negative and statistically significant (p<0.01) predictors of reporting bias. For a given African country-month, and no matter whether one examines human- or machine-coded event data, this implies that higher levels of media attention are associated with lower reporting bias for repression events.
Our analyses demonstrate that machine- and human-coded event data yield similar theoretical findings regarding the determinants of African repression. Yet these analyses do not reveal whether the predictions obtained from these models of African repression are comparable across our ICEWS and SCAD-based models. To evaluate this question, one needs gold standard records (GSRs) on African repression. In this case, we turn to the latent-country year measures of human rights protection estimated by Fariss (Reference Fariss2014). As Bagozzi and Berliner note, “[w]hile there is no perfect variable to capture objective ‘on-the-ground’ human rights conditions, the most advanced option at present is Fariss’s (Reference Fariss2014) dynamic latent human rights protection measure” (Reference Bagozzi and Berliner2017, 14). Fariss (Reference Fariss2014) uses a variety of standards-based human rights sourcesFootnote 5 and event-based repression data sourcesFootnote 6 within a dynamic item response theory model to recover a latent measure of repression that addresses data set-specific measurement concerns while accounting for changing standards of human rights accountability over time. This measure thus allows us to externally validate our models’ predictions of repression.
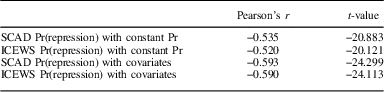
Specifically, we use the latent mean of countries’ human rights scores for our sample from Fariss (Reference Fariss2014, Version 2.4). We derive the in-sample predicted probabilities of repression for each country-month in our Africa sample from our estimated misclassification-adjusted (SCAD and ICEWS-based) repression-stage estimates, separately for the multi-source with covariates and multi-source constant specifications. As Fariss’s latent human rights measure and our model-derived predicted probabilities are each continuous, we examine the Pearson correlations between our model predictions and Fariss’s latent measure, along with associated t-values. We expect negative correlations in these regards, because higher values on our predicted probabilities imply a higher likelihood of repression, whereas higher values on Fariss’s measure imply lower repression.
Our correlations appear in Table 3. Beginning with our multi-source constant specifications, we find that our SCAD- and ICEWS-based models exhibit strong, negative, and statistically significant correlations with Fariss’s measure. Moreover, each predicted probability exhibits a very similar correlation with Fariss’s latent human rights scores: −0.535 in the case of SCAD and −0.520 in the case of ICEWS. Thus, our human- and machine-coded repression data yield predictions that are nearly identical in their association with a set of plausible GSRs. Our findings for the multi-source with covariates case in Table 3 underscore these conclusions. In this case, the inclusion of source-specific misclassification predictors improves the (negative) correlations between our predicted probabilities of repression and Fariss’s latent human rights scores. Moreover, our human-coded SCAD- and machine-coded ICEWS-based predictions again yield near-identical correlations with these latent GSRs, of −0.593 (SCAD) and −0.590 (ICEWS).
Correlation With Latent Human Rights Protection Scores

Note: N=1,092.
SCAD=Social Conflict Analysis Database; ICEWS=World-Integrated Crisis Early Warning System.
APPLICATION 2: COLOMBIAN HUMAN RIGHTS VIOLATIONS
Our second application examines instances of rebel and paramilitary violence against civilians in Colombia during the years 2000–2009. This application is fully presented in the Supplemental Appendix and briefly summarized here. Unlike Application 1, our Colombia analysis allows us to examine reporting bias issues, and to validate machine- and human-coded event data, at fine-grained subnational levels. Subnational comparisons are likely to be of interest to future researchers, given the increasing shift toward subnational analyses of conflict processes among quantitative conflict scholars.
For the Colombia conflict (global) event data innovations provide us with two separate human- and machine-coded event data sets—the (machine-coded) ICEWS data described above and the (human-coded) Geo-Located Event Dataset (GED; Sundberg and Melander Reference Sundberg and Melander2013). Importantly, ICEWS and GED (i) contain variables delineating the news source(s) that each data set used to code a given event, and (ii) exhibit considerable overlap in the specific news sources that each event data set uses to code Colombian Human Rights Violation (HRV) events. This allows us to use the Cook et al. multi-source estimators to make subnational comparisons of human- and machine-coded event data for the Colombian conflict. In this case we (dis)aggregate the ICEWS and GED data at the Colombian municipality-year level, separately for events derived the following newswire sources: Reuters and Agencia EFE. We describe our event data, covariates, and aggregations in the Supplemental Appendix.
Our analysis evaluates several municipality-level covariates as predictors of our GED and ICEWS HRV variables. We estimate a standard probit estimator as well as the Cook et al. multi-source constant and multi-source with covariates models. The results appear in the Supplemental Appendix. In each case, our GED and ICEWS estimates are generally consistent in sign and significance, although some HRV-stage estimates do change in sign and(or) significance when moving from the probit and multi-source constant models to the multi-source with covariates model. The results imply that (i) the Cook et al. estimator offers unique benefits and insights to modeling HRVs in Colombia and (ii) each estimated model yields substantively comparable estimates and conclusions about HRVs.
We validate these results against an external gold standard HRV source: Colombia’s CINEP (2008) data. Like our Colombia event data sets, CINEP’s HRV data contain comprehensive information on rebel and paramilitary-perpetrated violence against civilians in Colombia. Crucially, these CINEP data are unlikely to exhibit the reporting bias problems that are common in global (human- and machine-coded) event data sets. CINEP has been documenting the conflict in Colombia for over 40 years, and has created a curated archive with an extensive collection of (Spanish language) national and regional Colombian newspapers and associated reports. This collection includes victim testimony, non-governmental organization reports, and government sources. This ensures a gold standard validation source that is generally unavailable for country-specific conflict applications.
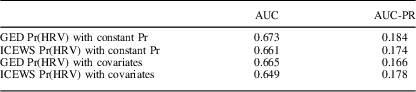
In the Supplemental Appendix, we extract the HRV predictions from our Colombia-specific models. We then compare these predictions to our binary CINEP records of municipality-year HRVs using areas under the receiver operating characteristic curve and areas under the precision-recall curve. The results appear in Table 4. Given the relative rarity of the events of interest, we favor the latter metric over the former (Ward and Beger Reference Ward and Beger2017). With regards to our assessments of external classification, we find that our ICEWS and GED models are highly similar in their abilities to classify CINEP HRVs, and in some cases are effectively identical. This suggests that, for analyses of subnational HRVs in Colombia, we obtain similar substantive conclusions and similar predictive accuracy with machine- and human-coded event data.
Classification of Centro de Investigación y Educación Popular HRVs

Note: N=9,451.
GED=Geo-Located Event Dataset; HRV=Human Rights Violations; ICEWS=World-Integrated Crisis Early Warning System; AUC=areas under the receiver operating characteristic curve; AUC-PRs=areas under the precision-recall curve.
CONCLUSION
This Note assesses the relative accuracy of machine- and human-coded event data. Machines hold considerable promise for the coding of political events from news reports, yet some scholars remain skeptical of the accuracy of machine-coded data. As we show, machine- and human-coded event data each yield comparable predictions and inferences across multiple geographic contexts and levels of aggregation. This is demonstrated using recently developed multi-source estimators that are designed to account for the specific underreporting biases present in event data. We further illustrate the robustness of these binary multi-source estimators with a series of Monte Carlo extensions of Cook et al. (Reference Cook, Blas, Carroll and Sinha2017). Our study thus provides one of the first comprehensive external validations of machine-coded event data, along with several insights into the usefulness of Cook et al.’s estimators for such purposes and for event data analyses more generally.