


Introduction
Pancake ice is commonly found in polar regions where waves are present. Reference Lange, Ackley, Wadhams, Dieckmann and EickenLange and others (1989) described their observation of this phenomenon in the Weddell Sea. P. Wadhams (personal communication, 1991) estimated the areal coverage of pancake ice in the Southern Ocean to be 6 × 10⁶km2. Pancake ice is also common in many marginal ice zones of the Northern Hemisphere, including the Odden ice tongue in the Greenland Sea, the Okhotsk Sea and the Bering Sea. Pancake ice forms through a combination of thermodynamic growth and mechanical thickening, caused by rafting of floes driven by wave motion. This complex growth process can thicken the ice cover more rapidly than pure thermodynamic growth, and hence may be the main factor responsible for ice-edge advance in marginal ice zones. Rafting produces an ice cover with a layered structure. Fieldwork carried out in the Okhotsk Sea reported rafted ice samples with two to seven layers, each 5−10 cm thick (Reference ToyotaToyota, 1998).
We believe that pancake ice forms in stages: a grease-ice stage, a pancake formation stage and a composite pancake stage (Shen and others, 2001). In the grease-ice stage, frazil crystals grow, float to the water surface and form a thin layer. In the pancake formation stage the increased buoyancy of the thickening accumulation exposes the surface to cold air. The surface freezes, forming an ice sheet. Wave bending cracks the ice sheet into pieces. Collisions between pieces shape them into circular pancakes with characteristic raised edges. In the composite pancake stage, differential drift herds and rafts the primary pancakes together to form composite pancakes. The tops of the composite pancake floes, exposed to cold air, freeze. The ultimate size of the composite floes depends on wave curvature.
Because of the stochastic nature of floe-floe interactions in a wave field, closed-form solutions quantifying the drifting and rafting processes cannot be obtained. Previous simulations of the dynamics of ice floes in a wave field began with the following one-dimensional equation for the motion of a circular ice floe:

where D is the floe diameter, h is the floe thickness, Pice is the ice density and Cm is the added mass effect due to the oscillatory motion of the floe. The forces on the floe are the buoyancy force  the gravity force
 the drag
 due to water underneath the floe, and a collisional contact force
 The forces on a pair of rafting floes are shown in Figure 1.
Diagram of the forces acting on floes 1 and 2 External forces are only shown on floe 1. Similar forces act on floe 2 also. The interaction force between floes 1 and 2 is from floe-floe collision.

This model without the floe interaction term was first introduced by Reference Rumer, Crissman and WakeRumer and others (1979) to study ice motion in the Great Lakes, North America. Reference Frankenstein, Shen, Chung, Karal, Triantafyllou and FrederkingFrankenstein and Shen (1993) included floe interactions and showed that floe collision rates increased rapidly with increasing amplitude. They also showed that drifting of floe agglomerates can be faster than single floes under the same wave conditions. Reference Shen, Squire and JeffriesShen and Squire (1998) further investigated the energy dissipation rate due to floe-floe collisions and compared it with other mechanisms that also attenuated wave energy. They concluded that floe-floe collisions were more important in dissipating wave energy than scattering and viscoelastic damping. In the multi-floe studies of Reference Frankenstein, Shen, Chung, Karal, Triantafyllou and FrederkingFrankenstein and Shen (1993) and Reference Shen, Squire and JeffriesShen and Squire (1998), only the × component of Equation (1) was investigated. They modeled a one-dimensional array of floes moving on the mean water surface driven by the gravity component parallel to the wave surface. The gravity component was balanced by water drag, while the buoyancy force was assumed to balance the gravity component normal to the wave surface. The floes did not rotate or raft.
In this paper we present a three-dimensional computer model of pancake ice in a plane wave field. Generalization to a more complicated wave field is straightforward. The model uses circular disk-shaped floes in a newly developed three-dimensional discrete element model (Reference Hopkins and TuhkuriHopkins and Tuhkuri, 1999). The floes are placed in a wave field subject to water drag, added mass, gravity and buoyancy forces. Buoyancy forces for each floe are calculated at each time-step from an integral over the floe surface that depends on the instantaneous depth and orientation of the floe, as well as the phase angle at the floe location. We present first the results of simulations in which the drift velocity of the ice floes is calculated as a function of wave amplitude with and without floe-floe collisions dynamics. Next we place a vertical barrier at the end of the simulation domain to represent land-fast ice without wave reflection. The drift velocity causes the floes to accumulate at the barrier. We calculate the thickness of the accumulation and the force on the barrier as functions of time and wave amplitude.
Description of the Computer Model
The computer model of pancake-ice/wave interaction is based on a newly developed three-dimensional discrete element model. A discrete element model is a computer program that explicitly models the dynamics of a system of discrete particles. In these simulations the particles are the individual ice floes. The position, orientation, velocity and shape of each floe are stored in arrays. At each time-step, the contact and body forces on each floe are calculated and the floes are moved to new locations with new velocities that depend on the resultant of the forces. The summary of the important details of the model presented here is from Reference Hopkins and TuhkuriHopkins and Tuhkuri (1999).
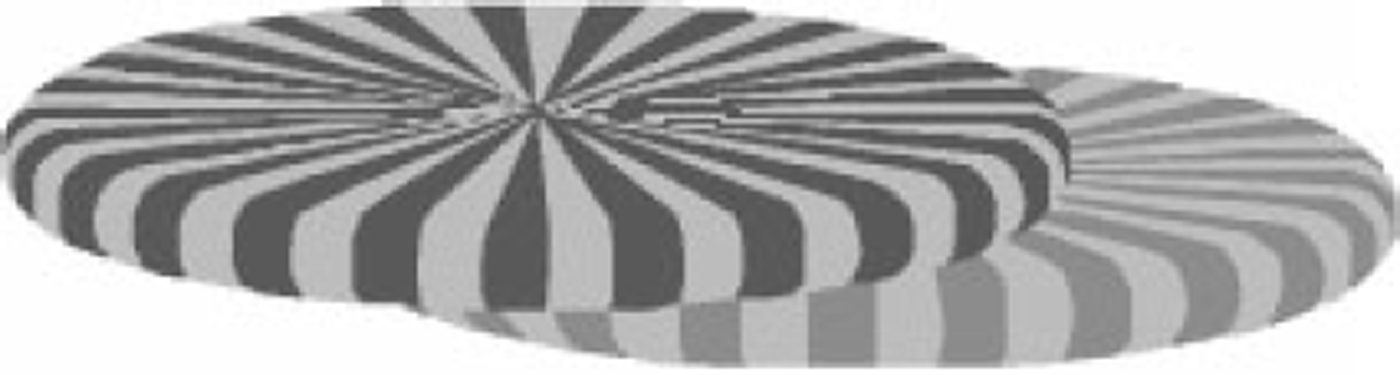
The ice floes in the simulations are flat disks with a circular edge as shown in Figure 2. The floes are formed by dilating a flat disk of radius R1 by a sphere with radius R2. In the dilation process in mathematical morphology (Reference SerraSerra, 1986) the two-dimensional circular disk is transformed into a three-dimensional disk with thickness h = 2R2 and diameter d = 2(R1 + R2) by placing a sphere with radius R2 at every point on the two-dimensional circular disk. The aspect ratio of the floe d/h can be varied by changing R1 and R2. The top and bottom surfaces of the floes are flat.
Contact between two floes, characteristic of floe rafting (Reference Hopkins and TuhkuriHopkins and Tuhkuri, 1999).
Contact detection, which is the crux of any discrete element code, is handled by a new iterative method. The two-dimensional circular disk of radius R1 at the core of each floe is called a constraint surface. The external surface of the floe is, at all points, a distance R2 from the constraint surface. When two disks are found to be in proximity (by standard grid methods), a vector is arbitrarily placed with its head on the constraint surface of one floe and its tail on the constraint surface of the other floe. This vector is modeled as an elastic band whose ends are constrained to remain on the two constraint surfaces. Pulled by its elasticity, the head and tail of the vector move iteratively to locations on the constraint surfaces that define the shortest distance between the two floes. If the length of the vector is <2R2, then the floes are in contact. The vector, which is perpendicular to the external surfaces of the two floes, defines the normal to the contact surface.
Wherever two floes touch, the overlap is interpreted as a deformation of the floes resulting in a contact force. The contact force has components normal and tangential to the surfaces at the point of contact. The normal axis  is perpendicular to the surface of each floe. The tangential axis t is in the direction of the tangential component of the relative velocity at the point of contact. The normal component of the contact force is

where subscript n denotes the normal direction, superscript n denotes the current time-step, kne
is the normal contact stiffness, δ is the depth of overlap between the floes, km
is the normal contact viscosity, and  is the relative velocity of floe 1 with respect to floe 2 at the point of contact. Avalue of km
near critical damping is used to produce highly inelastic behavior. Tensile forces are not modeled. The incremental change in the tangential force due to friction is proportional to the relative tangential velocity. The tangential force at time n is

where Δt is the time-step and kte is the tangential contact stiffness that is set to 60% of kne. The magnitude of kte affects the rate at which the frictional force increases to the Coulomb limit μFn , where μ is the friction coefficient. If the tangential force Ft exceeds the Coulomb limit, the x, y and z components of Ft are scaled such that | Ft |= μFn. The torques on each floe are calculated from the forces and moment arms. The water drag force Fd on a floe is given by

where Cd is the drag coefficient,  is the water velocity, ρw
is the water density and A = π(R1 + R2) is the floe area. The drag force is separated into components normal and tangential to the flat surface of a floe. The drag coefficient Cd, used in the simulations, was 0.6 for flow normal to the flat surface and 0.06 for flow tangential to the flat surface.
The × and z components of the water velocity Uw and Vw at the floe positions are

where H is the wave amplitude, k = 2π/L is the wave-number and  Rotational drag Md on a floe is given by

The three components of the rotational drag are calculated in the body coordinate frame of the floe. The rotational drag coefficient cd, used in the simulations, was 0.6 for rotation about the × and y body axes (in the plane of the floe) and 0.06 for rotation about the z body axis (normal to the floe). Water drag was applied only to the underwater floes that were in an exposed position. No drag was applied to floes in the interior of a mass of floes. Added mass was included by multiplying the floe mass by 1 + cm in the equations of motion. The added mass coefficient in the simulations was 0.15. Hydrodynamic lift was not modeled.
The buoyant force and its moment on each floe was calculated by evaluating a numerical surface integral of the hydrostatic pressure on the floe. The hydrostatic pressure on a differential area element dP was given by

where is the outward normal to the differential element of area dA,η
is the water surface elevation and z is the elevation of the differential element. The equation for the water surface is

Because it is impractical to calculate the surface integral for each floe at each time-step, a look-up table was created. The components of the buoyancy force and moment were calculated for discrete values of four independent variables: the depth of the floe center below the actual water surface, the angle between the body z axis (floe normal) and the global z axis, the azimuthal angle formed by the projection of the the body z axis on the global xy-plane and the global × axis, and finally the inclination angle of the wave surface. The four variables were discretized, respectively, into 30,18, 36 and 10 intervals. A quadrivariate interpolation scheme was used to interpolate between discrete functional values. Five dependent variables are calculated: the × and z components of the buoyant force and the x, y and z components of the moment.
After the sum of the forces and torques exerted on each floe has been calculated, the equations of motion for each floe are solved and time-advanced. The translational equations of motion use simple central difference approximations. Changes in the angular velocities and orientation of the floes are much more complicated to calculate. We use a method developed by Reference Walton and BraunWalton and Braun (1993). Euler’s equations of motion for the time derivatives of the angular velocities in the principal body frame are solved using a predictor-corrector algorithm. Floe orientations are specified by four parameters called quaternions (Reference Evans and MuradEvans and Murad, 1977). The updated quaternions are found by solving central-difference equations for the time derivatives of the
In each simulation the change in the kinetic and potential energy of the floes, the energy dissipated by inelastic and frictional contacts and water drag, and the work done by the buoyant force are calculated at each time-step Inelastic and frictional dissipation are determined by computing the work performed by the normal and tangential components of each contact force. The energy balance is used to gauge numerical accuracy. In the simulations described below, the error in the energy balance was < 2%.
Results of the Simulations
Three sets of simulations were performed with the computer model described above. Each simulation began with a single layer of floes distributed uniformly over the water surface with an areal concentration of 50%. The waves moved in the longitudinal or × direction. In all simulations the lateral boundaries of the domain (y direction) were periodic. Periodic boundaries are routinely used in discrete element simulations to eliminate solid boundaries (see, e.g., Reference Hopkins and LougeHopkins and Louge, 1991). In the absence of solid boundaries, the floes on the right boundary interact with the periodic image of the floes on the left boundary and vice versa. The z axis was vertical. In the first and second sets of simulations, intended to determine drift velocities, the domain end boundaries (× direction) were also periodic, creating what amounts to an infinite domain. In the first set of simulations the floe-floe dynamics were turned off and the floes were allowed to drift freely with the waves. In the second set of simulations the floe-floe dynamics were turned on to determine the effect of floe-floe collisions and rafting on the ice-drift speed. In the third set of simulations, intended to examine rate of thickening of the ice accumulation in front of a barrier, a vertical barrier was placed at the end of the domain toward which the waves were propagating. The barrier was non-reflective. The parameters used in the simulations are listed in Table 1.
Parameters used in the simulations

In the first set of simulations the floe-floe collisional dynamics were turned off and the floes were allowed to drift freely with the waves. The duration of each simulation was 300 s. The drift velocity was calculated at regular time intervals by sorting the floes into bins depending on the current phase angle of the location of their centers. The wave length was divided into 100 bins. The × components of velocity of the floes in each bin were averaged. Figure 3a shows the difference between the average drift velocity and the water speed Uw at the surface (Equation (5a)) as a function of phase angle and wave amplitude. The sinusoidal line with no symbols attached shows the relative water surface (Equation (8)) non-dimensionalized by wave height. The results shown are from the end of the simulation, well after the drift velocity had equilibrated. The average drift velocities in ms"1 over the entire domain are also listed in the figure legend box.
Difference between average ice-drift velocity and water surface velocity as a function of phase angle and wave amplitude for the case without floe-floe collisional dynamics (a) and with floe collisions (b). the sinusoidal line shows the water surface position. wave propagation is from left to right. quaternions, expressed in terms of the quaternions themselves and the angular velocities.

The results in Figure 3a show that the largest difference between the water velocity and the floe velocity occurs in the wave trough at a phase angle of about 180°. As amplitude is reduced, ice-floe velocity approaches the water surface velocity.
In the second set of simulations the floe-floe collisional dynamics were turned on and the floes were allowed to collide freely while drifting with the waves. The duration of the simulation was also 300 s, and the drift velocity was calculated as a function of phase angle in the same way as described above. Figure 3b shows the difference between the average drift velocity and the water speed at the surface as a function of phase angle and wave amplitude.
As in the case without floe collisions, the results show that the largest difference between the water velocity and the floe velocity occurs in the trough of the wave at a phase angle of about 180°. As wave amplitude is reduced, ice-floe velocity approaches the water surface velocity. Simulations by Reference Frankenstein, Shen, Chung, Karal, Triantafyllou and FrederkingFrankenstein and Shen (1993) showed much larger drift velocities with collisions than without. The large quantitative difference between the two studies is due to the one-dimensional floe dynamics and simplified treatment of the buoyancy and gravity forces used in Reference Frankenstein, Shen, Chung, Karal, Triantafyllou and FrederkingFrankenstein and Shen (1993). In that study, floes moved along a one-dimensional path at the mean water surface driven by a downslope component of gravity. Lateral motion and rafting were not modeled. In the current study, floes move three-dimensionally relative to the actual water surface (Equation (8)).
In the third set of simulations we studied the rafting process. A barrier was placed at the end of the domain in the direction of wave propagation to simulate land-fast ice. There was no wave reflection by the barrier. The net drift of the floes created an accumulation in front of the barrier. As the accumulation grew, additional floes were added at the other end of the domain at a concentration of 50%. Figure 4 shows four successive snapshots of the ice accumulation in front of the barrier at 2 s intervals. The wave period  was 8 s. The thinning and thickening of the ice accumulation shown in the four snapshots shows the alternate longitudinal compression and dilatation produced by the passage of each wave.
Successive snapshots of the ice accumulation in front of the barrier: H =3.5m, L = 100 m. the width of each figure is 62 m. the four- digit numbers show simulation time in seconds.

The series of snapshots in Figure 4 also shows the floe accumulation colliding with the barrier. As the floe accumulation thickens, the force on the barrier increases. The evolution of the force as a function of wave amplitude and time is shown in Figure 5. The rate of increase of the force as a function of wave amplitude is highly non-linear. The results for the case of H = 3 m showed nearly zero force and no thickening. We expect the force on the barrier and the ice thickness to reach equilibrium together. In an attempt to reach an equilibrium state of constant force and thickness in the simulation, we concentrated on the H = 3.5 m case, anticipating that it would have the smallest equilibrium thickness and thus require the least number of ice floes and the shortest computational time. As shown in Figure 5, the force for h = 3.5 m does indeed seem to have reached equilibrium after a long period of steady increase.
Evolution of the force on the barrier as a function of wave amplitude and time (L =100m).

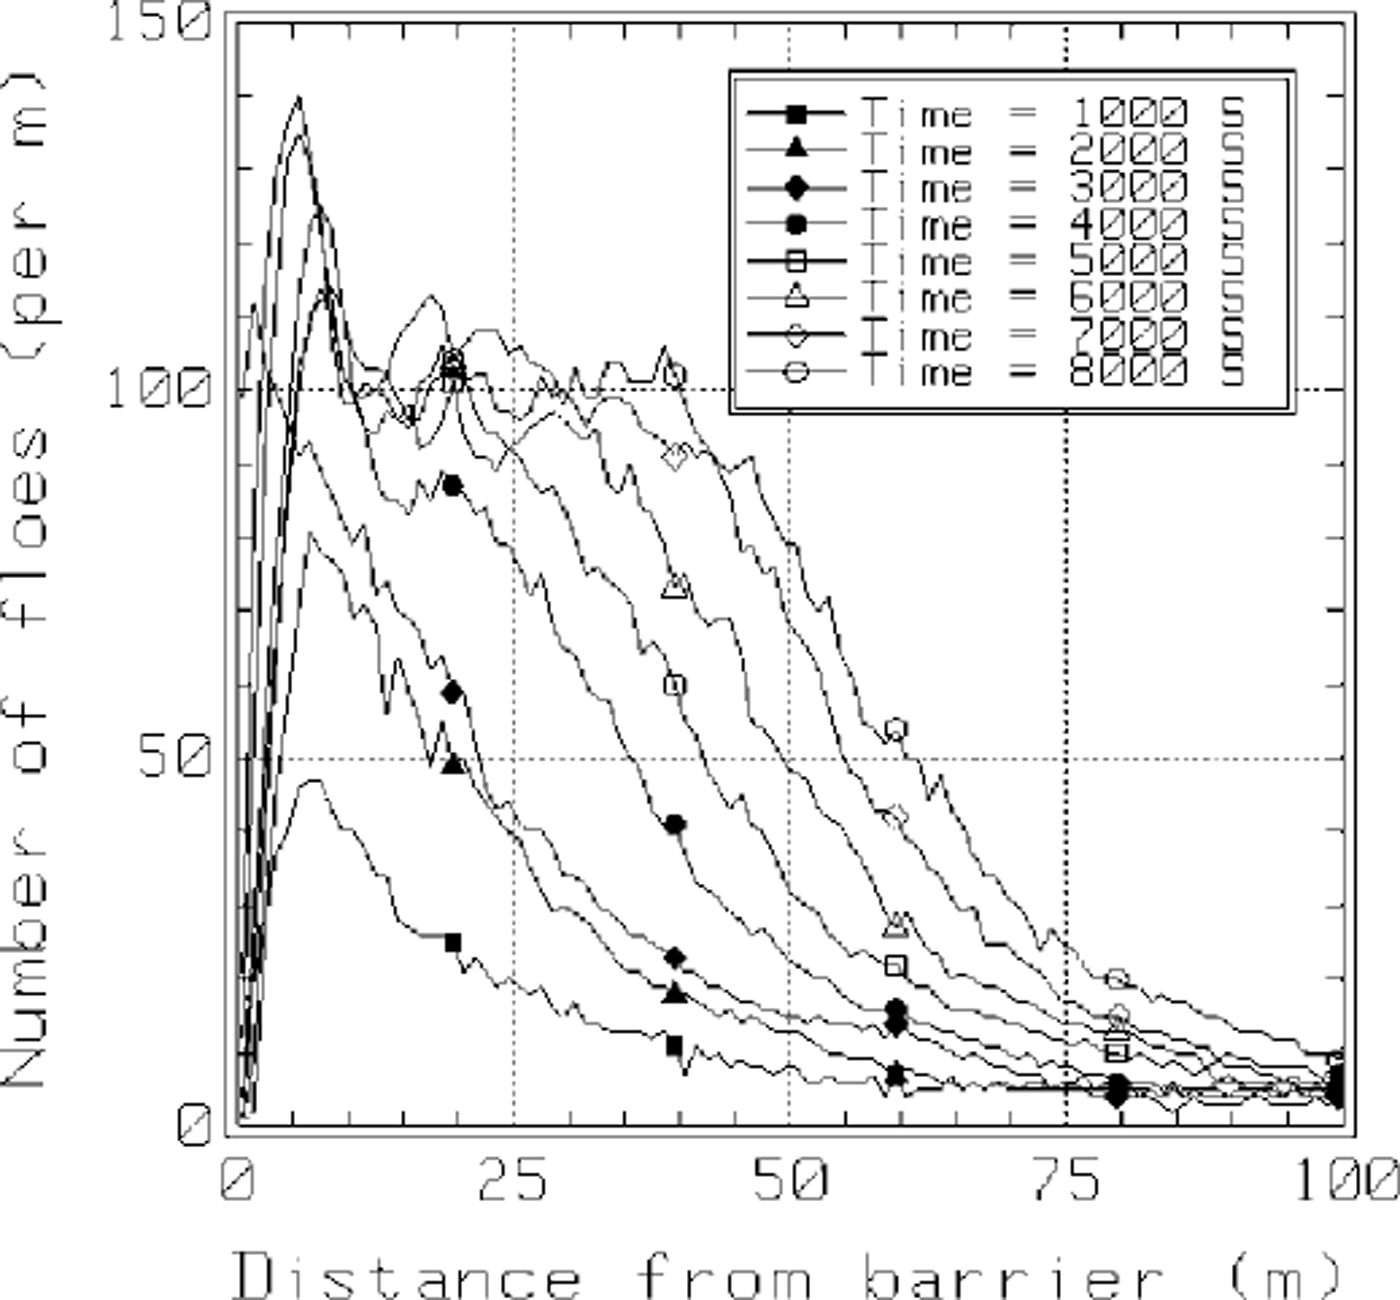
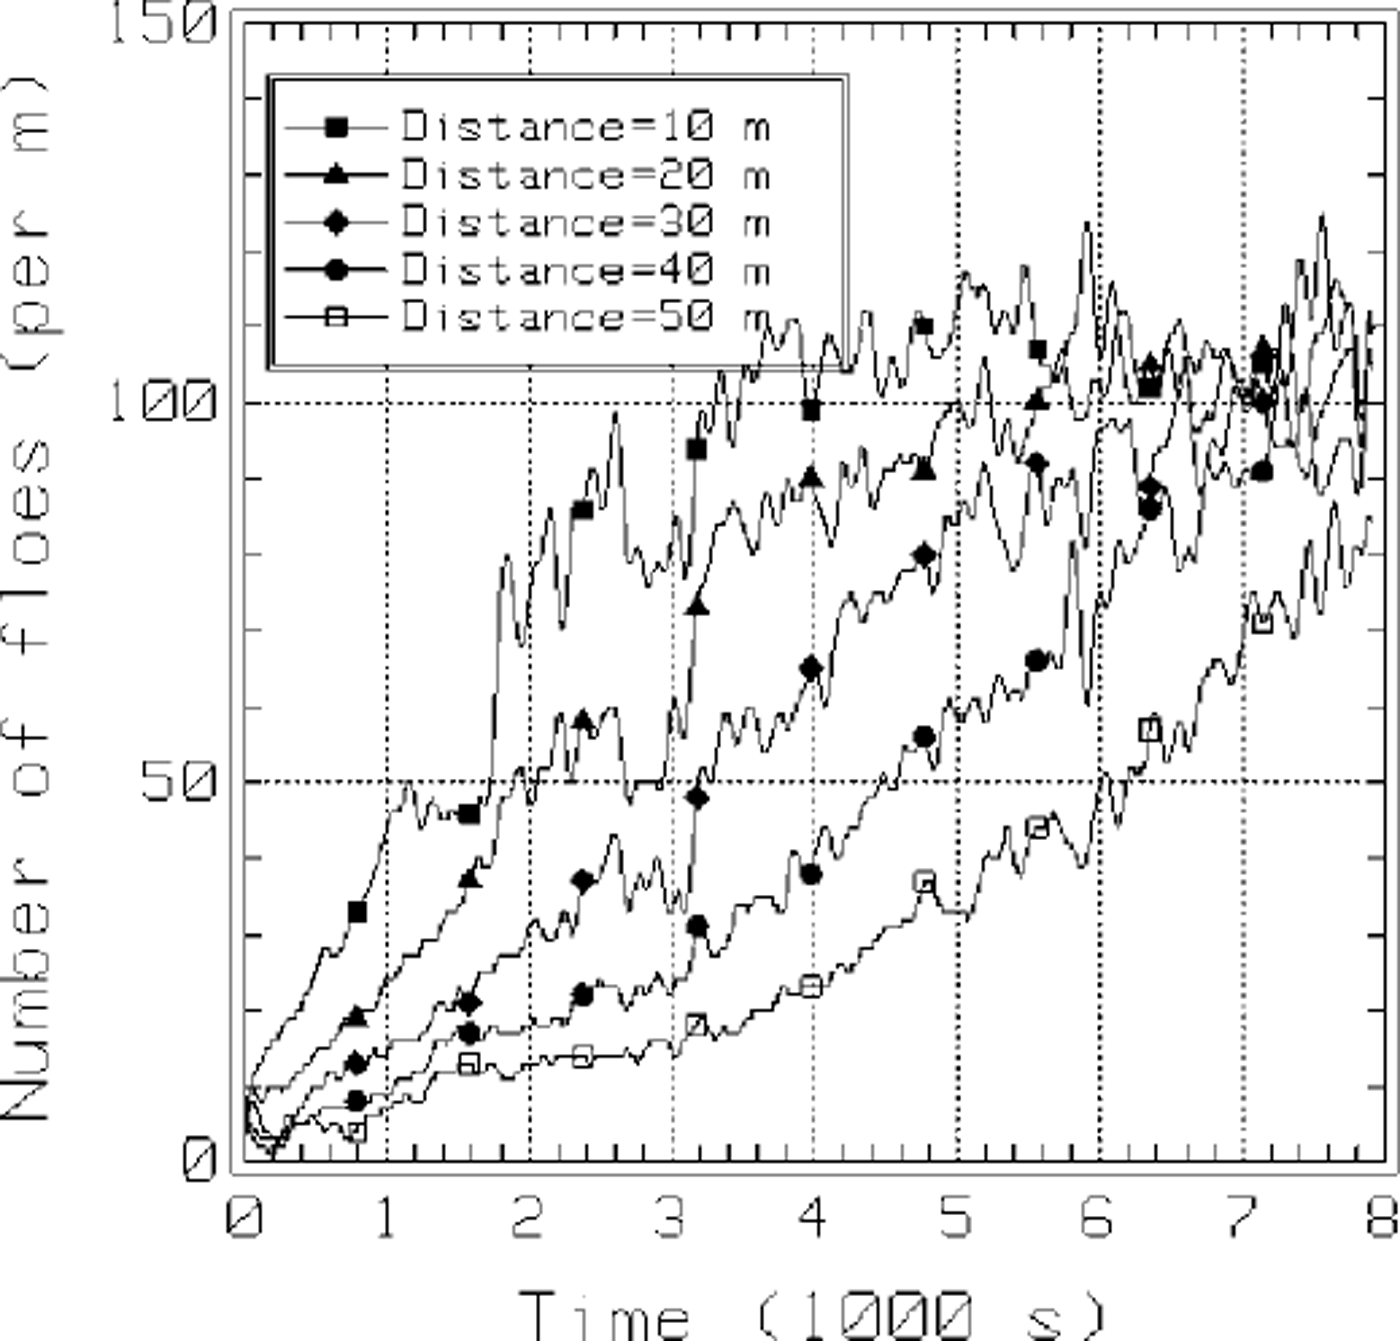
The growth of the ice accumulation in front of the structure is shown in Figures 6 and 7. The ice accumulation was defined by stopping the simulation at 8 s time intervals, dividing the domain into lm wide cross-sections spanning the 8.75 m width of the domain and counting the number of floe centers in each cross-section. In Figure 6 the results were smoothed by averaging the number densities in each cross-section over the 100 s time interval centered on the times shown in the figure. For example, the results plotted for time = 6000 s were averaged over the 12 realizations captured during the time interval 5950−6050 s. The results plotted in Figure 7 were smoothed by low-pass filtering with a cut-off frequency of 0.025 Hz. In both figures the thickness of the accumulation within about 30 m of the barrier appears to be reaching equilibrium. The accumulation thickness away from the barrier continues to increase. A number density of 100 floes per meter, shown in Figure 6, corresponds to a layer thickness of about 3.5 m at a porosity of 50%.
Build-up as a function of distance from the barrier at 1000 s intervals (H =3.5m,L= 100 m).
Build-up as a function of time for several positions denoted by distance from the barrier (H =3.5 m, L = 100m).
Conclusions
From the results of this study, we believe that this computer model is capable of simulating the rafting process central to the formation of pancake ice. Due to its three-dimensional nature and the realistic modeling of water-ice interaction and ice-ice interaction, it closely resembles the physical counterpart. We will use this simulation to determine the functional relation between the rafting thickness and the following parameters: wave amplitude, wavelength, floe diameter, floe thickness, floe-floe friction, Young’s modulus, and viscous coefficient. The thickness of the accumulation of rafted ice floe in front of the barrier is a function of the distance from the barrier. It appears that this thickness and the force exerted by the ice against the barrier approach a steady-state value.
In reality, as ice floes drift and raft they leave areas of open water in their wake in which new ice is produced. We thus need to add new ice floes in the computation domain at the rate that simulates the ice-floe production in the field. Freezing between rafted floes and unrafted neighboring floes contributes to lateral growth of floe size. Composite floes have been observed in the field. This freezing mechanism can be incorporated in the simulation as a tensile, cohesive force whenever there is floe-floe contact.
To better simulate physical conditions, we also need to consider a spectrum of waves instead of a monochromatic wave. This and the other mechanisms and processes mentioned above will be incorporated in future work.



