1 Introduction
A sonic jet in a supersonic cross-flow is one of the canonical flows often used for fundamental research on turbulent mixing and combustion that has applications to scramjet engine combustors. It maintains many flow features of interest, such as the three-dimensionality, shock structures, flow separation and recirculation, and wall-bounded free shear layer phenomenon. A significant body of work has been conducted, as summarized in the recent reviews by Karagozian (Reference Karagozian2010) and Mahesh (Reference Mahesh2013).
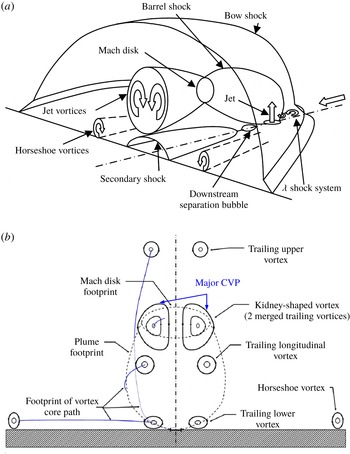
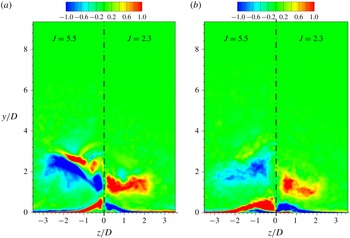
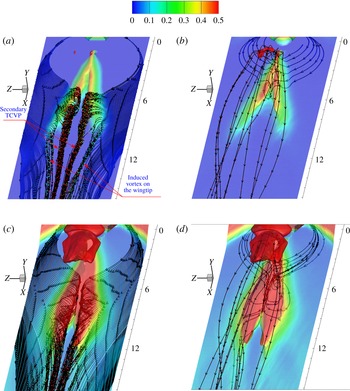
A typical flow topology of a transverse jet through an under-expanded sonic injection from a wall surface to a supersonic cross-flow is illustrated in figure 1(a,b) (Dickmann & Lu Reference Dickmann and Lu2009; Viti, Neel & Schetz Reference Viti, Neel and Schetz2009). The flow field involves complex three-dimensional (3D) unsteady shocks, contact surfaces, shear layer and their interactions. The jet forms a major counter-rotating vortex pair (CVP), whose axis is aligned with the streamwise direction and dominates the far-field mixing. A barrel shock around the plume terminating in a Mach disk and a bow shock is generated ahead of the jet. This causes boundary-layer separation upstream of injection and leads to the formation of a horseshoe vortex convecting around the jet. The most interesting part is about the wake structures in the leeward part of the jet. As shown in figure 1(a), a local leeward separation bubble and a secondary shock are presented. The well-known lower TCVP is shown in figure 1(b), which has been depicted in many publications.
Schematic diagrams of a transverse jet in supersonic cross-flow showing the dominant flow features. (a) The 3D view of near-field mean-flow structure (Dickmann & Lu Reference Dickmann and Lu2009). (b) Front view of the flow field aft of the barrel shock (Viti et al. Reference Viti, Neel and Schetz2009).

Many experimental investigations have been conducted to understand the mechanisms of a jet injected into a supersonic cross-flow, which include detailed velocity measurements (Santiago & Dutton Reference Santiago and Dutton1997), time-averaged wall-pressure measurements (Everett et al. Reference Everett, Woodmansee, Dutton and Morris1998), the jet penetration height (Portz & Segal Reference Portz and Segal2006) and temporally resolved flow visualizations (Gruber et al. Reference Gruber, Nejad, Chen and Dutton1997; Sun et al. Reference Sun, Zhang, Zhao, Zhao and Liang2013) and mixing characteristics (Ben-Yakar, Mungal & Hanson Reference Ben-Yakar, Mungal and Hanson2006; Gamba & Mungal Reference Gamba and Mungal2015) with non-reactive and combustible gaseous jets. These measurements showed the overall jet flow features and the dynamics of the jet shear layer and shock interactions with boundary layers. Because of the difficulty in measuring high-speed complex unsteady flow fields, experimental data are mostly limited to two-dimensional (2D) slices of the flow field for certain transverse and longitudinal planes.
Some numerical simulations have been conducted and the detailed flow field and behaviour of coherent structures have been investigated. Kawai & Lele (Reference Kawai and Lele2010) and Rana, Thornber & Drikakis (Reference Rana, Thornber and Drikakis2011) performed large-eddy simulations (LES) of a sonic jet in a supersonic cross-flow and their results demonstrated Kelvin–Helmholtz (KH) instabilities in the interface of jet shear layer confronted with the main stream. In their simulations, the jet near-field region is calculated with a jet-to-cross-flow momentum ratio of
 $J=1.7$
. Although the flow field in the boundary layer was demonstrated, no further details were discussed on the jet wake flow. Won et al. (Reference Won, Jeung, Parent and Choi2010) used detached-eddy simulation (DES) to reveal the vortex evolution under the jet conditions of Ben-Yakar et al.’s (Reference Ben-Yakar, Mungal and Hanson2006) experiment. Chai, Iyer & Mahesh (Reference Chai, Iyer and Mahesh2015) conducted LES on the flow field of a sonic jet in a supersonic cross-flow. In our previous work (Wang et al.
Reference Wang, Wang, Sun and Qin2013; Zhang, Liu & Sun Reference Zhang, Liu and Sun2016), hybrid Reynolds-averaged Navier–Stokes/large-eddy simulation (RANS/LES) methods were validated and used to study 3D jet mixing and the effect of a micro-ramp on jet mixing in a supersonic cross-flow. Recently, we conducted direct numerical simulations (DNS) to study the transverse jet in supersonic flows and focused on the upper trailing counter-rotating vortex pair (TCVP), which is located above the major CVP (Sun & Hu Reference Sun and Hu2018). The main conclusion was that the upper TCVPs are related to baroclinic effects caused by the deflecting Mach disk.
Combining experimental results with simulations, the shock structures and the jet vortices resulting from a sonic transverse jet injected into a supersonic cross-flow have been well identified. In addition, formation mechanisms of the major CVP and the horseshoe vortices have also been well explained. In the near-wall jet wake flow, a TCVP is the generally agreed flow feature. Rana et al. (Reference Rana, Thornber and Drikakis2011) discussed this TCVP and indicated that the TCVP is due to the low-pressure recirculation zone in the jet leeward and the suction action of the major CVP. The TCVP rotates in the opposite direction to major CVP and is dependent upon the free-stream Mach number. Kawai & Lele (Reference Kawai and Lele2010) inferred that the TCVP is the pair of boundary-layer separation vortices along the symmetry plane induced by the suction of the major CVP. Chai et al. (Reference Chai, Iyer and Mahesh2015) presented in-plane streamlines which reflected TCVPs but they did not give further discussion. Viti et al. (Reference Viti, Neel and Schetz2009) described the flow features in detail and deduced that the TCVP originates from the second counter-rotating vortex of the upstream separation region and is energized by the shear layer of the barrel shock.
From the above analysis, it is found that there is currently no widely accepted conclusion on the formation mechanism of surface TCVP. Though many researchers referred to suction of the major CVP and separation, no work has been done to mark the separation domain and identify the TCVP located in favourable or adverse flow. And a paradox largely exists in the description of the flow structures from different literature works. For example, in figure 1 the secondary shock is located downstream of the leeward separation and the possible separation bubble induced by the secondary shock is neglected. And it is still argued whether the TCVP originates from upstream separation (Viti et al.
Reference Viti, Neel and Schetz2009) or leeward separation (Rana et al.
Reference Rana, Thornber and Drikakis2011). Furthermore, the detailed evolution of the TCVP in the far field has not been investigated. Also it is important to know the near-wall jet wake to establish a clear physical understanding of the jet in supersonic cross-flow. Experiments have not been able to demonstrate this, while RANS or LES cannot capture detailed turbulence behaviour in the near-wall region. In the present work, DNS is conducted to investigate a sonic jet in a supersonic cross-flow at
 $Ma=2.7$
and to obtain the actual turbulence behind the jet near to the boundary layer. The significance of this investigation lies in the identification of separation topology and structures presented in supersonic boundary-layer flow which have not been fully investigated by previous studies.
This paper is organized as follows. The algorithm, flow conditions for the simulation, the computational grid, turbulent inflow generator and the validation of the numerical simulation are discussed in § 2. The instantaneous jet wake flow field is presented in § 3.1. The mean flow field of jet wakes, reattachment of the jet leeward separation and primary TCVP formation mechanism are presented in § 3.2. Then, § 3.3 gives 3D streamlines which exhibit different types of local flow patterns related to the near-wall jet wakes, and further presents the mechanism of the secondary TCVP. Finally a conclusion is given in § 4.
Air flow conditions for the simulations, including the dimensional boundary-layer (BL) thicknesses and Reynolds number at the air inflow.

2 Flow conditions and numerical set-up
2.1 Numerical simulation and inflow condition
Simulations were run within an in-house code to solve the 3D unsteady compressible Navier–Stokes equations. The code has both DNS and LES capability and has been applied to many studies of instability, transition and turbulence in supersonic flows (Sandham et al. Reference Sandham, Schlein, Wagner, Willems and Steelant2014; Sandham Reference Sandham2016) over the years. This paper only includes the main features of the code and explains the flow conditions. The detailed governing equations, including the continuity, momentum and total energy equations for 3D flow field, can be found in Sandham et al. (Reference Sandham, Schlein, Wagner, Willems and Steelant2014) and Sandham (Reference Sandham2016).
The air inflow parameters (shown in table 1) are set in accordance with the
 $Ma=2.7$
experiments of Sun et al. (Reference Sun, Zhang, Zhao, Zhao and Liang2013), with a stagnation pressure
 $P_{0}=101\,325$
Pa, and stagnation temperature
 $T_{0}=300$
K. The inflow 99 % boundary-layer thickness, which is the same for all simulations, is estimated to be
 $\unicode[STIX]{x1D6FF}_{i}=5.12~\text{mm}$
, with the compressible (including density variations) boundary-layer displacement and momentum thicknesses
 ${\unicode[STIX]{x1D6FF}_{i}}^{\ast }=1.75~\text{mm}$
and
 $\unicode[STIX]{x1D703}=0.38~\text{mm}$
and Reynolds numbers
 $\mathit{Re}_{\unicode[STIX]{x1D6FF}^{\ast }}=15\,367$
and
 $\mathit{Re}_{\unicode[STIX]{x1D703}}=3337$
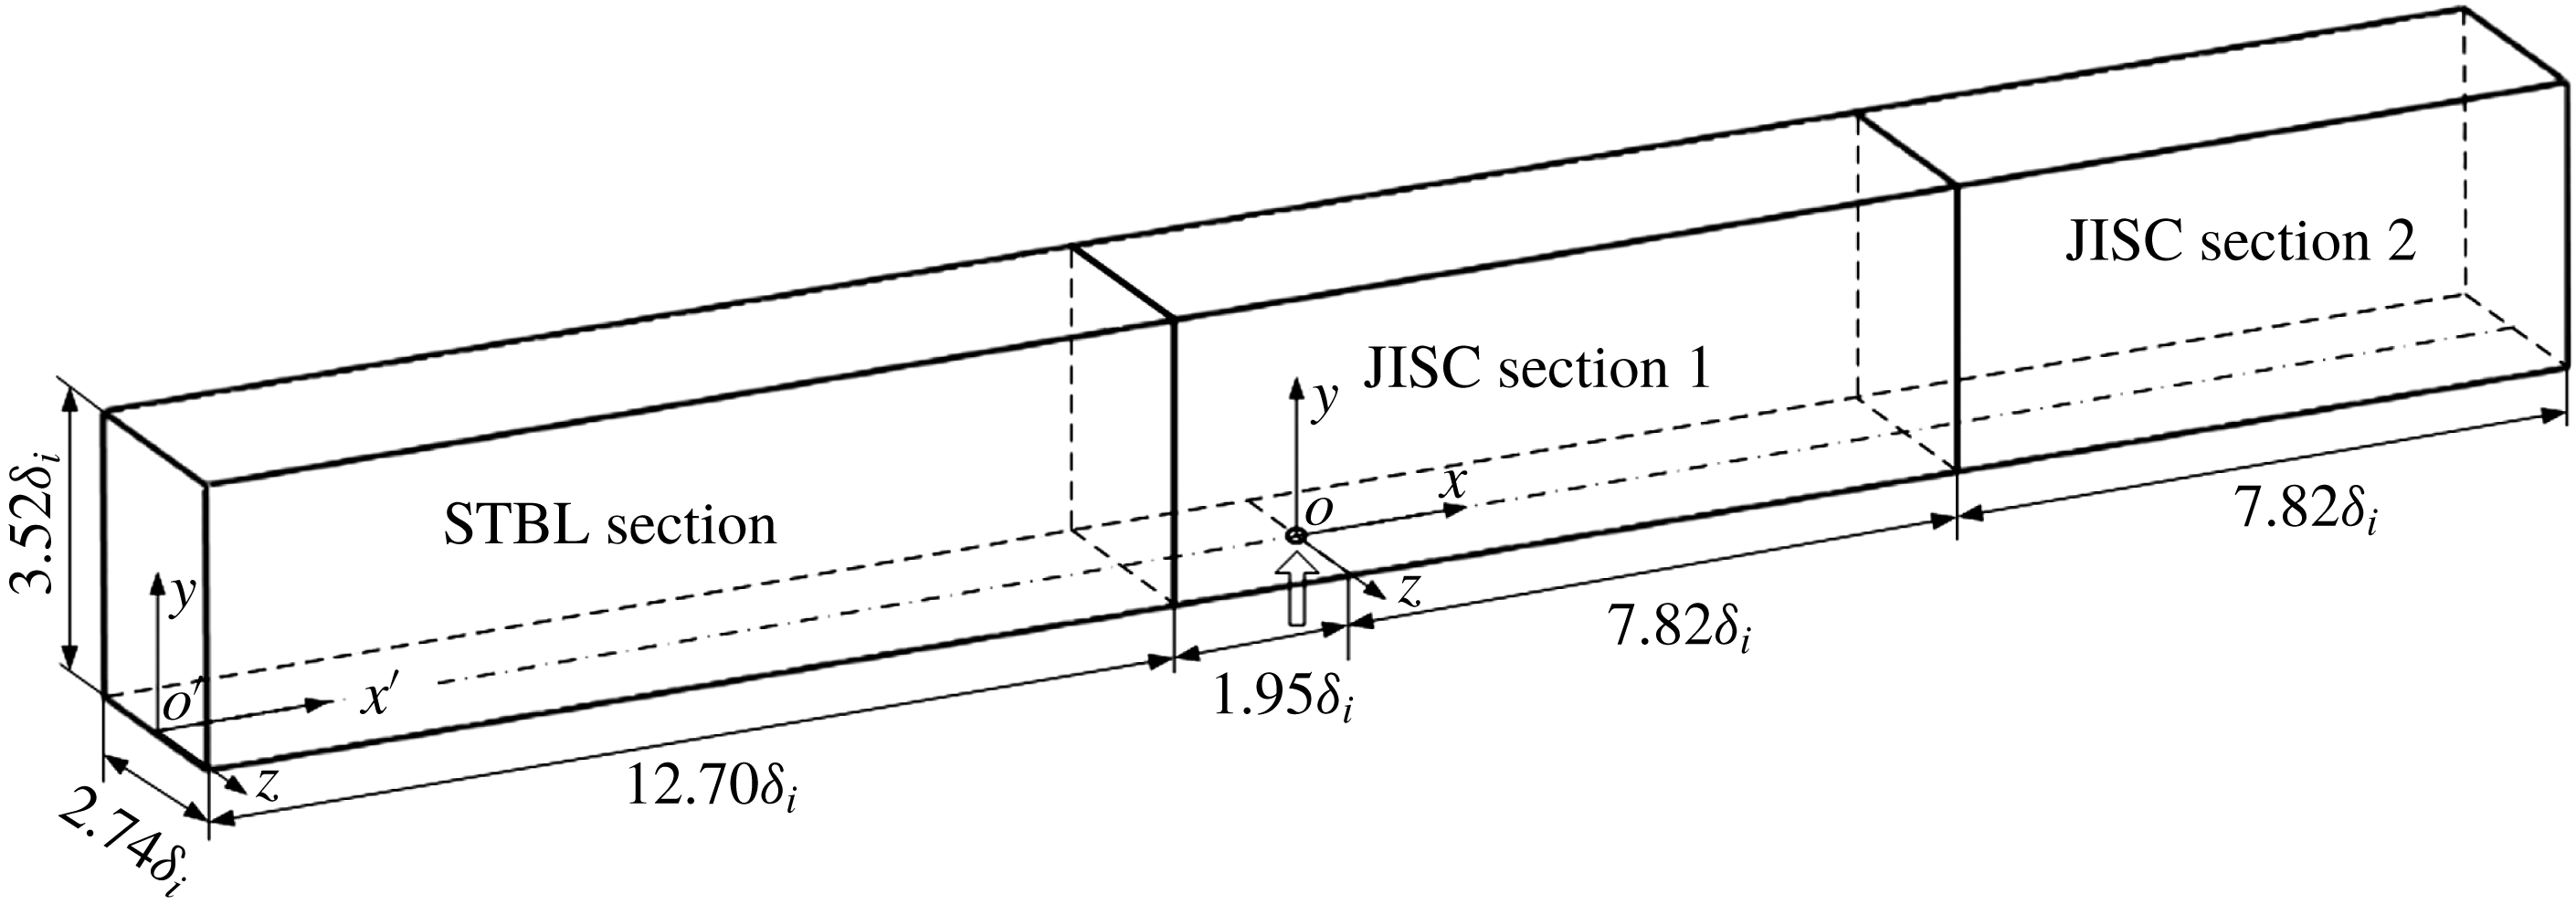
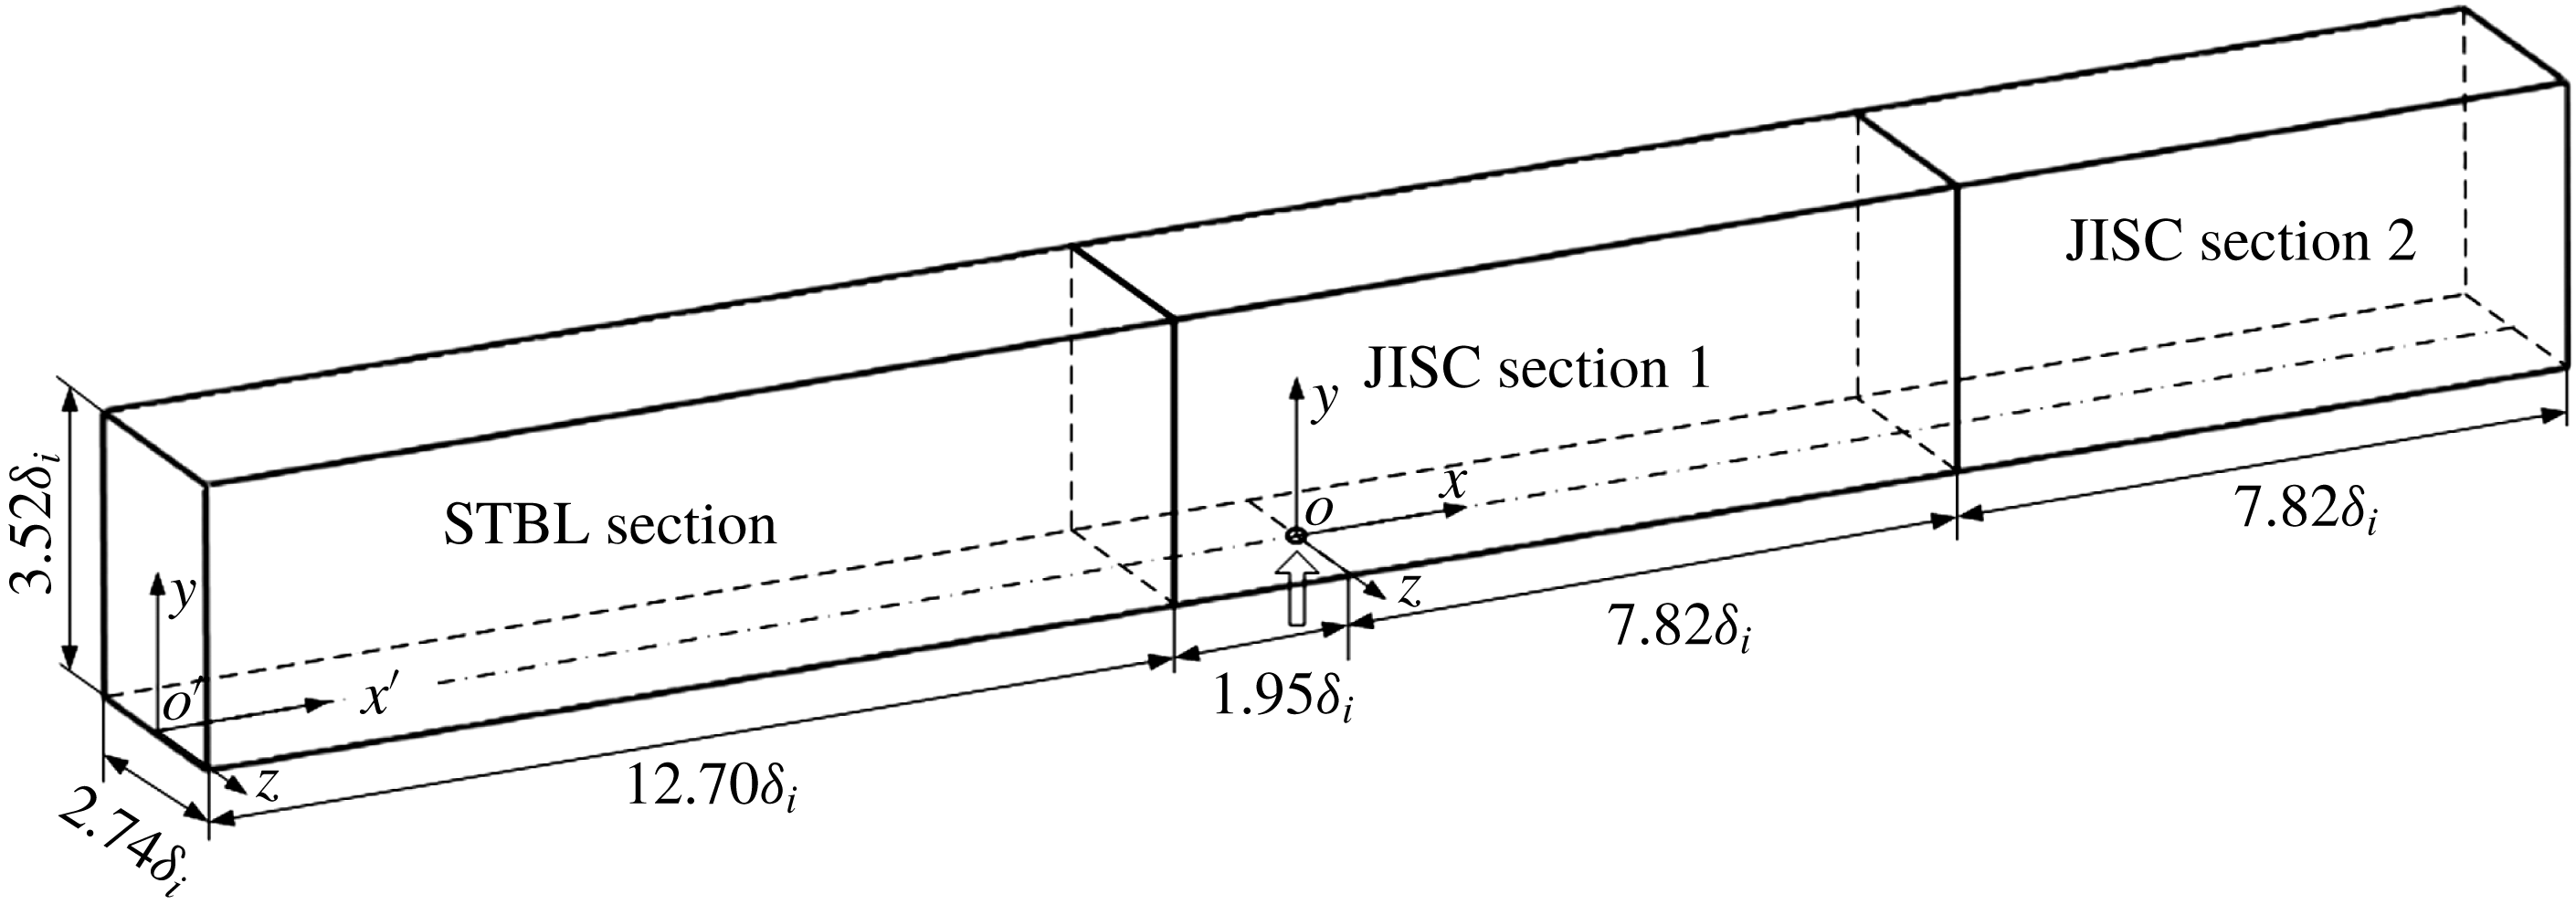
. A sketch of the computational domain is shown in figure 2.
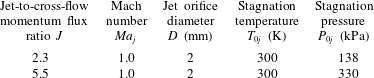
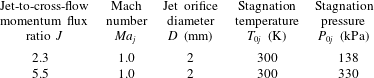
The injected air jet is modelled at two momentum flux ratios
 $J=2.3$
and
 $J=5.5$
. Both cases lead to a sonic jet with a stagnation temperature
 $T_{0i}=300$
K. The injection jet parameters are given in table 2. Since the turbulent levels originating from the jet orifice are not known, a uniform profile across the jet orifice is implemented with no disturbance. It might be argued that turbulence would not be thoroughly resolved in the jet; however, it is believed that the overall behaviour of coherent structures in the jet and boundary layer will not be affected by this assumption.
Schematic of the domain selected for the STBL and JISC simulations. The arrow indicates the jet centre, which is also the origin of the coordinate system.
Air jet conditions for the simulations.
2.2 Domain and grid distribution
To study a jet interacting with a turbulent boundary layer, the incoming flow needs to be fully developed before the jet injection point. Although the use of a digital filter at the inflow boundary significantly reduces the length required for boundary-layer development (Xie & Castro Reference Xie and Castro2008), there should nevertheless be enough distance to allow the boundary layer to adjust to equilibrium upstream of the jet. It was found that a distance of 12 times the inflow boundary-layer thickness is enough to obtain realistic turbulent mean and root-mean-square (r.m.s.) profiles from the digital filter inflow generator used. Accordingly, the initial length is set to be
 $L_{i}\approx 12.7\unicode[STIX]{x1D6FF}_{i}\approx 65~\text{mm}$
for fully developed turbulence generation (the region is denoted as supersonic turbulent boundary layer, STBL). The jet interaction length is given to be
 $L_{m}=90~\text{mm}$
, including the near field (denoted as jet interaction with a supersonic cross-flow, JISC section 1) with 10 mm upstream and 40 mm downstream of the jet and far field (denoted as JISC section 2) of 40 mm. Therefore, the total length of the physical domain is
 $L_{x}=155~\text{mm}$
. The wall-normal extension of the domain is 18 mm, and a span of 14 mm is used. The jet centre is 75 mm downstream of the inlet, with an orifice diameter of
 $D=2~\text{mm}$
. The same computation domain was used in our previous work (Sun & Hu Reference Sun and Hu2018), where more details can be found.
Figure 2 shows the geometry of the physical domain, which is 155 mm (
 $30.3\unicode[STIX]{x1D6FF}_{i}$
), 18 mm (
 $3.52\unicode[STIX]{x1D6FF}_{i}$
) and 14 mm (
 $2.74\unicode[STIX]{x1D6FF}_{i}$
) in the streamwise (
 $x$
), wall-normal (
 $y$
) and spanwise (
 $z$
) directions, respectively, for a Cartesian coordinate system with origin at the jet centre. A fine mesh of
 $2305\times 279\times 271$
grid points is used for the current simulations. The grid stretching scheme was described in our previous work (Sun & Hu Reference Sun and Hu2018) and for brevity the description is omitted. To capture the wall-bounded flow, the grids are clustered near the wall in the region
 $y=0$
to
 $0.6\unicode[STIX]{x1D6FF}_{i}$
uniformly and then stretched smoothly out. Table 3 summarizes the number of grid points and resolutions in wall units, which are calculated based on the friction velocity of the incoming turbulent boundary layer at
 $x=-15~\text{mm}$
. In wall-normal direction, the grid has
 ${y_{1}}^{+}=0.8$
for the first point off the wall,
 $\unicode[STIX]{x1D6E5}_{y}^{+}=5.2$
at the edge of the boundary layer and
 ${\unicode[STIX]{x1D6E5}_{y}^{+}}_{max}=10.0$
in the main stream. Since it is not known for the smallest turbulence scales in the jet field, the grid resolution of
 $\unicode[STIX]{x1D6E5}_{y}^{+}\leqslant 10$
would ensure the main-stream simulations as quasi-DNS (QDNS), as denoted by Sandham, Johnstone & Jacobs (Reference Sandham, Johnstone and Jacobs2017). The uniform grids in the STBL and JISC section 2 regions have
 $\unicode[STIX]{x1D6E5}_{x}^{+}=6.6$
, while the JISC section 1 region has a resolution of
 $\unicode[STIX]{x1D6E5}_{x}^{+}=4.1$
. In the spanwise direction, the grid is uniform with spacing fixed to
 $\unicode[STIX]{x1D6E5}_{z}^{+}=4.1$
. The fine mesh ensures good resolution of the near-wall turbulence.
Computation grids for mesh of JISC and STBL domain.

To minimize artificial reflections from boundaries, large buffer layers (not shown in figure 2) with non-reflective outside boundary set are introduced with lengths of 15 mm, 11 mm and 12 mm at the outlet, on both the sides and the upper boundaries. The grid is smoothly stretched in the buffer layers towards the boundaries. The buffer layers with coarsened mesh help to damp fluctuations and minimize reflection from the boundaries.
No-slip and adiabatic boundary conditions are enforced on the bottom wall (shown in figure 2). An integrated characteristic boundary condition is applied at the inflow, and an outflow condition with an integrated characteristic scheme (Thompson Reference Thompson1987; Sandhu & Sandham Reference Sandhu and Sandham1996) is applied in the spanwise boundary, top boundary and exit boundary, which are located on the edge of the buffer layer and largely decrease the numerical disturbances. The jet orifice is defined directly in the surface wall uniform grid and set to
 $J=2.3$
and
 $J=5.5$
with a sonic condition.
2.3 Numerical methods and validation
The governing equations are solved using a high-order finite-difference code (Sandham, Li & Yee Reference Sandham, Li and Yee2002). This code uses a fourth-order central difference scheme for the spatial derivatives and a third-order explicit Runge–Kutta scheme for time advancement. The code makes use of an entropy splitting of Euler terms and Laplacian formulation of the viscous terms to improve the stability of the non-dissipative central scheme. In addition, a variant of the standard total variation-diminishing scheme is used for shock capturing (Yee, Sandham & Djomehri Reference Yee, Sandham and Djomehri1999). To better resolve the steep gradient in flow field around the injected jet, we used a hybrid scheme which combines the entropy splitting central scheme with a weighted essentially non-oscillatory central-upwind WENO-CU4 scheme, which is developed following the procedure of the WENO-CU6 (Hu, Wang & Adams Reference Hu, Wang and Adams2010) and given in our recent work (Sun & Hu Reference Sun and Hu2018). The two schemes are combined using the Ducros sensor (Ducros et al. Reference Ducros, Ferrand, Nicoud, Weber, Darracq, Gacherieu and Poinsot1999) as the hybridizing function. This hybrid scheme was well described in the Sun & Hu (Reference Sun and Hu2018) and for brevity omitted here.
The digital filter inflow generation method of Xie & Castro (Reference Xie and Castro2008) is used to generate a more realistic supersonic turbulent boundary layer at the inflow. A detailed description of the optimized digital filter used here can be found in Touber (Reference Touber2010). The digital filter is robust to the choice of length scale, as long as the prescribed length scales are at least as large as the integral length scales of the real flow and sufficient downstream distance is provided to allow for the turbulence to develop (Wang et al. Reference Wang, Sandham, Hu and W2015b ; Sun & Hu Reference Sun and Hu2018). The mean inflow profile is generated using the same approach as Touber & Sandham (Reference Touber and Sandham2009). The inflow r.m.s. values are taken from the DNS results of Schlatter & Orlu (Reference Schlatter and Orlu2010) for a similar Reynolds number. A compressible scaling, as suggested by Morkovin (Reference Morkovin and Favre1962) and validated by Duan, Beekman & Martin (Reference Duan, Beekman and Martin2011) for high Mach numbers, is used to transform the incompressible r.m.s. values.
Statistical data are based on averaging flow fields over 100 non-dimensional time units (
 $D/U_{\infty }$
) after running the simulations for 200 non-dimensional units to let the flow develop. The boundary-layer thickness at the beginning the JISC section 1 (at
 $x=-10~\text{mm}$
) ahead of the injection is calculated to be
 $\unicode[STIX]{x1D6FF}_{99}\approx 5.64~\text{mm}$
based on a developed boundary layer without a jet, and the corresponding friction Reynolds number is estimated to be
 $Re_{\unicode[STIX]{x1D70F}}\approx 8737$
. Injection in the
 $J=2.3$
case has little influence on the boundary-layer flow at
 $x=-10~\text{mm}$
ahead of the jet. Thus turbulent boundary-layer mean profiles and distributions of r.m.s. values at
 $x=-15~\text{mm}$
, which has not been affected, are first evaluated. Here the coordinate origin is at the jet centre and this position corresponds to
 $x/D=-7.5$
. The calculated compressible boundary-layer displacement and momentum thicknesses at
 $x/D=-7.5$
are
 ${\unicode[STIX]{x1D6FF}_{0}}^{\ast }=2.12~\text{mm}$
and
 $\unicode[STIX]{x1D703}_{0}=0.41~\text{mm}$
, respectively. It should be noted that the Reynolds number based on the free-stream flow properties and the momentum thickness, i.e.
 $Re_{\unicode[STIX]{x1D703}}=\unicode[STIX]{x1D70C}_{e}U_{e}\unicode[STIX]{x1D703}/\unicode[STIX]{x1D707}_{w}$
, is 3600. The corresponding Reynolds number under the van Driest scaling, i.e.
 $Re_{\unicode[STIX]{x1D703},vd}=\unicode[STIX]{x1D70C}_{w}U_{e}^{vd}\unicode[STIX]{x1D703}^{vd}/\unicode[STIX]{x1D707}_{w}$
, is 917. The subscripts ‘
 $e$
’ and ‘
 $w$
’ above denote the main flow and wall parameters, respectively, while the superscript ‘
 $vd$
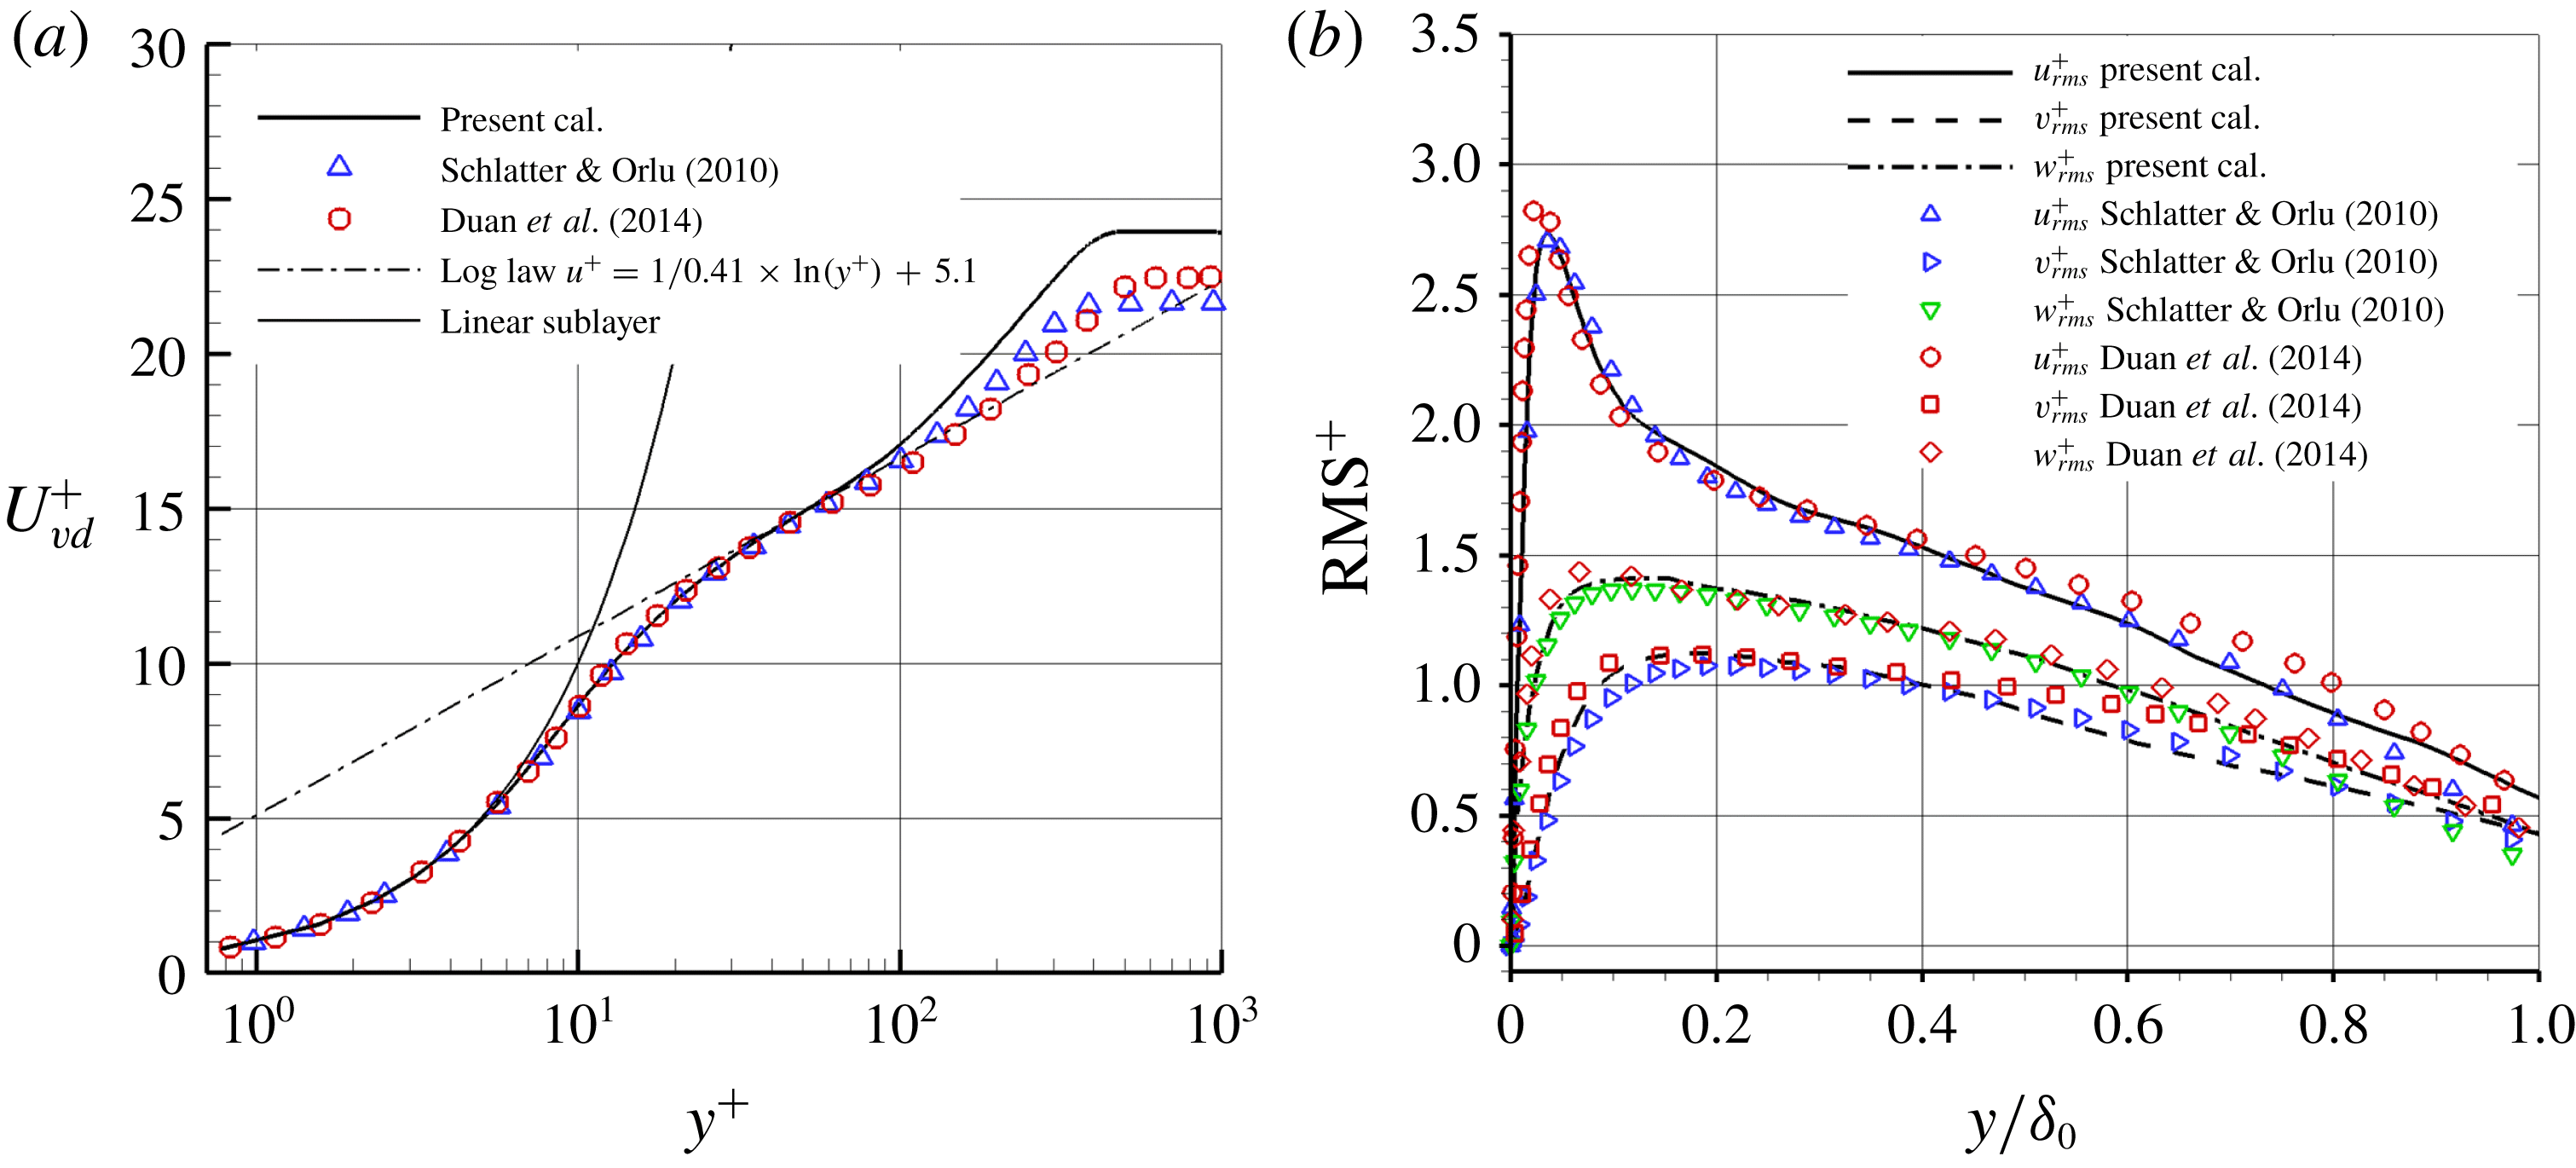
’ means the value under the van Driest transform. Figure 3 shows the mean and r.m.s. values collapsing very well with the DNS results of Schlatter & Orlu (Reference Schlatter and Orlu2010) with Reynolds number of 1000, as also found in the recent study by Sun & Hu (Reference Sun and Hu2018). DNS data of a supersonic boundary layer from Duan, Choudhar & Wu (Reference Duan, Choudhar and Wu2014) are compared in figure 3 and it is found that the current calculation also agrees well with the compressible velocity profile and the Reynolds-stress data with
 $Ma_{\infty }=2.5$
and
 $Re_{\unicode[STIX]{x1D703}}=2835$
.
Mean (a) and r.m.s. (b) velocity distributions obtained at 60 mm downstream of the inlet. The van Driest transformation was applied to the mean velocity and a Morkovin scaling
 $\unicode[STIX]{x1D709}=\sqrt{\unicode[STIX]{x1D70C}/\unicode[STIX]{x1D70C}_{w}}$
to the r.m.s. curves.


In the previous study (Sun et al. Reference Sun, Zhang, Zhao, Zhao and Liang2013), the jet penetration height correlation was obtained from the statistics of nanoparticle-based planar laser scattering (NPLS) experimental images by using an upper edge approximation definition,
 $$\begin{eqnarray}\frac{y}{DJ}=\frac{2.933}{J^{0.5830}}\left(\frac{x}{DJ}\right)^{0.161},\end{eqnarray}$$
where
 $x$
represents the distance to the jet orifice and
 $y$
represents the normal distance to the wall. Gruber et al. (Reference Gruber, Nejad, Chen and Dutton2000) suggested a power-law fit based on jet concentration identification; however, Ben-Yakar et al. (Reference Ben-Yakar, Mungal and Hanson2006) and Sun et al. (Reference Sun, Zhang, Zhao, Zhao and Liang2013) found an obvious deviation from their experiments. As discussed in the previous study (Ben-Yakar et al.
Reference Ben-Yakar, Mungal and Hanson2006; Sun et al.
Reference Sun, Zhang, Zhao, Zhao and Liang2013), better agreement was achieved with the correlation of Rothstein & Wantuck (Reference Rothstein and Wantuck1992),
 $$\begin{eqnarray}\frac{y}{DJ}=J^{-0.6985}\ln \!\left[4.704J\left(\frac{x}{DJ}+\frac{0.6373}{J}\right)\right].\end{eqnarray}$$
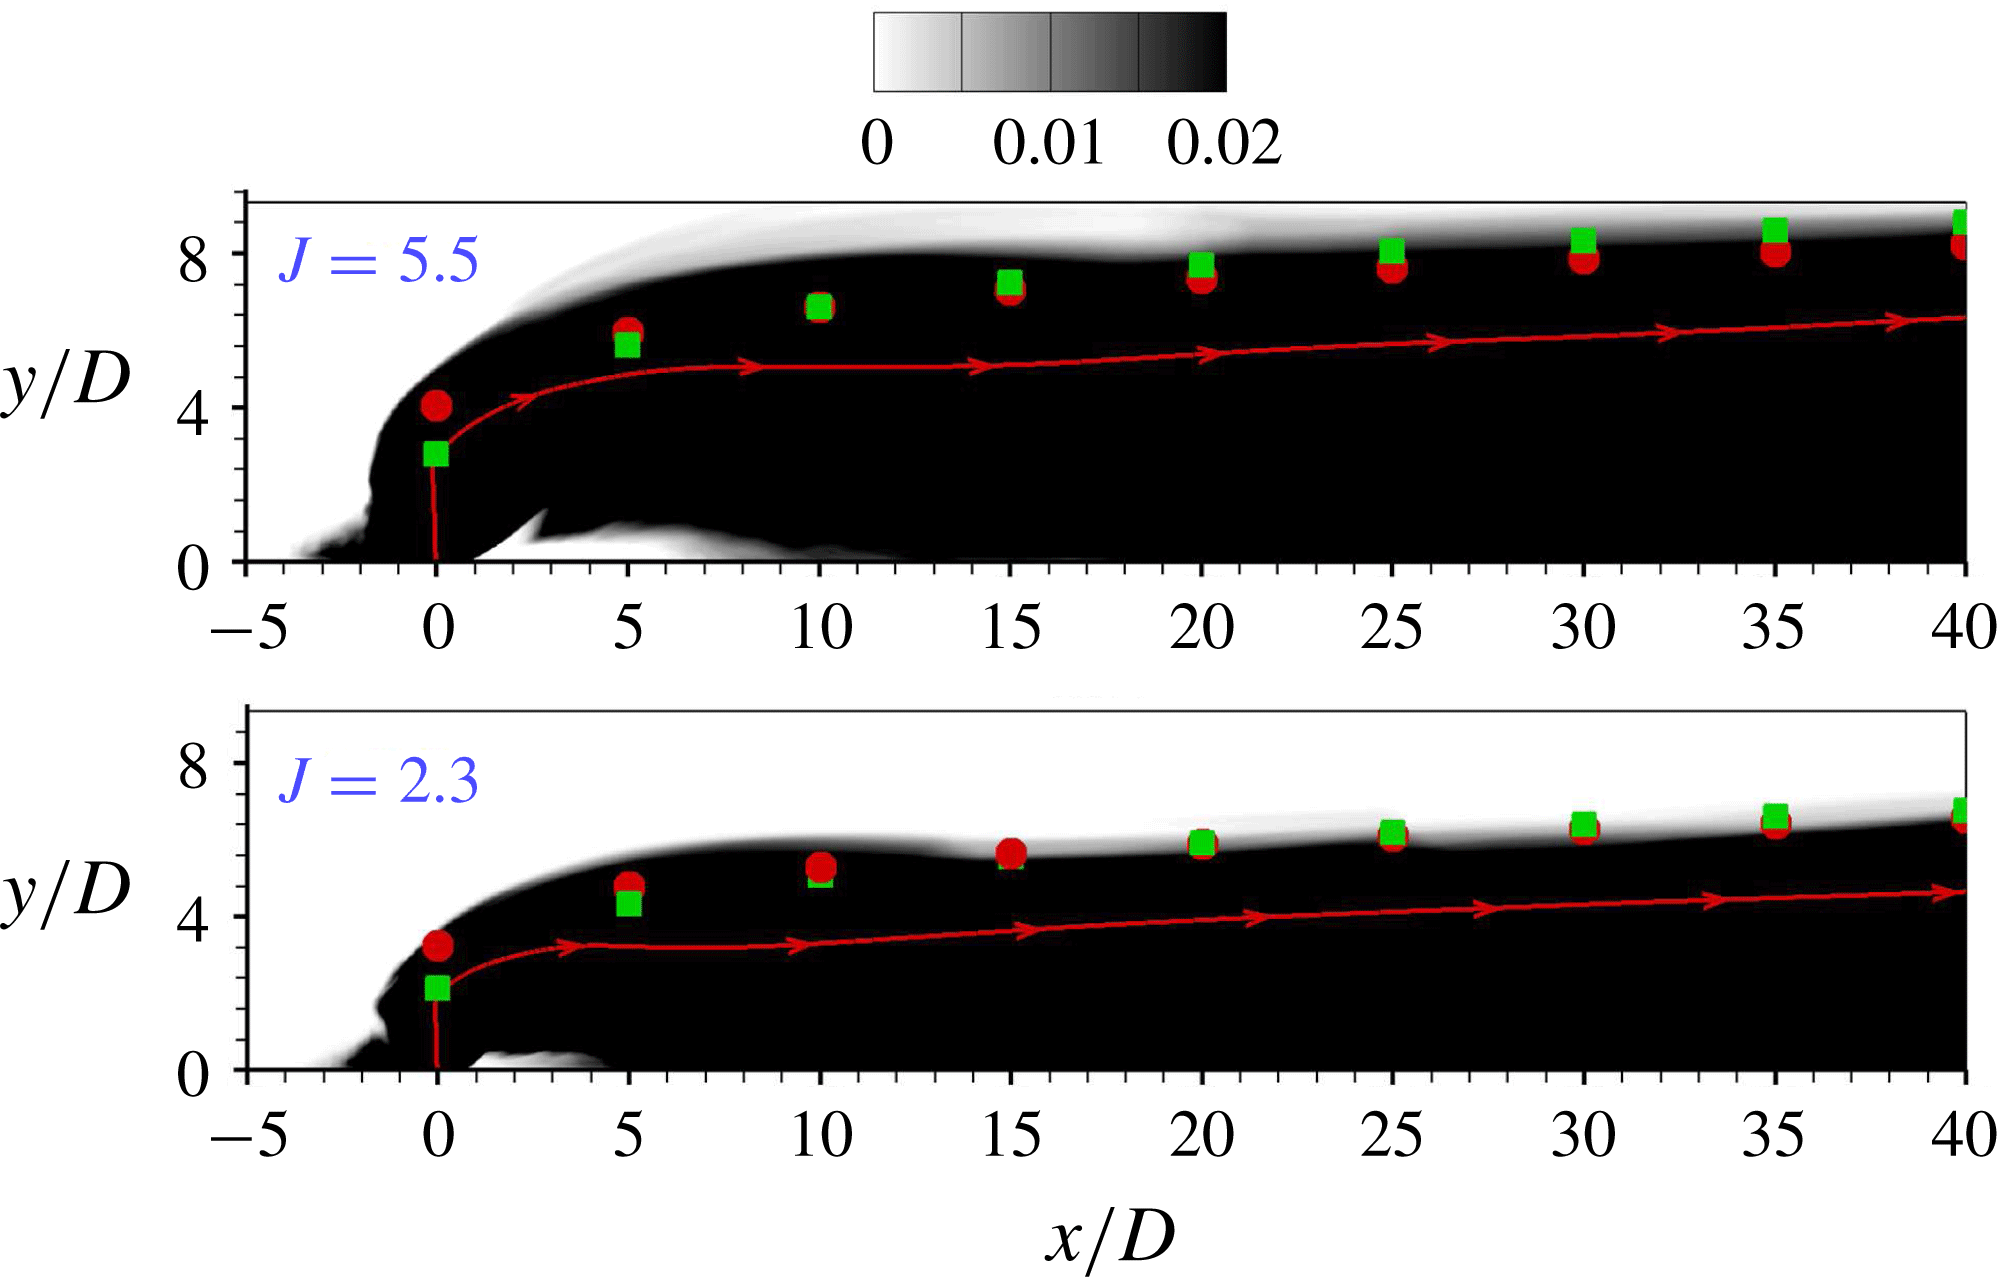
A transport equation for a passive scalar of jet fluid is solved in the simulation. Figure 4 shows the contours of time-averaged passive scalar for
 $J=5.5$
and
 $J=2.3$
. The approximate penetration boundary based on a concentration identification is obtained and compared with the calculated data from (2.1) and (2.2). It is seen that the current penetration result agrees well with previous experimental correlations for both
 $J=5.5$
and
 $J=2.3$
.
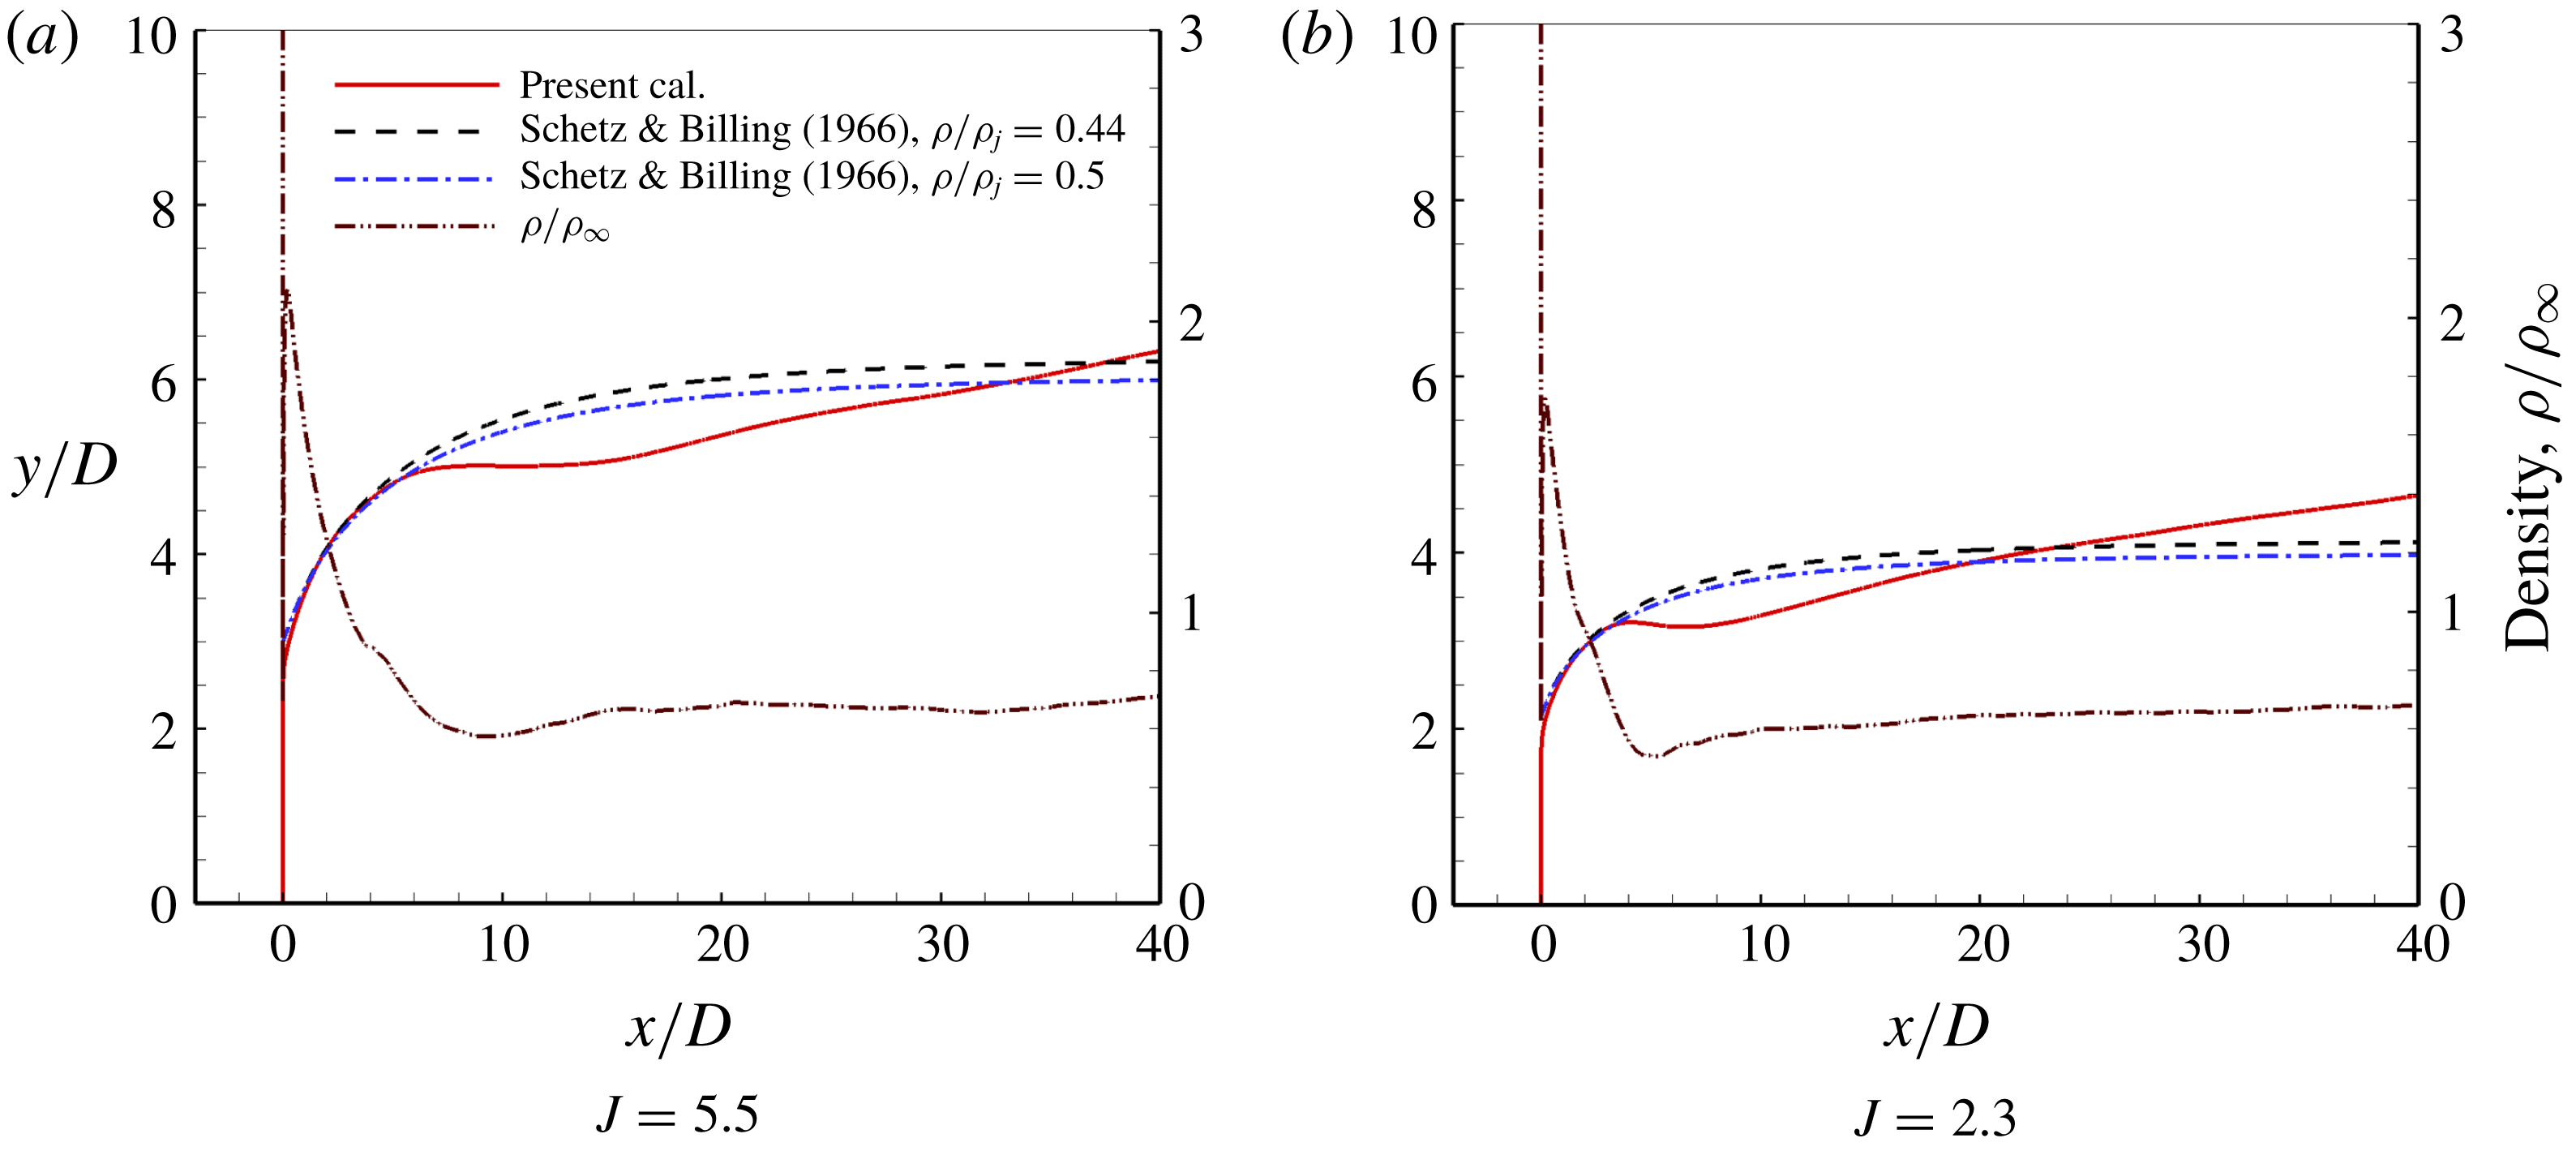
Similar to Muppidi & Mahesh (Reference Muppidi and Mahesh2005) and Chai et al. (Reference Chai, Iyer and Mahesh2015), the jet trajectory in the present study is defined as the streamline originating from the centre of the jet exit (centre streamline) on the time-averaged symmetry plane. In figure 4, the jet trajectory of
 $J=5.5$
and
 $J=2.3$
is extracted and shown from the velocity field, respectively. Schetz & Billig (Reference Schetz and Billig1966) analysed a sonic jet in a supersonic cross-flow (
 $M_{\infty }=2.1$
–2.7) at
 $J=4.75$
–10, and derived a differential equation that can be used to predict the jet trajectory,
 $$\begin{eqnarray}\frac{\text{d}\unicode[STIX]{x1D6FC}}{\text{d}\bar{s}}=-\frac{C_{D}(\unicode[STIX]{x1D6FC})\sin ^{2}(\unicode[STIX]{x1D6FC})}{2.5\unicode[STIX]{x03C0}}\frac{1}{J}\left(\frac{\unicode[STIX]{x1D70C}}{\unicode[STIX]{x1D70C}_{j}}\right)(2.25+0.22\bar{s})^{3},\end{eqnarray}$$
where
 $\bar{s}=s/d$
and
 $C_{D}$
is a drag coefficient determined by
 $$\begin{eqnarray}C_{D}=\left\{\begin{array}{@{}l@{}}1.2+\left(M_{\infty }\sin \unicode[STIX]{x1D6FC}\right)^{7/2},\\ 1.06+1.14\left(M_{\infty }\sin \unicode[STIX]{x1D6FC}\right)^{-3},\end{array}\right.\begin{array}{@{}l@{}}0\leqslant M_{\infty }\sin \unicode[STIX]{x1D6FC}\leqslant 1,\\ M_{\infty }\sin \unicode[STIX]{x1D6FC}\geqslant 1.\end{array}\end{eqnarray}$$
The jet trajectory can be obtained by integrating (2.3) from
 $\unicode[STIX]{x03C0}/2$
to 0. Schetz & Billig (Reference Schetz and Billig1966) further assumed that
 $\unicode[STIX]{x1D70C}$
does not change along the jet, i.e.
 $\unicode[STIX]{x1D70C}=\unicode[STIX]{x1D70C}_{j}$
. According to the suggestion of Chai et al. (Reference Chai, Iyer and Mahesh2015), the density variation along the jet (dashed-double dotted line in figure 5) should be taken into account. Chai et al. (Reference Chai, Iyer and Mahesh2015) defined an effective density ratio
 $(\unicode[STIX]{x1D70C}/\unicode[STIX]{x1D70C}_{j})^{eff}=\unicode[STIX]{x1D70C}_{f}/\unicode[STIX]{x1D70C}_{b}$
. Here
 $\unicode[STIX]{x1D70C}_{b}$
is the density of the jet immediately behind the barrel shock, which is the effective jet exit where the jet actually sees the cross-flow; and
 $\unicode[STIX]{x1D70C}_{f}$
is the average density far downstream of the jet. The jet density variation for
 $J=5.5$
is that
 $\unicode[STIX]{x1D70C}_{b}=1.39$
and
 $\unicode[STIX]{x1D70C}_{f}=0.61$
, which results in
 $(\unicode[STIX]{x1D70C}/\unicode[STIX]{x1D70C}_{j})^{eff}\approx 0.44$
. Further, we note that after interaction with the barrel shock, the centre streamline turns suddenly by approximately
 $30^{\circ }$
. Therefore, (2.3) should be integrated from
 $60^{\circ }$
instead of
 $90^{\circ }$
. Equation (2.3) predicts the trajectory of
 $J=5.5$
marked by dashed-dotted curve in figure 5(a). Chai et al. (Reference Chai, Iyer and Mahesh2015) considered
 $(\unicode[STIX]{x1D70C}/\unicode[STIX]{x1D70C}_{j})^{eff}\approx 0.5$
, which is also given in figure 5(a). These results shows reasonably good agreement with the current simulated result in the near field, and some deviation in the far field. Figure 5(b) shows the jet trajectory for
 $J=2.3$
, in which the prediction of Schetz & Billig (Reference Schetz and Billig1966) deviates from the calculated jet penetration more clearly in the far field than
 $J=5.5$
. It is inferred that (2.3) exhibits larger errors from simulations when smaller
 $J$
(
 ${<}4.75$
) is considered.
Comparison between present calculation of jet trajectory and the prediction using the modified theory of Schetz & Billig (Reference Schetz and Billig1966).

3 Numerical results and analysis
All simulations were performed on Archer, the UK’s National Supercomputer. Each simulation requires approximately 540 000 processor core hours for flow development and collecting statistics over 100 non-dimensional time units
 $(D/U_{\infty })$
.
3.1 Instantaneous flow structures in jet near-wall wakes
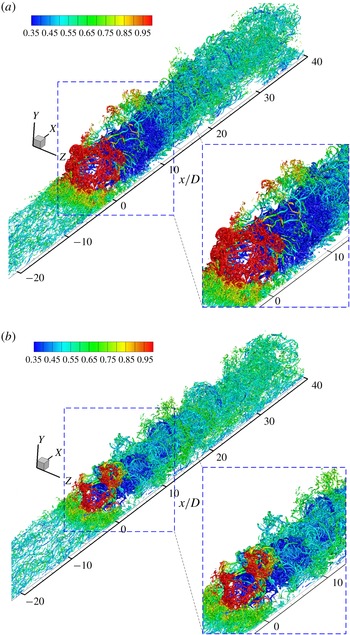
Typical instantaneous results of
 $\unicode[STIX]{x1D706}_{2}$
isosurface (Jeong & Hussain Reference Jeong and Hussain1995) in the jet flow field of
 $J=5.5$
and
 $J=2.3$
are shown in figure 6, coloured by the local density. It shows clearly the mixing process of the low-density jet plume with the main stream and the incoming boundary layer. Jet plume density is low in the near field and increases as the jet plume is convected downstream. The sonic jet with higher
 $J$
(
 $=5.5$
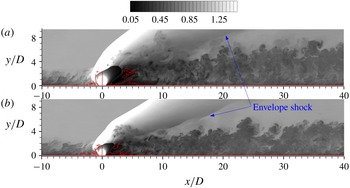
) has a more intense interaction with the incoming flow, which results in a larger separation region and a higher penetration height. Typical instantaneous simulated results of density contours at
 $z/D=0.0$
in the flow field of
 $J=5.5$
and
 $J=2.3$
are shown in figure 7, which also corresponds to the density variation in figure 5. In particular, the shock and turbulent structures are well identified. The jet structures, including the bow shock, the barrel shock and separation bubbles and the horseshoe vortex, have been analysed in detail in the literature and we will focus on jet wake flows.
Instantaneous isosurfaces of vortex structures (
 $\unicode[STIX]{x1D706}_{2}=-0.3$
) at (a)
 $J=5.5$
and (b)
 $J=2.3$
coloured by local density.

Density contour at
 $z/D=0.0$
slice of jet interaction with supersonic cross-flow at (a)
 $J=5.5$
and (b)
 $J=2.3$
; isoline of
 $u/U_{\infty }=0.0$
is superimposed in red.

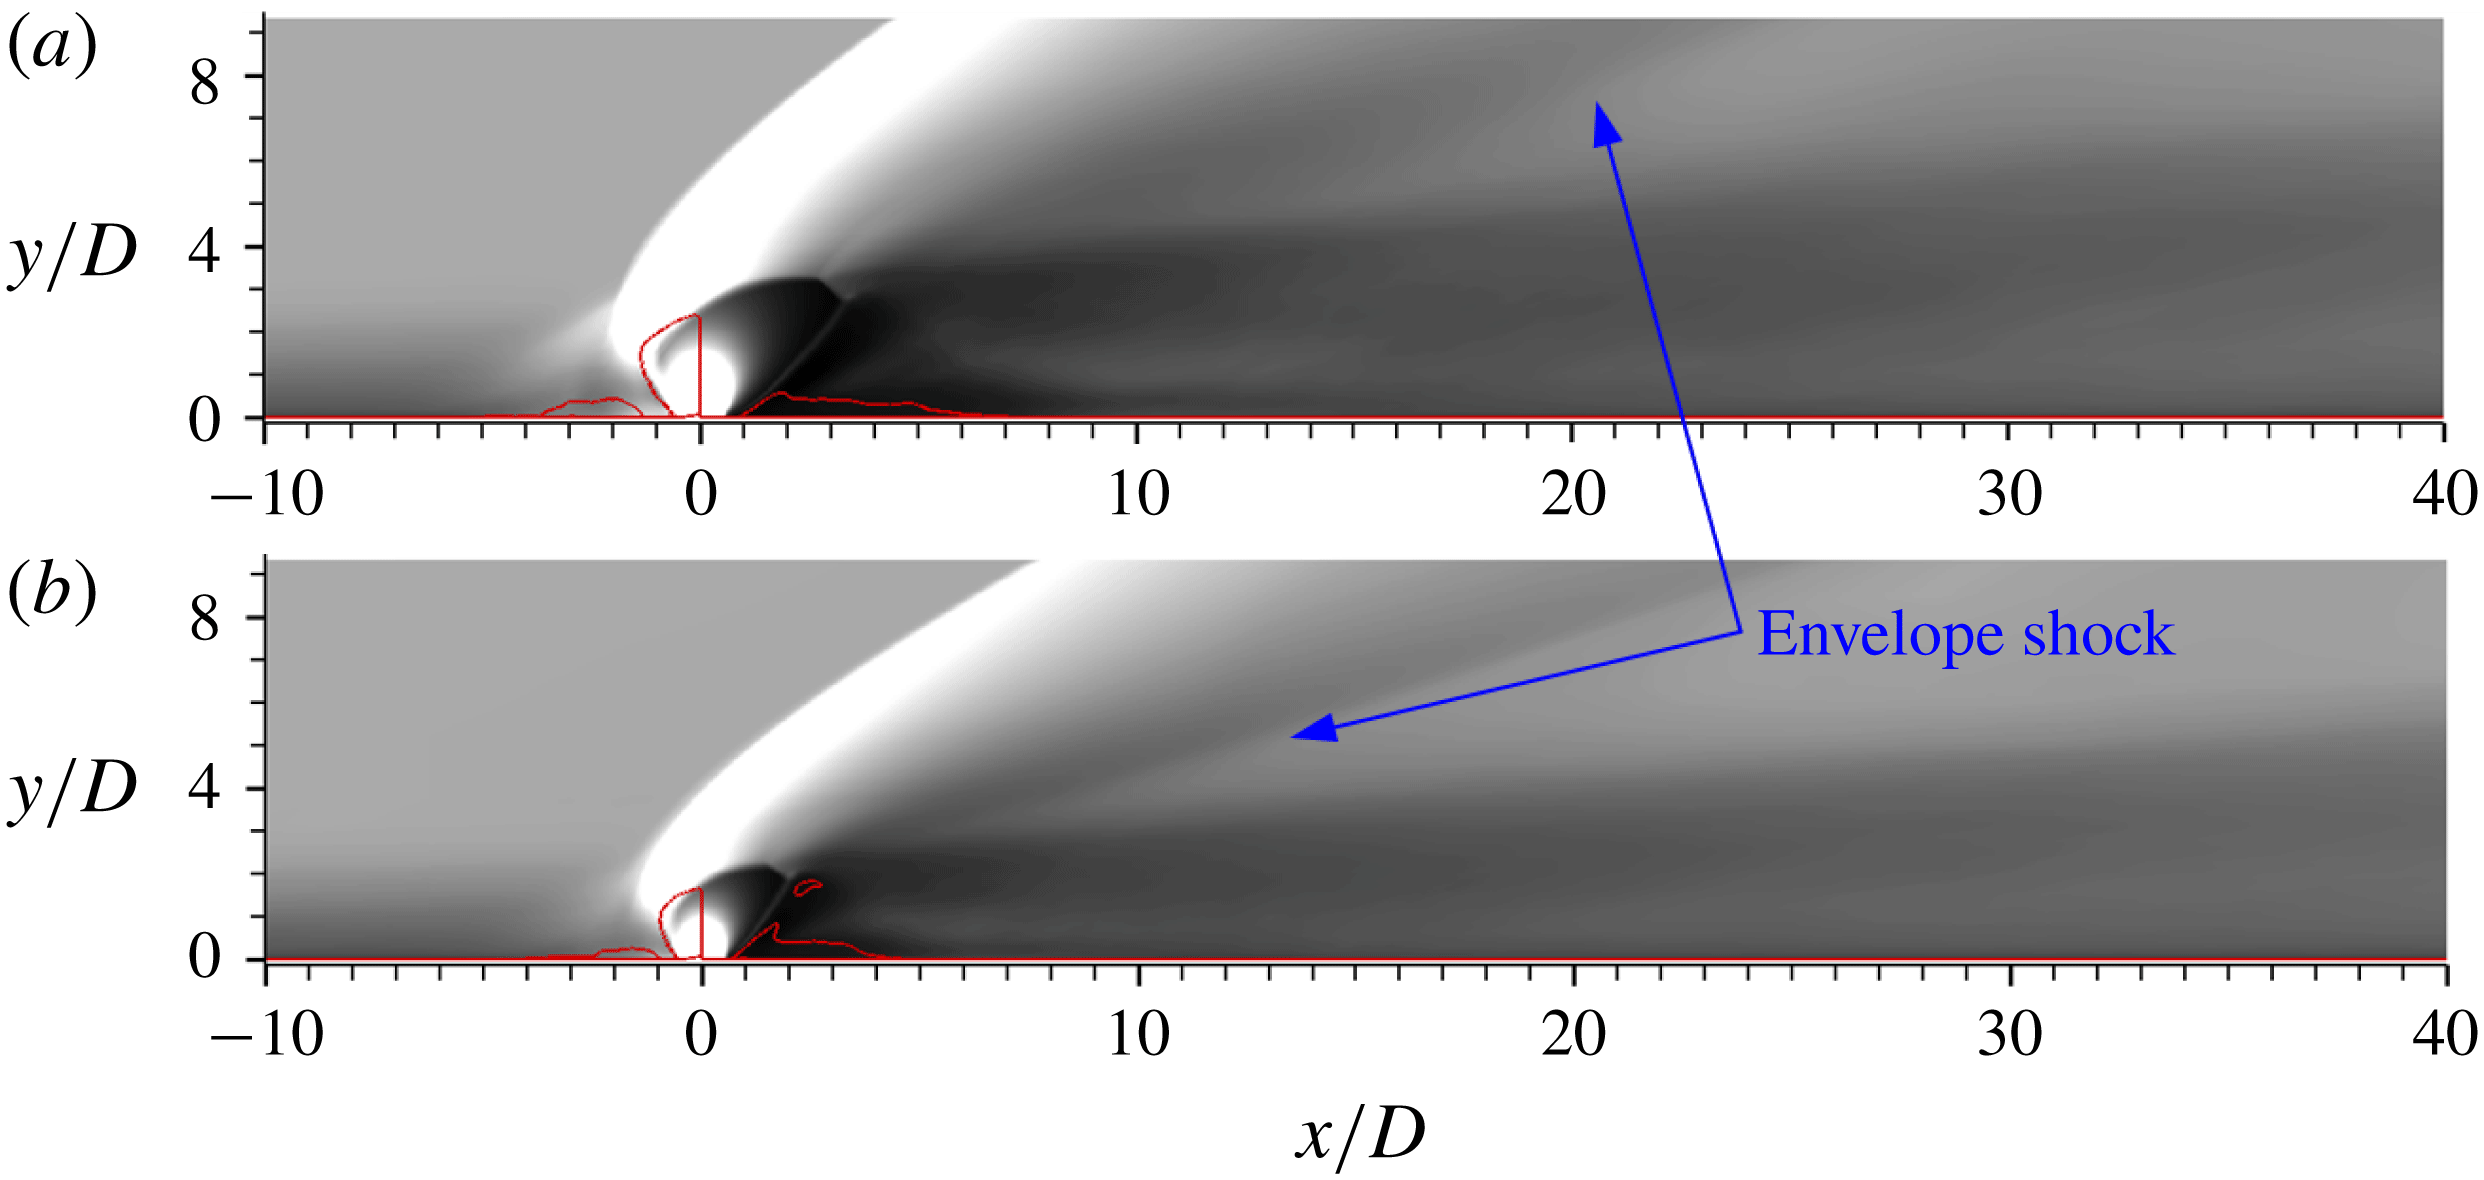
In figure 7 it is seen that a twisted envelope shock appears behind the jet in both cases and it is clearer in the
 $J=2.3$
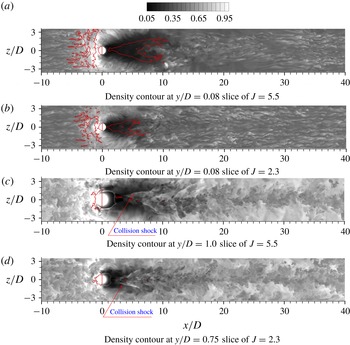
case. As described often previously (e.g. Morkovin, Pierce & Craven Reference Morkovin, Pierce and Craven1952; Mahesh Reference Mahesh2013), the envelope shock originates from the pressure gradients around the expanding jet. Strong mixing occurs in the jet wake flow and turbulent structures are identical in both the near field and the far field. Near-wall density fields are shown in figure 8 on horizontal planes. Turbulent streaks are exhibited in figure 8(a,b) at
 $y/D=0.08$
, which reflect the local turbulence, and their response to the jet injection will be analysed in another paper. There appear herringbone separation zones (wrapped by solid lines representing zero streamwise velocity) which extend in both the streamwise and spanwise directions, as shown in figure 8 at
 $y/D=0.08$
slices. In the lateral downstream of the jet orifice, local density magnitude decreases significantly, which implies that expansion occurs near the jet leeward. High-velocity fluid moves downstream around the jet and interacts with the shock generated by the collision of the flow around the jet barrel. The collision shock waves are clearly seen in density contours on
 $y/D=1.0$
slice of
 $J=5.5$
and
 $y/D=0.75$
slice of
 $J=2.3$
and they are twisted due to local turbulence. It is clear that these collision shocks induce the herringbone separation in the near-wall region and they have a complex interaction. The collision shock is 3D since the separation zone is herringbone and there are two separation oblique wings. In figure 8(a,b), it is seen that the herringbone separation region is confined and flow reattaches downstream of the cross-point of the wings. In the vicinity of the symmetry plane, a recovery region is embayed by the herringbone separation region near the centreline. The herringbone separation region for
 $J=5.5$
is larger than for the
 $J=2.3$
case and their flow patterns are similar.
Instantaneous streamwise velocity streaks at different horizontal planes of jet interaction with the incoming boundary layer for
 $J=5.5$
and
 $J=2.3$
cases; isolines of
 $u/U_{\infty }=0$
are superimposed in red.

Time-averaged density contours on
 $z/D=0.0$
plane for (a)
 $J=5.5$
and (b)
 $J=2.3$
cases; isolines of
 $u/U_{\infty }=0.0$
are superimposed in red.

3.2 Mean flow properties in the jet near-wall wake flow field
Time-averaged density contours at
 $z/D=0.0$
slice are shown in figure 9. It is seen that the averaged flow patterns are similar for
 $J=5.5$
and 2.3. The penetration height, barrel shock size and jet leeward separation size of
 $J=5.5$
are larger than for
 $J=2.3$
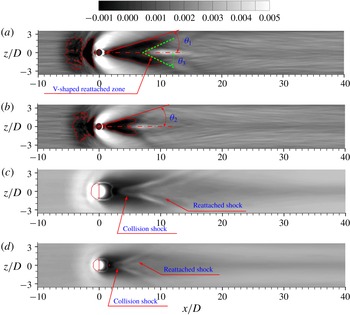
. The envelope shock related to the expanding jet barrel is clear on the time-averaged contour. Skin friction coefficient contours are shown at
 $y/D=0.0$
in figure 10(a,b). The solid isolines superimposed on the filled contours correspond to
 $u/U_{\infty }=-0.0001$
and the region surrounded by the isolines represents a separated zone. It clearly shows that the mean herringbone separation region is limited in the domain wrapped by the collision shock waves. In the vicinity of the symmetry plane, flow reattaches more quickly than outside, resulting in a V-shaped reattachment line (as shown in figure 10
a) behind the separation zone. The herringbone separation size of
 $J=5.5$
is larger than for
 $J=2.3$
and it is expected that the maximum width of the separation is related to
 $J$
. The interesting part is the half-span expanding angle of the mean separation line (drawn by a solid line in figure 10
a,b) with jet centreline. A comparison between the
 $J=2.3$
case and
 $J=5.5$
case shows that the expansion of the separation region is virtually the same for
 $J=5.5$
(figure 10
a) and
 $J=2.3$
(figure 10
b), that is,
 $\unicode[STIX]{x1D703}_{1}\approx \unicode[STIX]{x1D703}_{2}\approx 15.6^{\circ }$
. This feature demonstrates that the separation line is independent of
 $J$
. This could be expected since separation is mainly induced by the leeward collision shock and the collision shock angle is only dependent upon the free-stream Mach number. The increase of
 $J$
or orifice diameter would not change the collision shock angle and the half-span expanding angle of the separation line. The deflection angle
 $\unicode[STIX]{x1D703}_{3}~({\approx}28.0^{\circ })$
of the V-shaped reattachment line (shown in figure 10
a) with the jet centreline is larger than
 $\unicode[STIX]{x1D703}_{1}$
and
 $\unicode[STIX]{x1D703}_{2}$
. In figure 10(c,d), time-averaged collision shock waves and reattached shock waves are identified. The reattached shock is located behind the collision shock and between them exists a low-density field, which reflects local expansion and reattachment in separation/shock interaction. As discussed in § 3.1, reattached shock waves reveal the three-dimensionality of the herringbone separation zone.
Time-averaged skin friction coefficient and density contours on different horizontal planes for
 $J=5.5$
and
 $J=2.3$
cases; isolines of
 $u/U_{\infty }=0.0$
are superimposed in red. (a) Skin friction coefficient contour at
 $y/D=0.0$
slice of
 $J=5.5$
. (b) Skin friction coefficient contour at
 $y/D=0.0$
slice of
 $J=2.3$
. (c) Density contour at
 $y/D=1.0$
slice of
 $J=5.5$
. (d) Density contour at
 $y/D=0.75$
slice of
 $J=2.3$
.

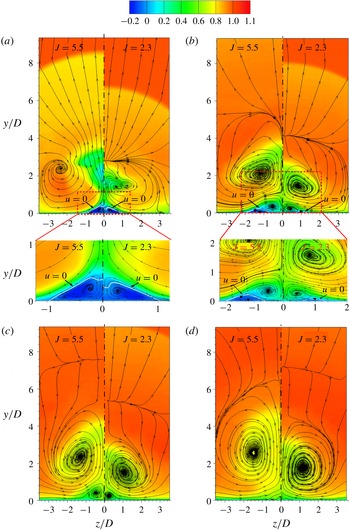
Figure 11 represents the streamlines on the cross-flow planes downstream of the jet plume for
 $J=2.3$
and
 $J=5.5$
. The major CVP appears due to the interaction of the free-stream flow with the jet fluid and grows in size further downstream. As the major CVP starts to grow in size as in figure 11, another small pair of vortices, named the lower trailing CVP, occurs near to the surface. The lower trailing CVP is denoted as the surface trailing CVP in this paper, and for brevity we also call it the trailing CVP (TCVP). This TCVP is usually thought to be due to the low-pressure recirculation zone and the suction effect of the major CVP. Figure 11 shows that the TCVP rotates in the opposite direction to the major CVP and disappears as the jet plume lifts up downstream, which is an apparent feature for the far field. The interesting part lies in the correlation of the separation bubble with the TCVP. Separation lines of
 $u/U_{\infty }=0.0$
are shown in figure 11(a,b) and there is no separation zone in figure 11(c,d). The enlarged view of the window in figure 11(a) clearly demonstrates that the TCVP is mainly located in the separation bubble, or in the recirculation zone based on the separation bubble. This phenomenon clearly exists for both
 $J=5.5$
and
 $J=2.3$
cases. In figure 11(b) the separation bubble is pushed aside from the centreline and its size decreases to become very small.
Contours of the mean flow streamwise velocity and streamlines on cross-planes of
 $J=5.5$
and
 $J=2.3$
; isolines of
 $u/U_{\infty }=0.0$
are superimposed. (a)
 $x/D=3.5$
for
 $J=5.5$
and
 $x/D=3.5$
for
 $J=2.3$
. (b)
 $x/D=8$
for
 $J=5.5$
and
 $x/D=5.5$
for
 $J=2.3$
. (c)
 $x/D=12$
for
 $J=5.5$
and
 $x/D=8$
for
 $J=2.3$
. (d)
 $x/D=18$
for
 $J=5.5$
and
 $x/D=12$
for
 $J=2.3$
.

Combining with figure 10, it is found that the separation bubble has a 3D configuration. In the jet leeward, the separation bubble has a large size, especially in height. In the separation wing of the herringbone bubble, though the separation covers a large area, the height of the separation bubble is small and the whole separation region is attached to the wall surface. The TCVP in figure 11(b) very clearly occurs in the domain with
 $u/U_{\infty }>0.0$
, which is obviously kept outside of the separation bubble and it is quite different from the TCVP shown in figure 11(a). This is very interesting since no researchers have mentioned this before. The literature on jets in supersonic cross-flow usually give a fuzzy description about the TCVP in the jet leeward and lead to the impression that the TCVP is a single character in both the near field and far field due to the suction of the major CVP. A careful observation shows that in the separation bubble of the
 $J=2.3$
case in figure 11(b), there is still a recirculation zone around a small separation bubble. And it is clear that the TCVP near to the centreline is not in the recirculation zone but is kept some distance from it. In figure 11(c) the separation bubble vanishes and the TCVP is totally located in a favourable flow region. In figure 11(d) the TCVP disappears completely in the far field.
Figure 12 gives the streamwise vorticity contours at different
 $x$
-locations. It is seen that the magnitude of vorticity of the TCVP is comparable to the major CVP in the jet vicinity and even larger than the major CVP at
 $x/D=8$
. The vorticity of the surface TCVP in figure 12(a,b) has the same sign while their configurations are varied. Thus very interesting questions are presented here, such as whether the TCVP shown in figures 11(a) and 12(a) is occurring in the same vortex tubes with the TCVP shown in figures 11(b) and 12(b), since the two TCVPs shown in figure 11(a,b) or figure 12(a,b) are located in separated and reattached regions, respectively. Since figures 11 and 12 only demonstrates the 2D flow character on different cross-flow slices in the flow field, it is difficult to answer this question before detailed 3D flow topology is unveiled.
Contours of the time-averaged streamwise vorticity on cross-planes of
 $J=5.5$
and
 $J=2.3$
. (a)
 $x/D=3.5$
for
 $J=5.5$
and
 $x/D=3.5$
for
 $J=2.3$
. (b)
 $x/D=8$
for
 $J=5.5$
and
 $x/D=5.5$
for
 $J=2.3$
.

From figures 9–11 it is seen that the flow fields of
 $J=2.3$
and
 $J=5.5$
are similar. Since
 $J=5.5$
provides a stronger jet interaction, we will mainly analyse the
 $J=5.5$
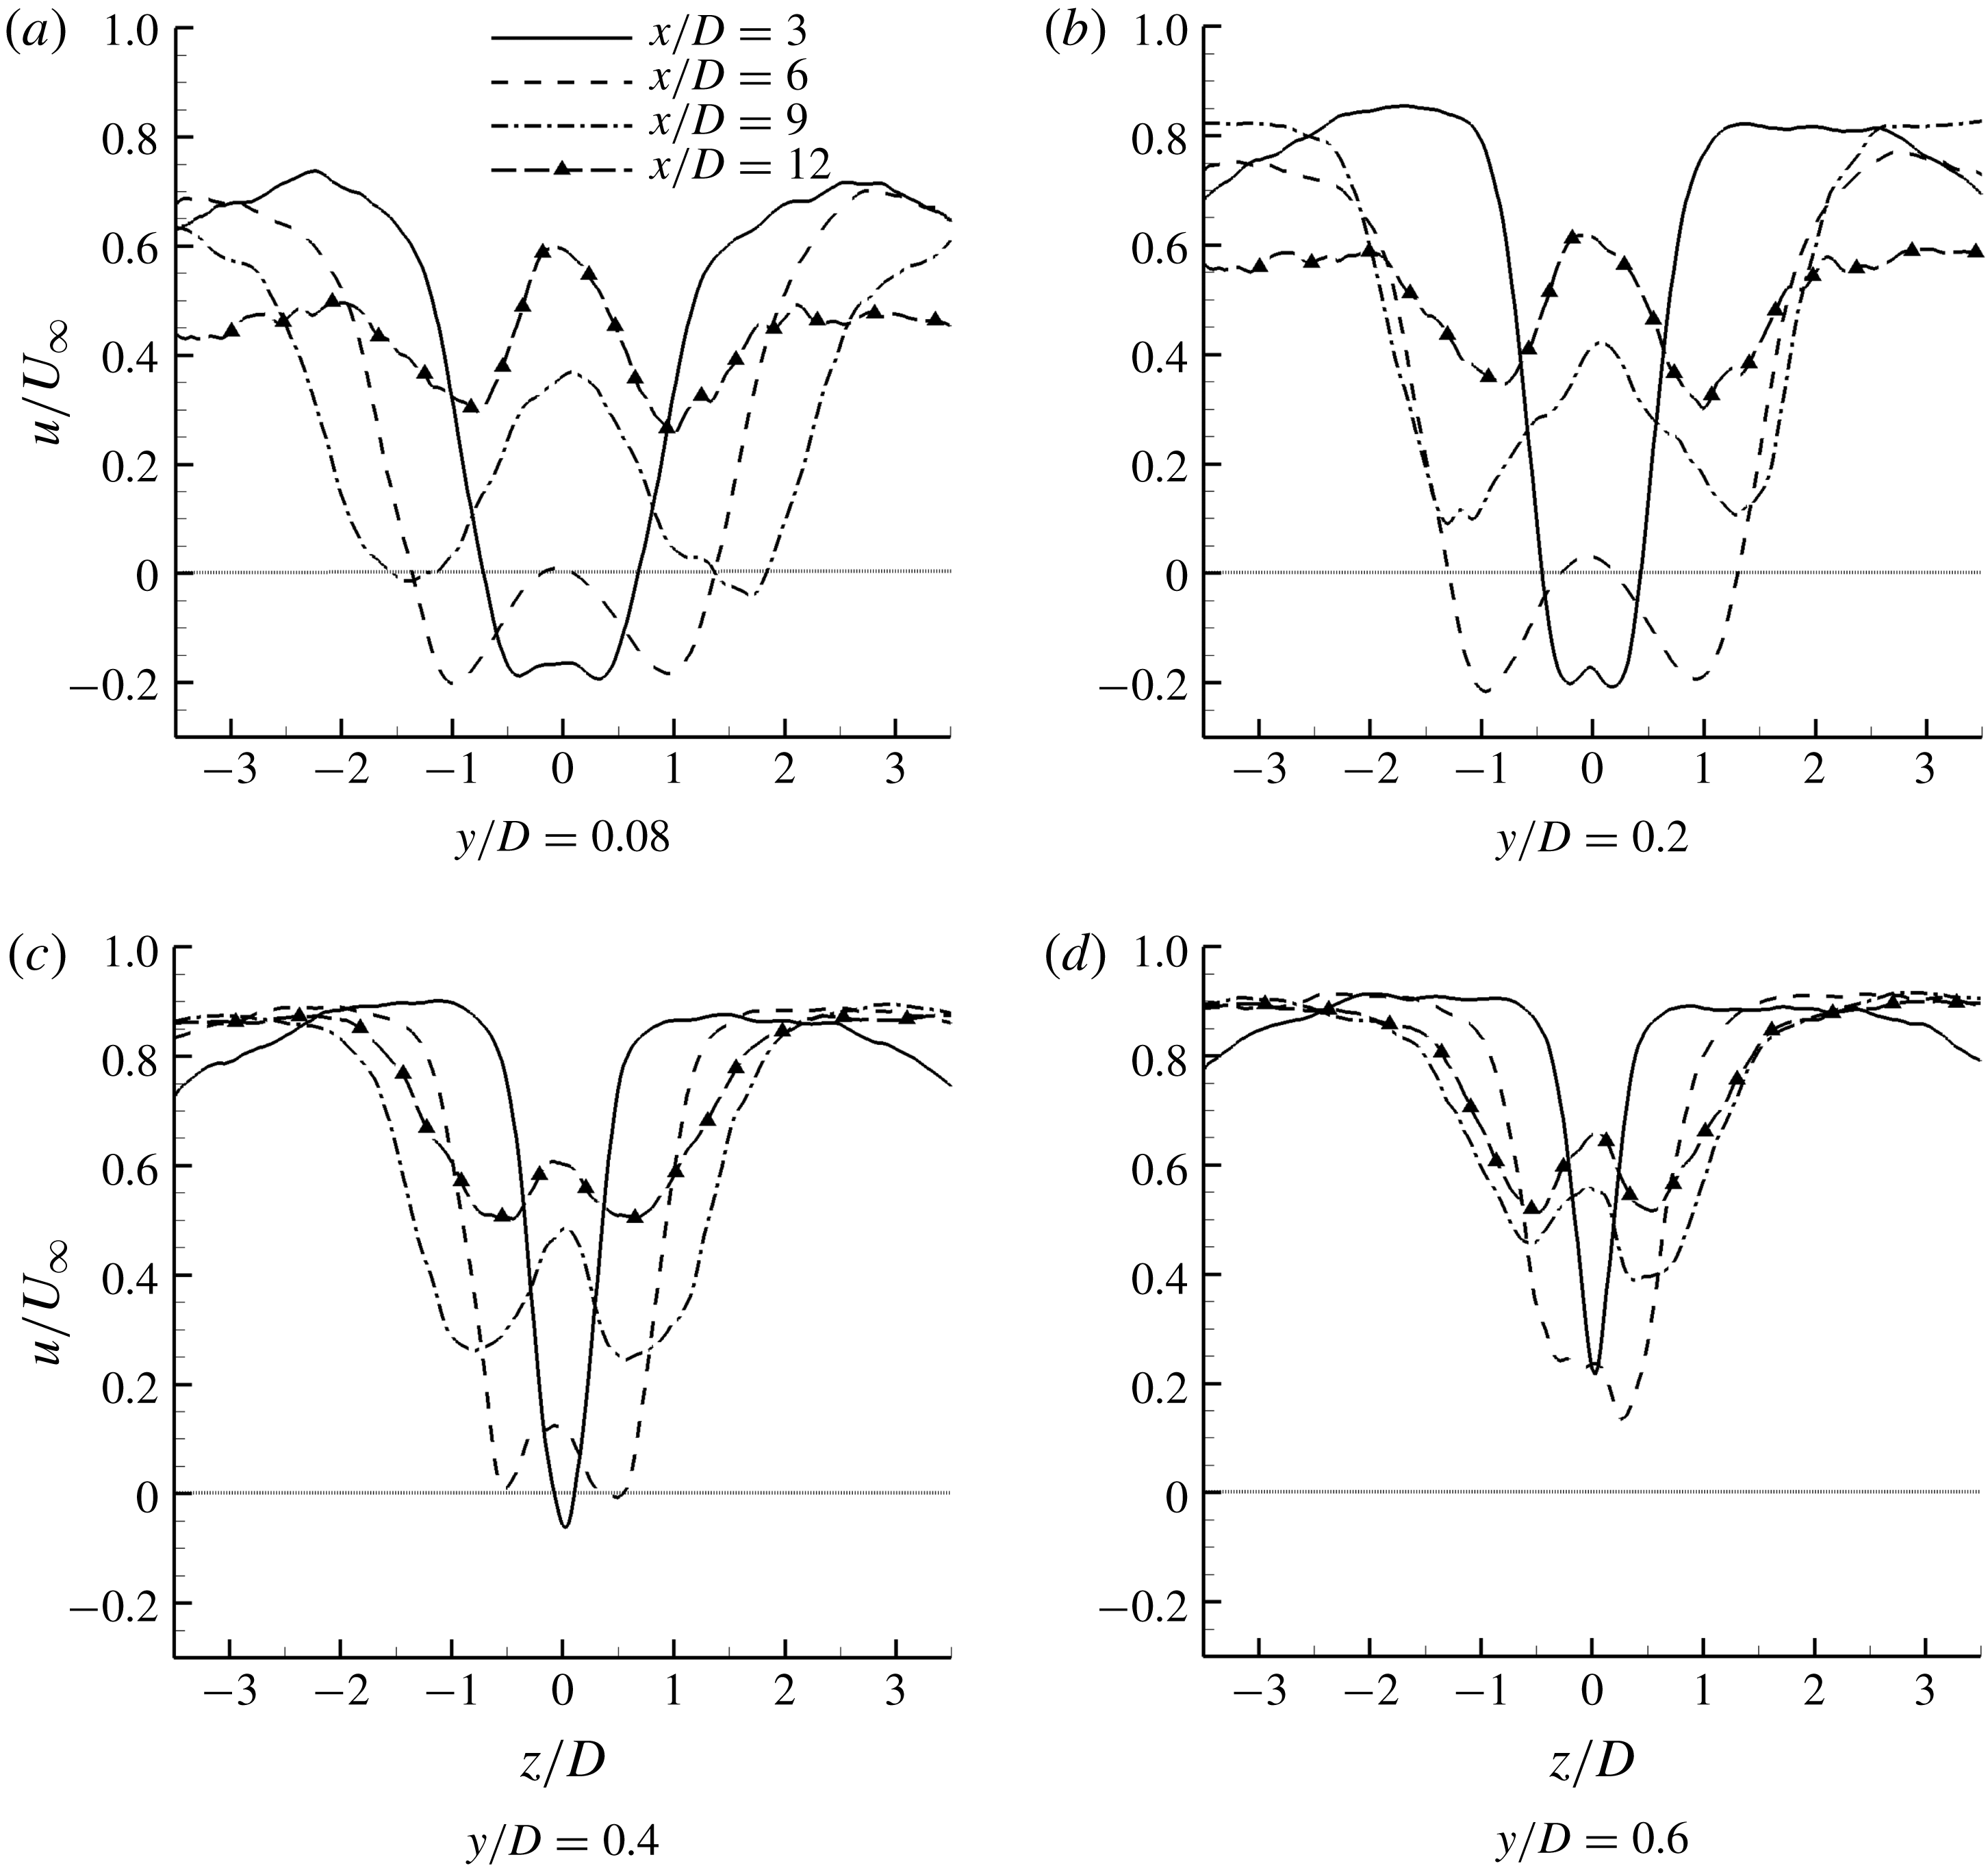
flow field hereafter. Firstly, velocity profiles at the same wall-normal distance are shown in figure 13 for different streamwise locations. The velocity profiles have a W-shape (the arrow points) corresponding to the herringbone separation. It is seen that in figure 13(a–b) at
 $x/D=3$
and 6, the velocity downstream of the jet is negative (dotted line in figure 13 represents
 $u/U_{\infty }=0.0$
), which corresponds to a recirculation. The size of the recirculation region approaches nearly zero at
 $y/D=0.4$
, as shown in figure 13(c). Along the streamwise direction on the
 $y/D=0.08$
plane, the velocity increases and at
 $x/D=9$
a positive velocity field is observed. At
 $x/D=14$
, it is seen that the velocity profile has basically recovered and an earlier recovery occurs in the reattachment region near to the symmetry plane. At other wall-normal locations (
 $y/D=0.4$
and
 $y/D=0.6$
), this phenomenon is also apparent. The W-shaped width in the velocity profile along the wall-normal direction converges significantly from
 $y/D=0.08$
to
 $y/D=0.6$
, which means that the region affected by the jet is decreased in
 $y$
-axis. On the
 $y/D=0.6$
plane, the velocity profile at
 $x/D=6$
is completely positive, which indicates that the recirculation is located under the
 $y/D=0.6$
plane. The separation width from the velocity profiles also converges from the
 $y/D=0.08$
to
 $y=0.2$
plane, which reflects that the separation is likely to be a bump on the surface.
Several conclusions could be made from the above analysis. The first is that the TCVP shown in figure 11(a–c) is located in totally different velocity regimes. The TCVP in figure 11(a) is in a separation region while the TCVP in figure 11(b,c) is in a zone with positive velocity. From this point, these TCVPs are inevitably different in formation. It is appropriate to denote the TCVP shown in figure 11(a) as the primary TCVP and that in figure 11(b) as a secondary TCVP. The second is that the separation region has a complex 3D configuration; the edge of the separation region is located below
 $y/D=0.6$
and the separation bubble has a decreased width along the
 $y$
-axis.
Time-averaged velocity profile at different wall-normal locations of
 $J=5.5$
case; the grey line represents
 $u/U_{\infty }=0.0$
.

Contours of time-averaged pressure and Mach-number contours and streamlines on different planes of
 $J=5.5$
. The separation line
 $u/U_{\infty }=0.0$
is superimposed.

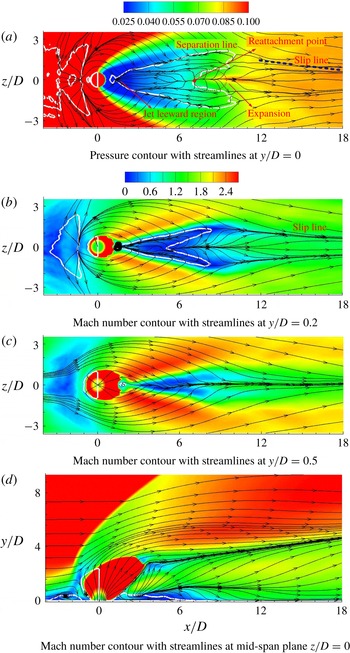
Time-averaged pressure and Mach-number contours at various locations along with streamlines are shown in closer view in figure 14, which are consistent with the analysis on figure 13. The separation line of
 $u/U_{\infty }=-0.0001$
is shown in figure 14(a) with white solid line. It is seen that the herringbone recirculation has two wings, which correspond to two oblique symmetric separation regions. Between the wings there is a zone with positive velocity, which means that reattachment occurs and it is embayed by the separated zone, as shown in the dotted-line window. A reattached point with
 $u/U_{\infty }=-0.0001$
in the centreline is also marked in figure 14(a). The streamlines clearly show the inner flow structure of recirculation zones. The pressure contour shown in figure 14(a) demonstrates that a low pressure exists in the jet leeward due to the blockage and expansion effects from the jet. Cross-flow runs around the jet and impinges together in the jet leeward, which leads to a local pressure increment due to the collision effects. Remember that this collision shock corresponds to the secondary shock in figure 1(a). It is identified that the pressure after the separation line drawn in figure 14(a) increases, which implies the existence of a shock/boundary layer interaction. From figure 14(b) we can see that cross-flow near the wall in the jet lateral is supersonic. This is expected since the separation region ahead of the jet pushes cross-flow high away from the surface and a sudden expansion after the separation bubble occurs in the negative
 $y$
-axis. The cross-flow running into the jet leeward experiences further expansion in the spanwise direction. These two expansions cause the flow speed to become supersonic and it is sure that the collision shock would have a foot standing in the recirculation. As shown in figure 14(a–c), when the wall-normal distance increases from
 $y/D=0.0$
to 0.5, the separation region ends further upstream and this is due to the three-dimensionality of the separation bubble. At
 $y/D=0.5$
, there is no obvious recirculating flow. The separation region in the jet wake and the reattachment region can also be identified in figure 14(d), which shows Mach-number contours and a superimposed separation line.
In figure 14 it is confirmed again that the TCVPs in figure 11(a,b) are different vortices since the velocity fields are completely different. The counter-rotating character of the primary TCVP is not only related to the recirculation in the spanwise direction, but also connected to the recirculating flow opposite the incoming flow.
From figure 14(a,b), it is seen that the herringbone region fades some distance behind the separation wing. This is expected, since streamlines running around the jet impinge on the wingtip of the herringbone separation and result in a wing interception, which indicates that the interaction intensity of the major CVP reduces significantly at the wingtip location since the major CVP has been lifted to a higher position. Owing to the impingement of the lateral supersonic flow around the jet, the trailing wingtip is converged. At the same time the reattachment flow extends in the reattachment zone (shown in the dashed-line window of figure 14 a), impinges the separation bubble and blows off the near-wall separated flow. It is identified since in figure 14(a) streamlines in the reattachment region run into the separation wing region and the downstream zone in the far field. The cross-interaction in this wingtip region leads to the termination of the oblique trailing separation wings. Downstream of the vicinity of the reattachment region, there is an expansion zone in which a diverging streamline impinges with cross-flow and forms a slip line, as shown in figure 14(a). This expansion zone is attached to the wall since no such phenomenon is found in figure 14(c). The reattachment supersonic flow impinges on the wall and leads to a pressure increment in the downstream region of the herringbone separation bubble. As shown in figure 10(c), a weak reattachment shock is generated after the flow expansion over the separation wing.
Contours of the time-averaged Reynolds stress and TKE on different horizontal planes of
 $J=5.5$
non-dimensionalized by
 $U_{\infty }^{2}$
.

Time-averaged Reynolds stress and TKE profiles at
 $y/D=0.4$
of
 $J=5.5$
case, non-dimensionalized by
 ${U^{2}}_{\infty }$
.

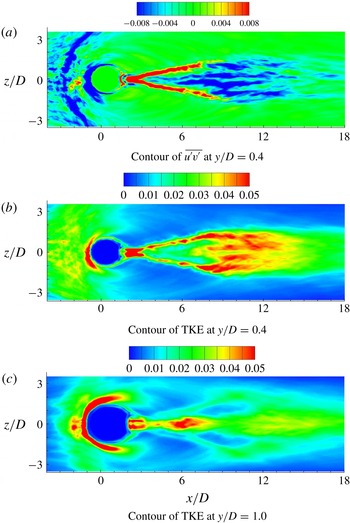
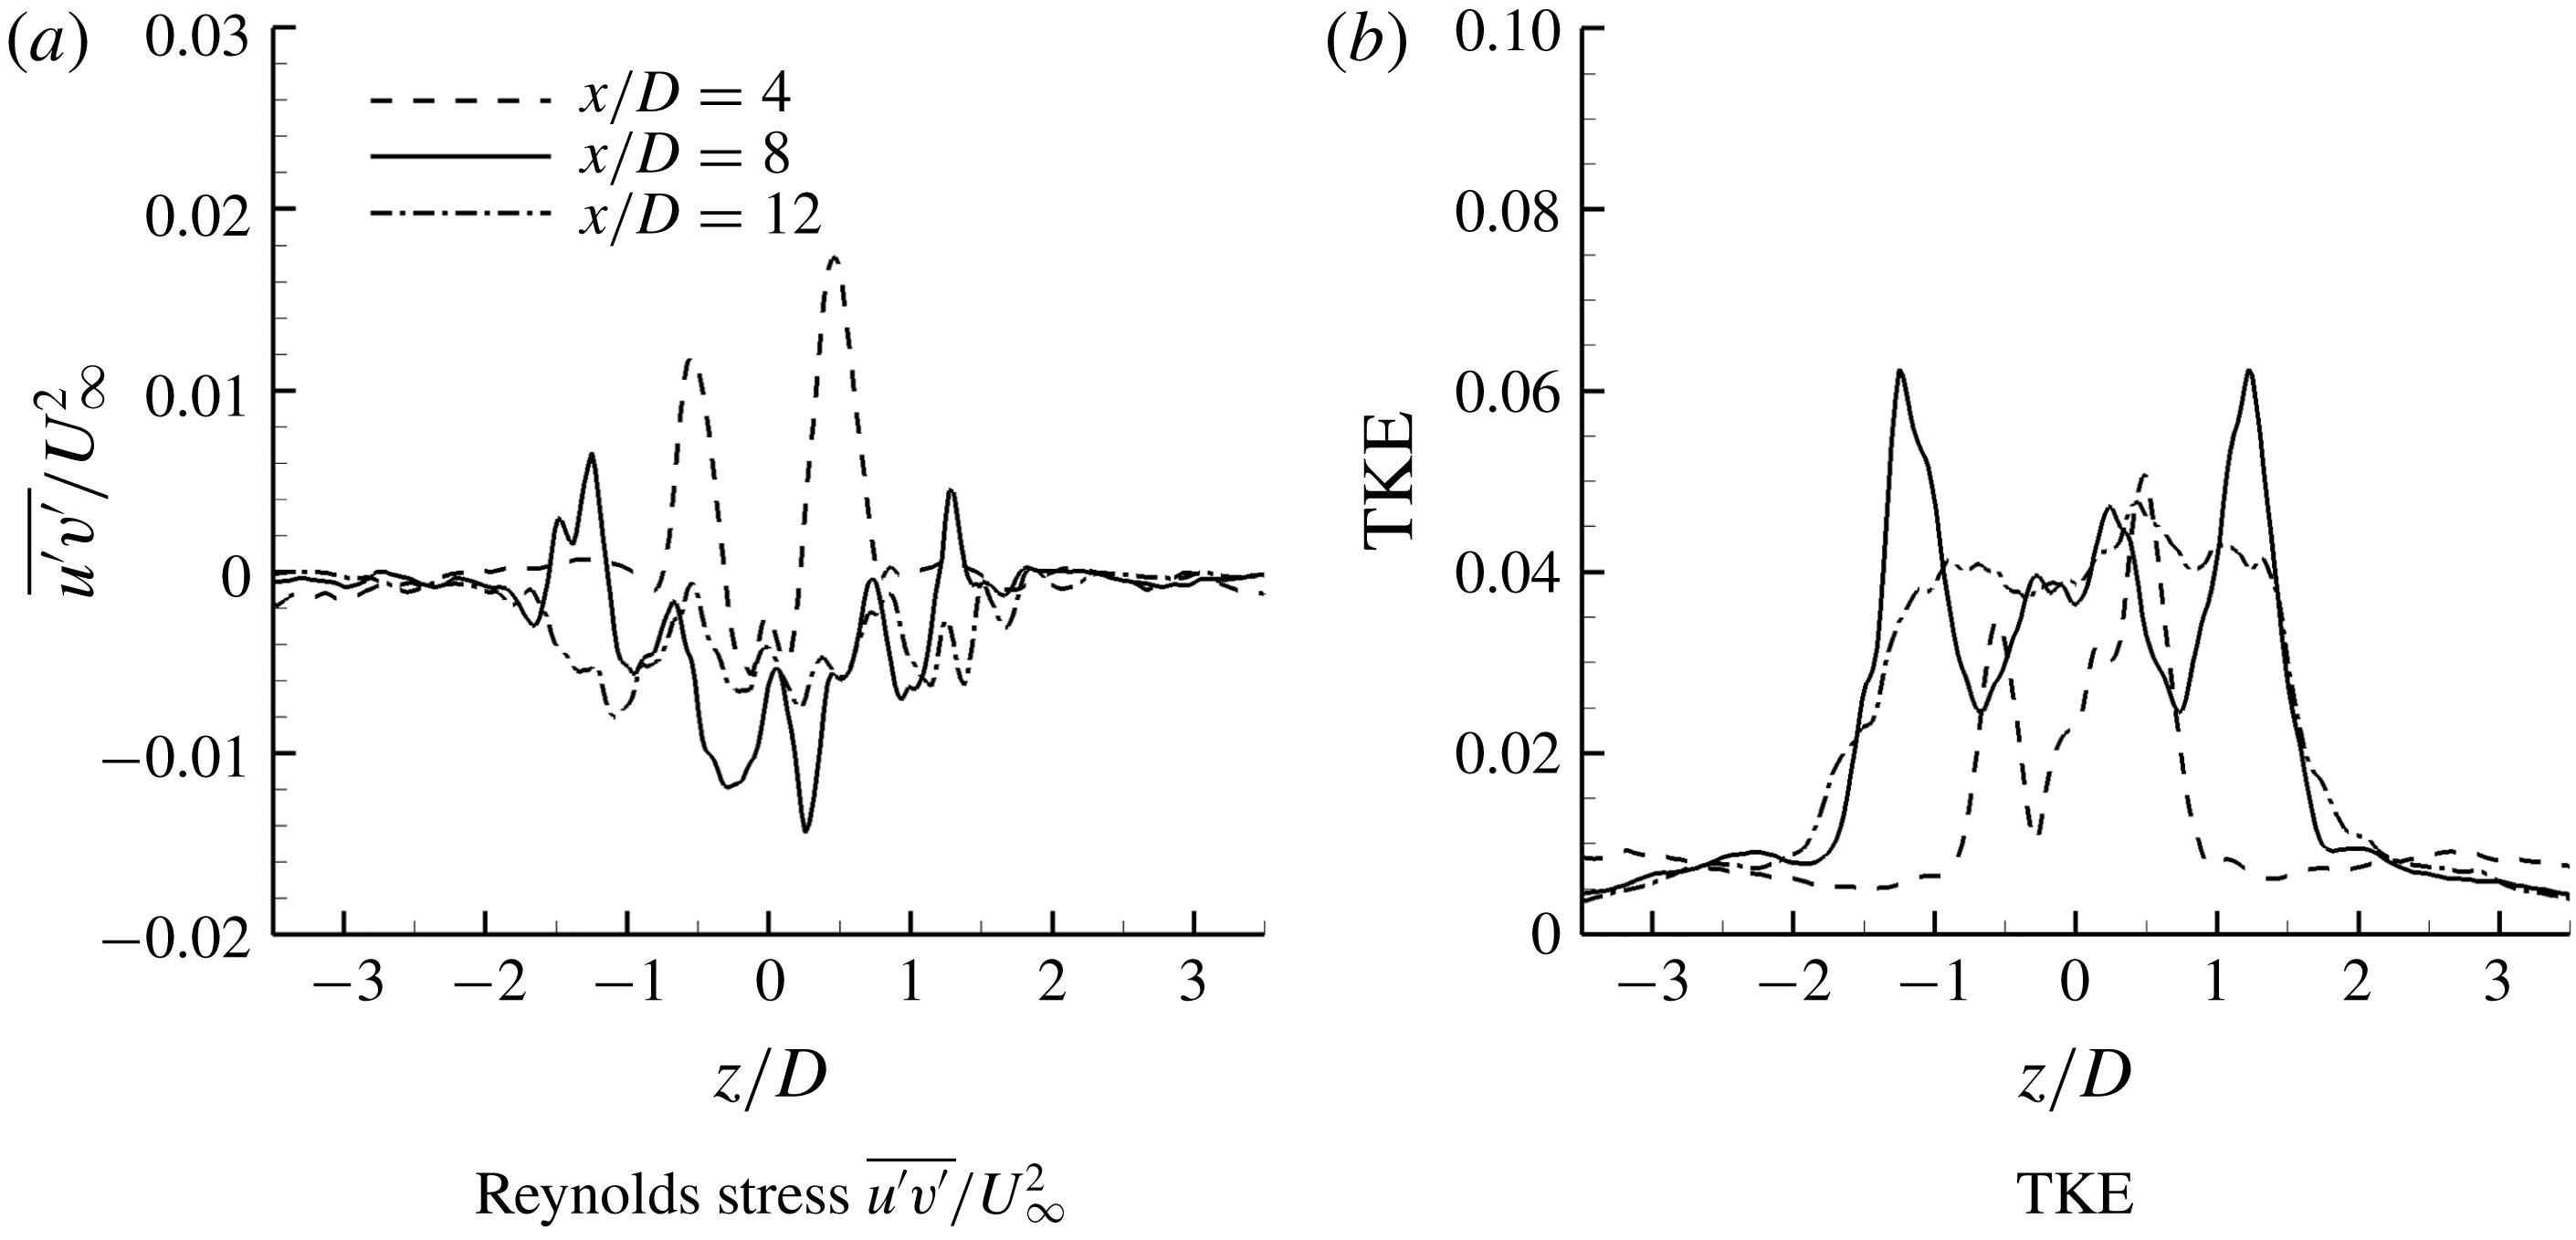
Time-averaged Reynolds stress and turbulent kinetic energy (TKE) contours at various locations are shown in figure 15. The asymmetry in the spanwise direction in Reynolds stress and TKE distribution along the centreline
 $z/D=0.0$
is due to limited averaging time. At
 $y/D=0.4$
,
 $\overline{u^{\prime }v^{\prime }}$
and TKE with high intensity occur in the collision shock (as seen in figure 15
c) region and fade in the reattachment region. Streaky structures with TKE and negative
 $\overline{u^{\prime }v^{\prime }}$
in a high magnitude re-occur in the downstream, which represents the formation of fresh turbulence. Recalling figures 11 and 12, the secondary TCVP are likely to be the main reason. In the far field at
 $10.0<x/D<15.0$
, the levels of
 $\overline{u^{\prime }v^{\prime }}$
and TKE in the wake flow are gradually smeared and the intensity approaches uniform value downstream of
 $x/D=15.0$
. This phenomenon indicates the vanishing of the local coherent structures. The
 $\overline{u^{\prime }v^{\prime }}$
and TKE profiles at
 $y/D=0.4$
are shown in figure 16. It is seen that, in the vicinity of
 $z/D=0.0$
, the
 $\overline{u^{\prime }v^{\prime }}$
and TKE profiles at
 $x/D=8.0$
have an obvious augmentation in magnitude. At
 $x/D=12$
, it is seen that the
 $\overline{u^{\prime }v^{\prime }}$
and TKE profiles have basically recovered in the reattachment region near to the symmetry plane
 $z/D=0.0$
. This corresponds to the contours shown in figure 15(a,b).
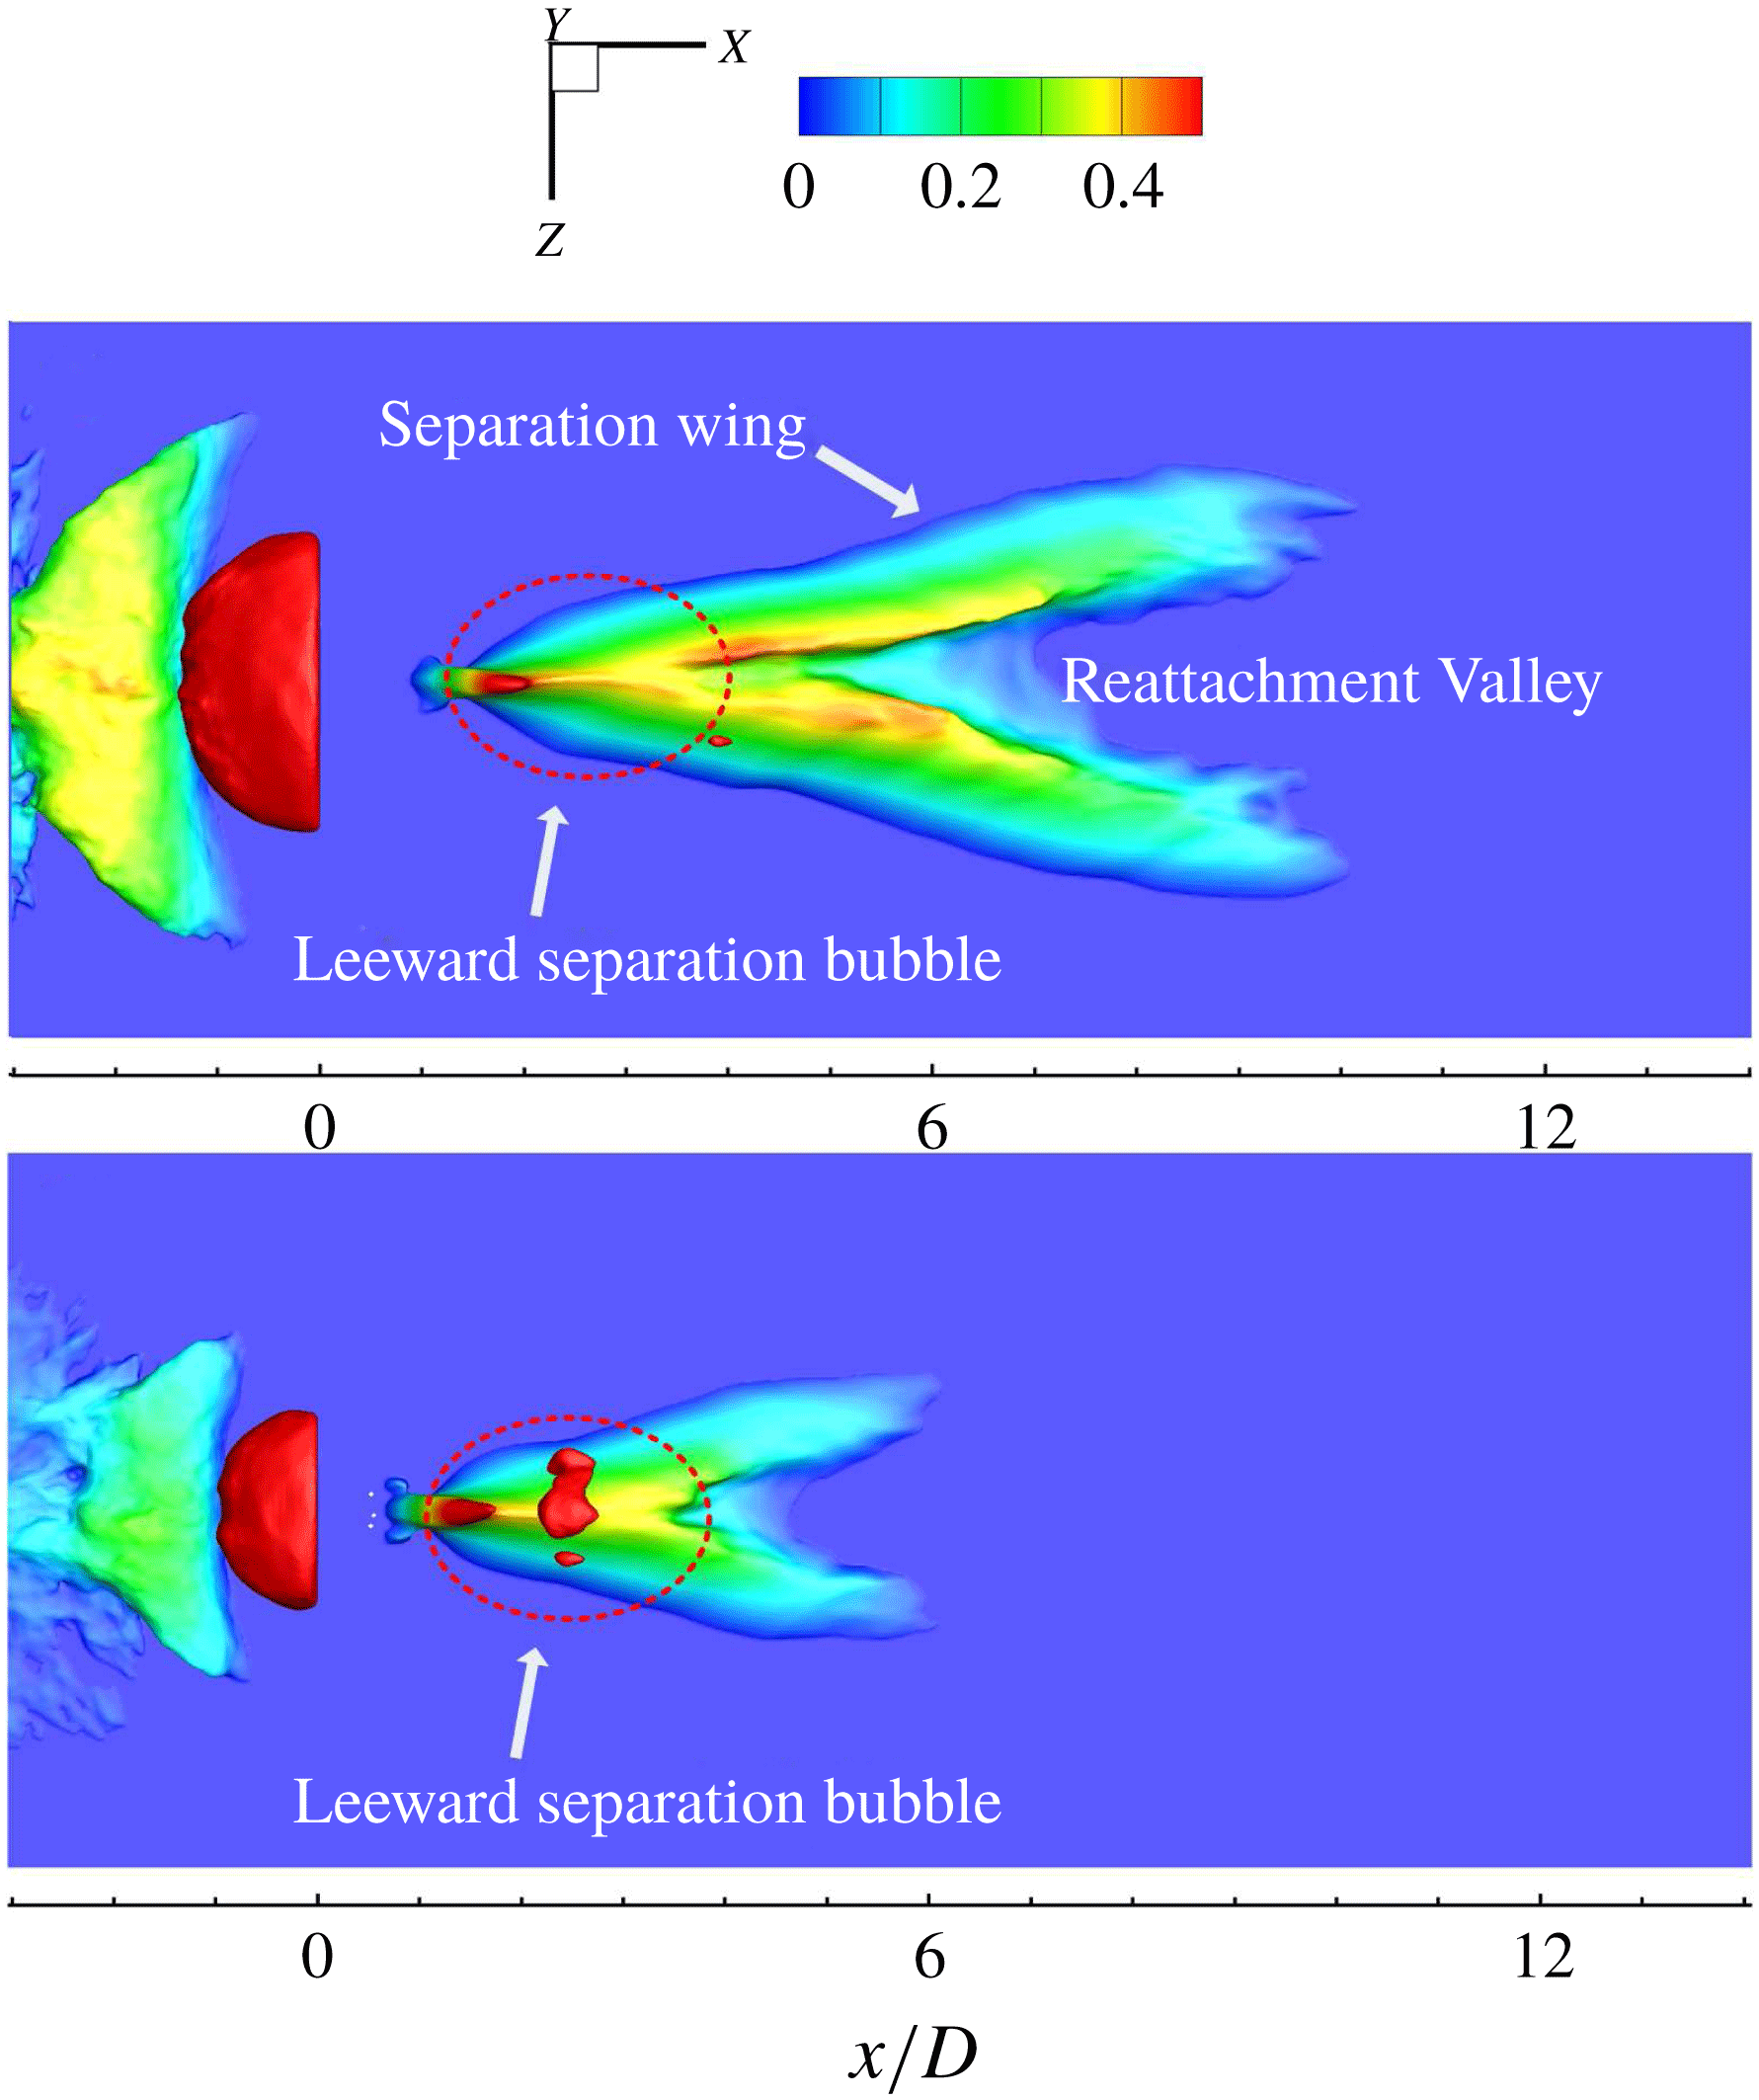
Isosurfaces of the streamwise velocity of the
 $J=5.5$
and
 $J=2.3$
cases are shown in figure 17 to demonstrate the 3D near-wall wake structures, coloured by the local wall-normal distance. The 3D separation bubble looks like a herringbone hill. The jet leeward separation bubble is a whole region and further downstream is split by a reattached flow into two separate separation wings. The peak of the oblique wing corresponds to the edge of the separation zone. The V-shaped valley between the separation wings corresponds to the reattachment region, which has an obvious 3D structure. It is expected that the flow experiences an expansion when going over the top of the separation hills and falls into the V-shaped reattachment valley. Combined with the analysis of 2D streamlines on the
 $y/D=0.2$
plane, as shown in figure 14(b), it is indicated that the reattached flow directly supports the secondary TCVP downstream of the reattachment valley, which is different from the primary TCVP. Results for the
 $J=2.3$
case are shown in figure 17(b) and it is seen that the lower
 $J$
case has a similar character of flow configuration, though the size is smaller than the
 $J=5.5$
case. A careful observation shows that the size of jet leeward separation of the
 $J=2.3$
case almost remains unchanged compared to the
 $J=5.5$
case, while the separation wing is much shorter. This phenomenon further confirms that the collision shock is independent of
 $J$
, which leads to a leeward separation in similar size.
Isosurface of streamwise velocity (
 $u/U_{\infty }=0.0$
) coloured by local wall-normal distance (
 $y/D$
) of (a)
 $J=5.5$
and (b)
 $J=2.3$
cases.

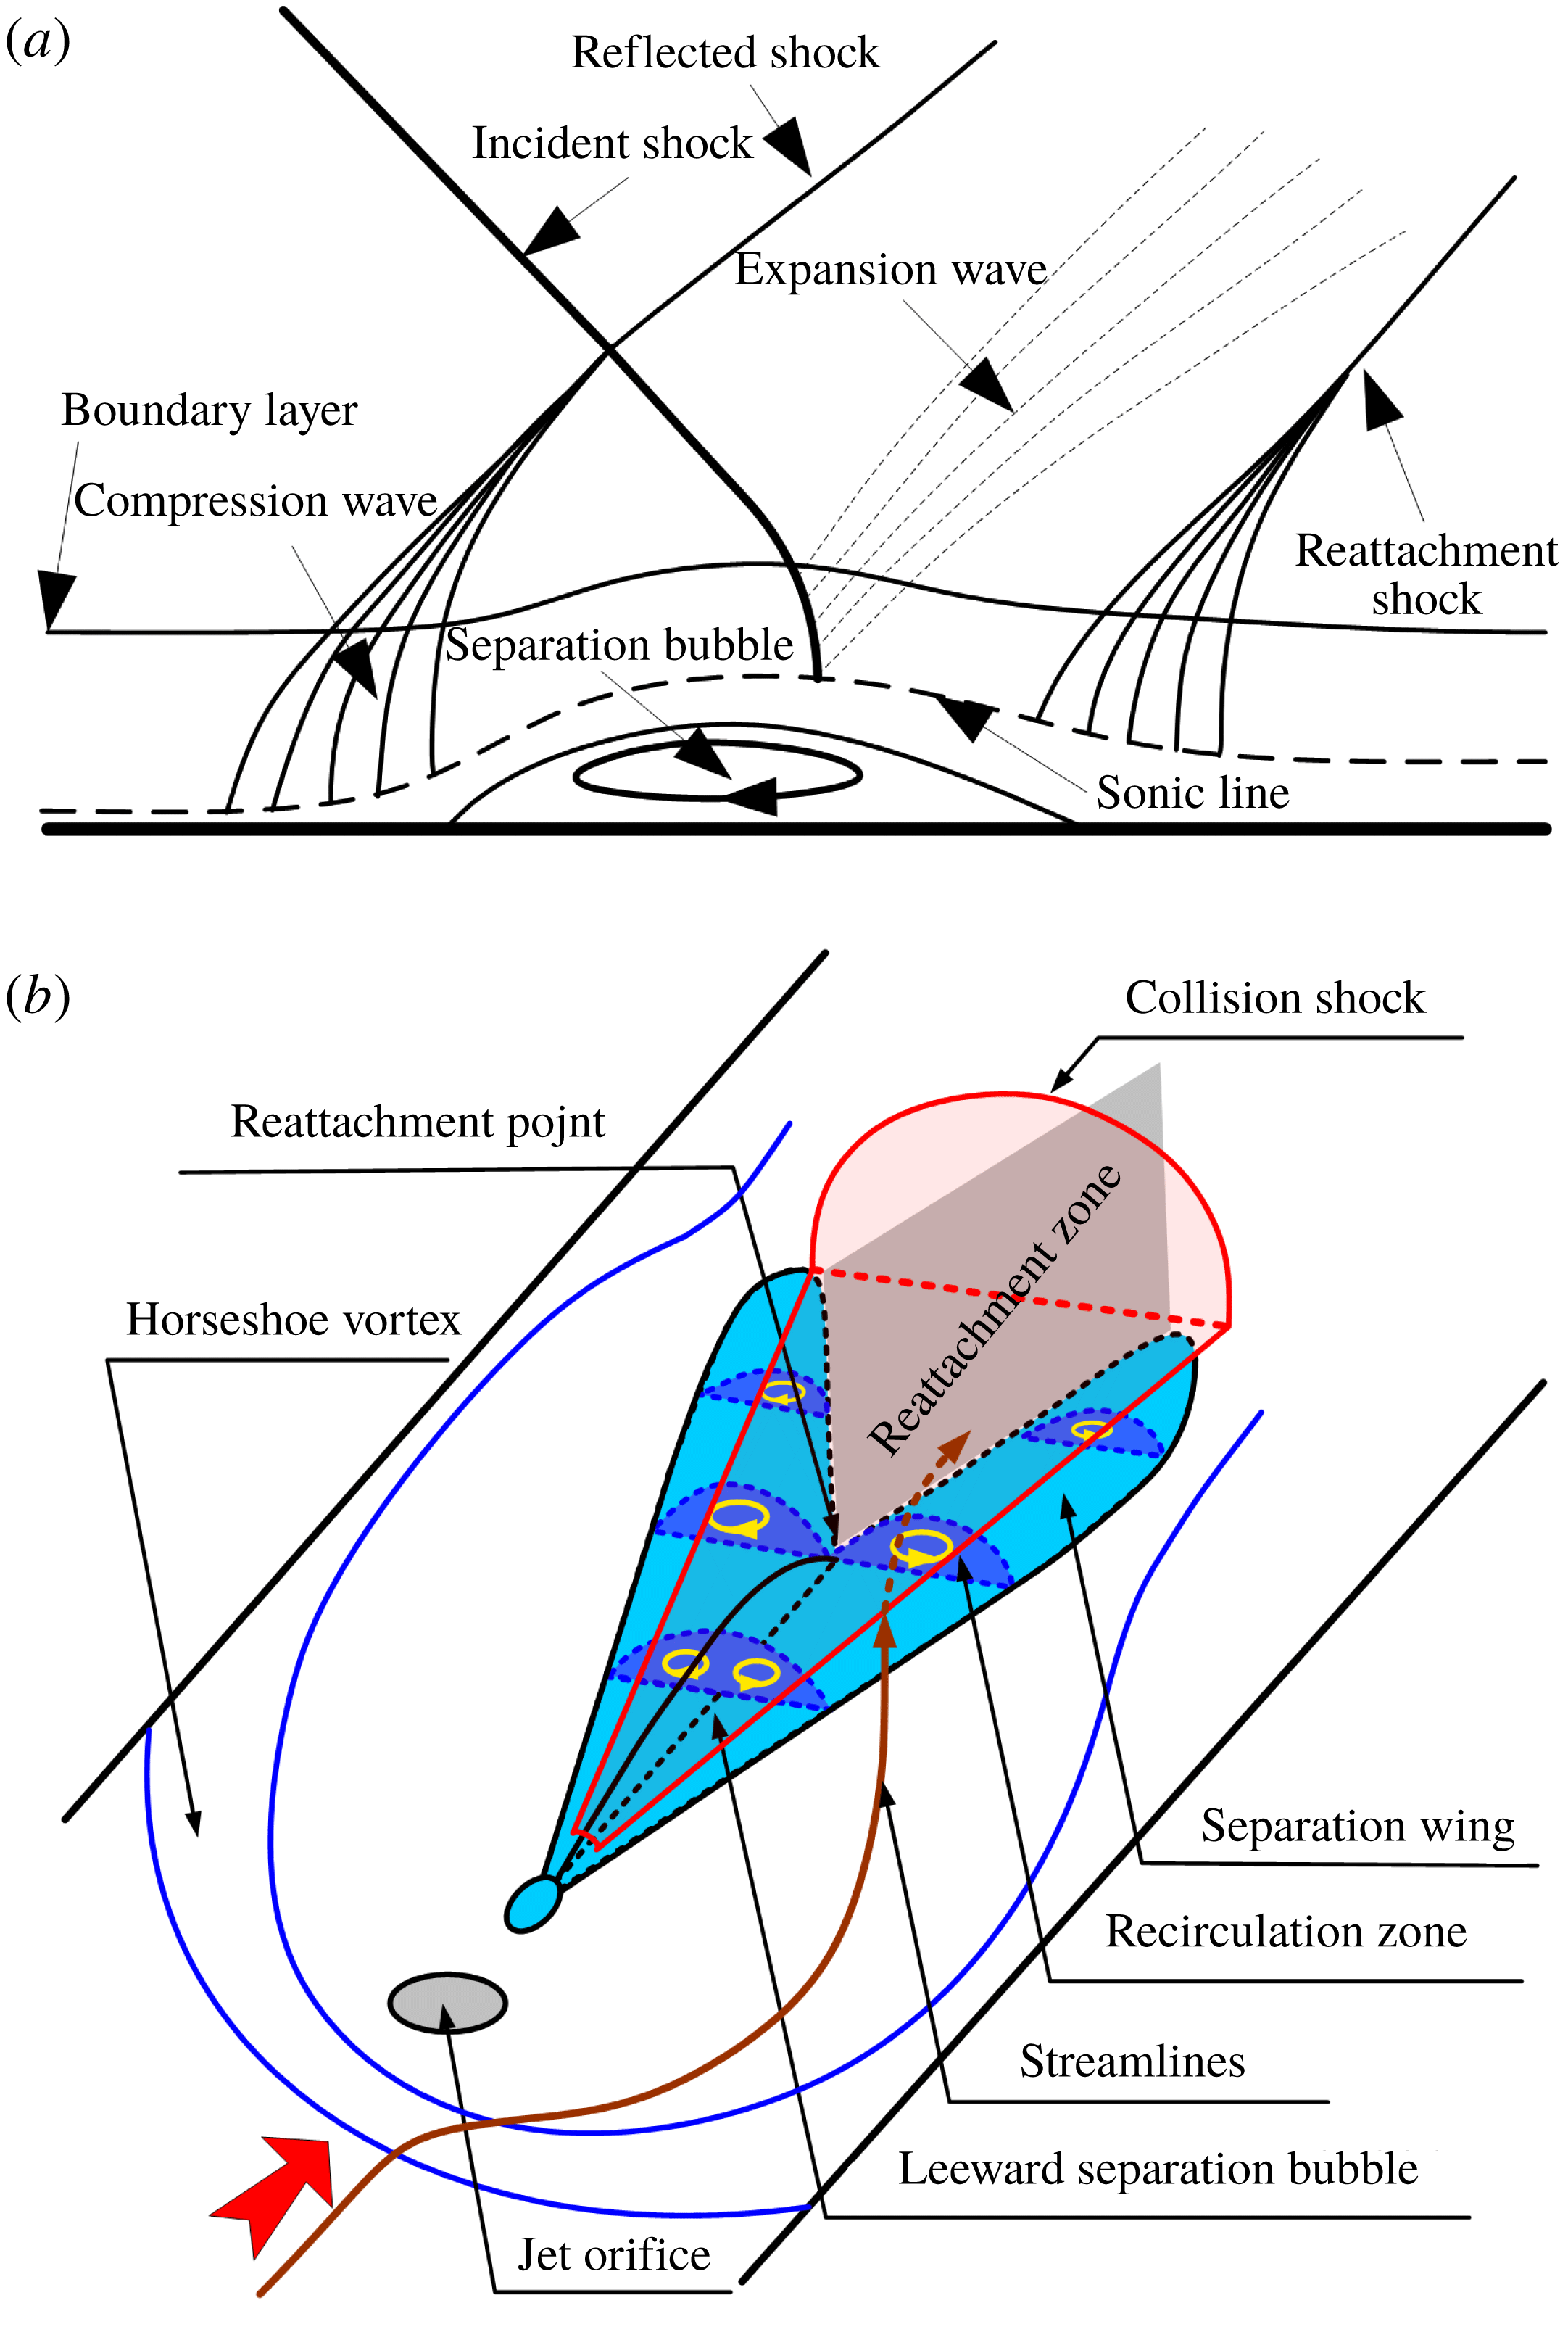
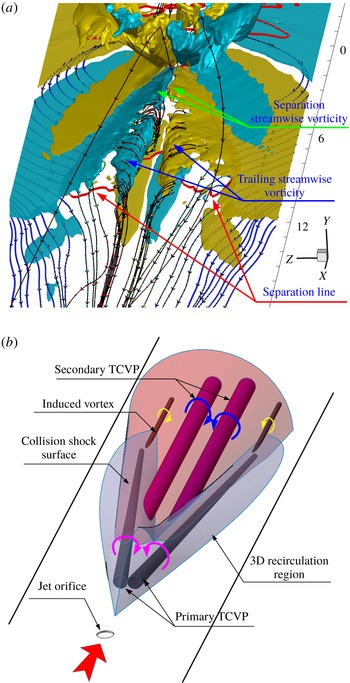
Schematic of herringbone oblique recirculation zones induced by collision shock waves behind the transverse jet injected into a supersonic cross-flow. (a) Classic schematic of an incident oblique shock interacting with a supersonic boundary layer, modified from Gaitonde (Reference Gaitonde2015). (b) Separation induced by collision shocks and primary TCVP on a slice cut from the herringbone recirculation zone.

The schematic of the recirculation zone structures in jet wake flow is illustrated in figure 18. The bow shock ahead of the jet, the horseshoe vortex that wraps around the base of the jet, and the major CVP are well known; thus they are omitted and will not be discussed in detail in this paper. Figure 18(a) shows a classic flow topology of an oblique shock wave interaction with a supersonic boundary layer, which demonstrates that the recirculating flow has an opposite direction to the incoming flow. After the separation bubble peak, expansion occurs and is followed by a reattachment shock. The reattachment shock in figure 10(c,d) and pressure increment in figure 14(a) can be explained by this schematic. Figure 18(b) demonstrates the complex configuration of the collision shock interaction with the lateral supersonic boundary layer. The shock wave surface originates from the collision of the supersonic flow running around the jet barrel, as also shown in figure 1(a) from previous work. It should be mentioned that, since collision shocks have been twisted by the induced separation, shock structures could not be observed as regularly as described in figure 18(b). The collision shock surface is located under the major CVP and oblique shock surfaces are generated along the streamwise direction vertically to the wall. Since the separation bubble is induced in the jet leeward, the flow behind the collision is also blocked by the separation bubble and a shock surface is formed in the wall-normal direction. These shock surfaces merge and form a 3D unified half-cone-like shock surface, as shown in red in figure 18(b).
As shown in figure 18(b), the induced herringbone recirculation extends in the spanwise direction like a foot of the incident collision shock into the incoming lateral supersonic flow. Behind the oblique separation wing, the reattachment domain, coloured grey in the sketch, could be deduced to exist in the V-shaped valley. It is predicted that at least three streams come into the reattachment valley. Two streams are from the flow running around the jet lateral and across the oblique separation wing, and the other one is from flow going through the jet leeward and across the reattachment point. In the next section, 3D streamlines will be given to demonstrate these flow patterns. Figure 18(b) shows the separation and demonstrates the TCVP on slice cuts in the recirculating flow field, which is consistent with the primary TCVP assumption. This means that the primary TCVP occurs in the separation bubble to rotate and recirculate. The secondary TCVP cannot be explained by using figure 18(b). In next section we will use 3D streamlines to analyse the flow topology, especially to discuss the secondary TCVP.
3.3 Flow topology analysis of surface TCVPs
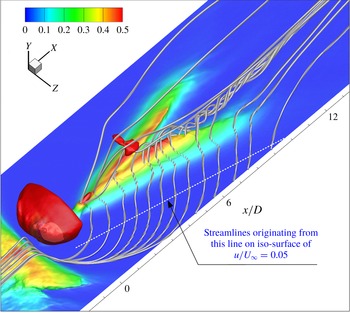
In this section we will show 3D time-averaged streamlines running into the jet wake region and analyse their flow patterns. The key purpose is to unveil the mechanism of formation of surface TCVPs. Figure 19 gives representative streamlines which originate from an oblique line parallel to the separation wing on the isosurface of
 $u/U_{\infty }=0.05$
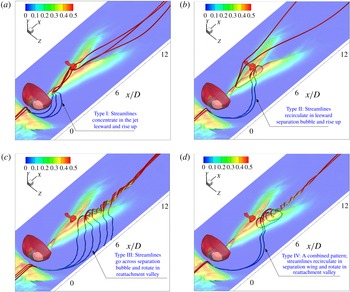
in the jet lateral. These streamlines reflect flow motions in the jet wakes. It is found that different types of flow patterns form in the wake. Some streamlines run around the jet barrel and concentrate in the jet leeward and rise up into the far field. Some streamlines run across the leeward separation bubble, recirculate and converge at the jet leeward. Others run across the separation wing, rotate and move into the downstream region. It is necessary to understand clearly flow motion in the jet wakes, especially the flow topologies corresponding to surface TCVPs.
Figure 20 demonstrates different types of detailed flow patterns separately for clarity. Streamlines are generated in the same way as in figure 19. Figure 20(a) shows the streamlines originating from the supersonic cross-flow converging in the jet lee and going directly downstream, which is denoted as type I pattern. These streamlines rise up in the jet lee following the suction of the major CVP and run into the core of the jet plume in the far field. Analysis shows that these streamlines mainly originate from the supersonic cross-flow in the vicinity of the symmetry plane. Together with figure 14(a,b), it is concluded that the streamlines in the jet lateral region pass the expanded supersonic zone and collide with another supersonic stream from the opposite side, which converges the flow and generates V-shaped collision shock waves. This collision also leads to the generation of the jet leeward separation and further induces the herringbone trailing separation in the boundary layer, as described in figure 18(b).
Flow topology demonstrated by 3D streamlines in the jet wake of
 $J=5.5$
, with isosurface of streamwise velocity (
 $u/U_{\infty }=0.05$
) coloured by local wall-normal distance.

Flow patterns (types I, II, III and IV) demonstrated by streamlines in a jet (
 $J=5.5$
) wake to demonstrate different types of trailing vortices, with transparent isosurface of
 $u/U_{\infty }=0.05$
, coloured by local wall-normal distance. (a) Type I pattern: streamlines concentrate in the jet leeward and rise up following the suction of the CVP. (b) Type II pattern: streamlines recirculate through the leeward separation bubble, concentrate in the jet leeward and rise up. (c) Type III pattern: streamlines run across the separation wing and roll to form a vortex filament. (d) Type IV pattern: streamlines run across the separation wing, go through the separation zone and rotate into the vortex filament shown in type III.

Figure 20(b) demonstrates the type II flow pattern with transparent isosurface of
 $u/U_{\infty }=0.05$
to reveal the flow in the interior of the separation bubble. For this pattern, the streamlines go across the jet leeward separation bubble and cluster in the reattachment valley, and then recirculate following the leeward separation bubble, which acts like a tunnel to let streamlines penetrate. The penetration procedure is very clear, with streamlines coloured by local wall-normal distance. Combining with figure 14(a), it is inferred that streamlines of type II in the vicinity of the reattachment point come into the recirculation and move against the free-stream direction. This recirculating flow along the oblique separation tunnel is just what has been described as the primary TCVP in § 3.2. The streamlines concentrate in the jet leeward and rise up due to the major CVP. Type II streamlines rotate when penetrating the recirculation zone. This is due to the rotation character of the recirculating flow in the spanwise direction, which has been well described in figure 18(a).
Figure 20(c) demonstrates the type III flow pattern. This pattern is believed to explain well the secondary surface TCVP shown in figure 11(b,c). For type III, the jet lateral flow is supersonic ahead of the separation line and the herringbone separation wing acts as a micro-ramp vortex generator. Those streamlines go over the separation-wing bubble or separation hill and rotate to form a swirling flow and roll into a concentrated vortex filament, to form the secondary TCVP. This procedure can be displayed only in a 3D wake configuration with 3D streamlines. From the analysis given in § 3.2, it is known that the secondary TCVP is located in the reattachment valley with a positive velocity. This flow pattern is definitely different from type II streamlines, which are mainly located in the separation zone with a negative streamwise velocity. In the separation wing, there is a combined flow pattern which has the partial character of types II and III, denoted as type IV. For this pattern, streamlines go over the wing, run into the reattachment valley and recirculate through the separation wing interior downstream of the reattachment point. Further, these streamlines penetrate out of the separation wing and follow the secondary surface TCVP to move downstream. Type IV has the recirculating character of type II and rotating character of type III. A comparison between figures 10 and 16 indicates that the primary TCVP shown in figure 11(a) mainly corresponds to the type II flow pattern. For figure 11(b), the existence of the separation wing on slices indicates a combined pattern of types III and IV. For figure 11(c), there is no separation and the secondary TCVP comes from the combined effects of types III and IV.
The main difference between types III and II is that type III streamlines go over the separation bubble and directly run into the reattachment valley, which means that the streamlines mainly move outside of the separation region. Streamlines of type II penetrate into the leeward separation bubble and rotate following the swirling vortex in the recirculation region. Streamlines in types III and IV rotate in the reattachment valley outside of the separation and further lose swirling strength downstream of the reattachment valley due to the disappearance of herringbone separation and local dissipation, which corresponds to the termination of the secondary surface TCVP. Decay of the TCVP strength in the far field can also be deduced from vortex dynamics since the two counter-rotating vortices in the TCVP induce each other and they lift off the surface as a result of upwash.
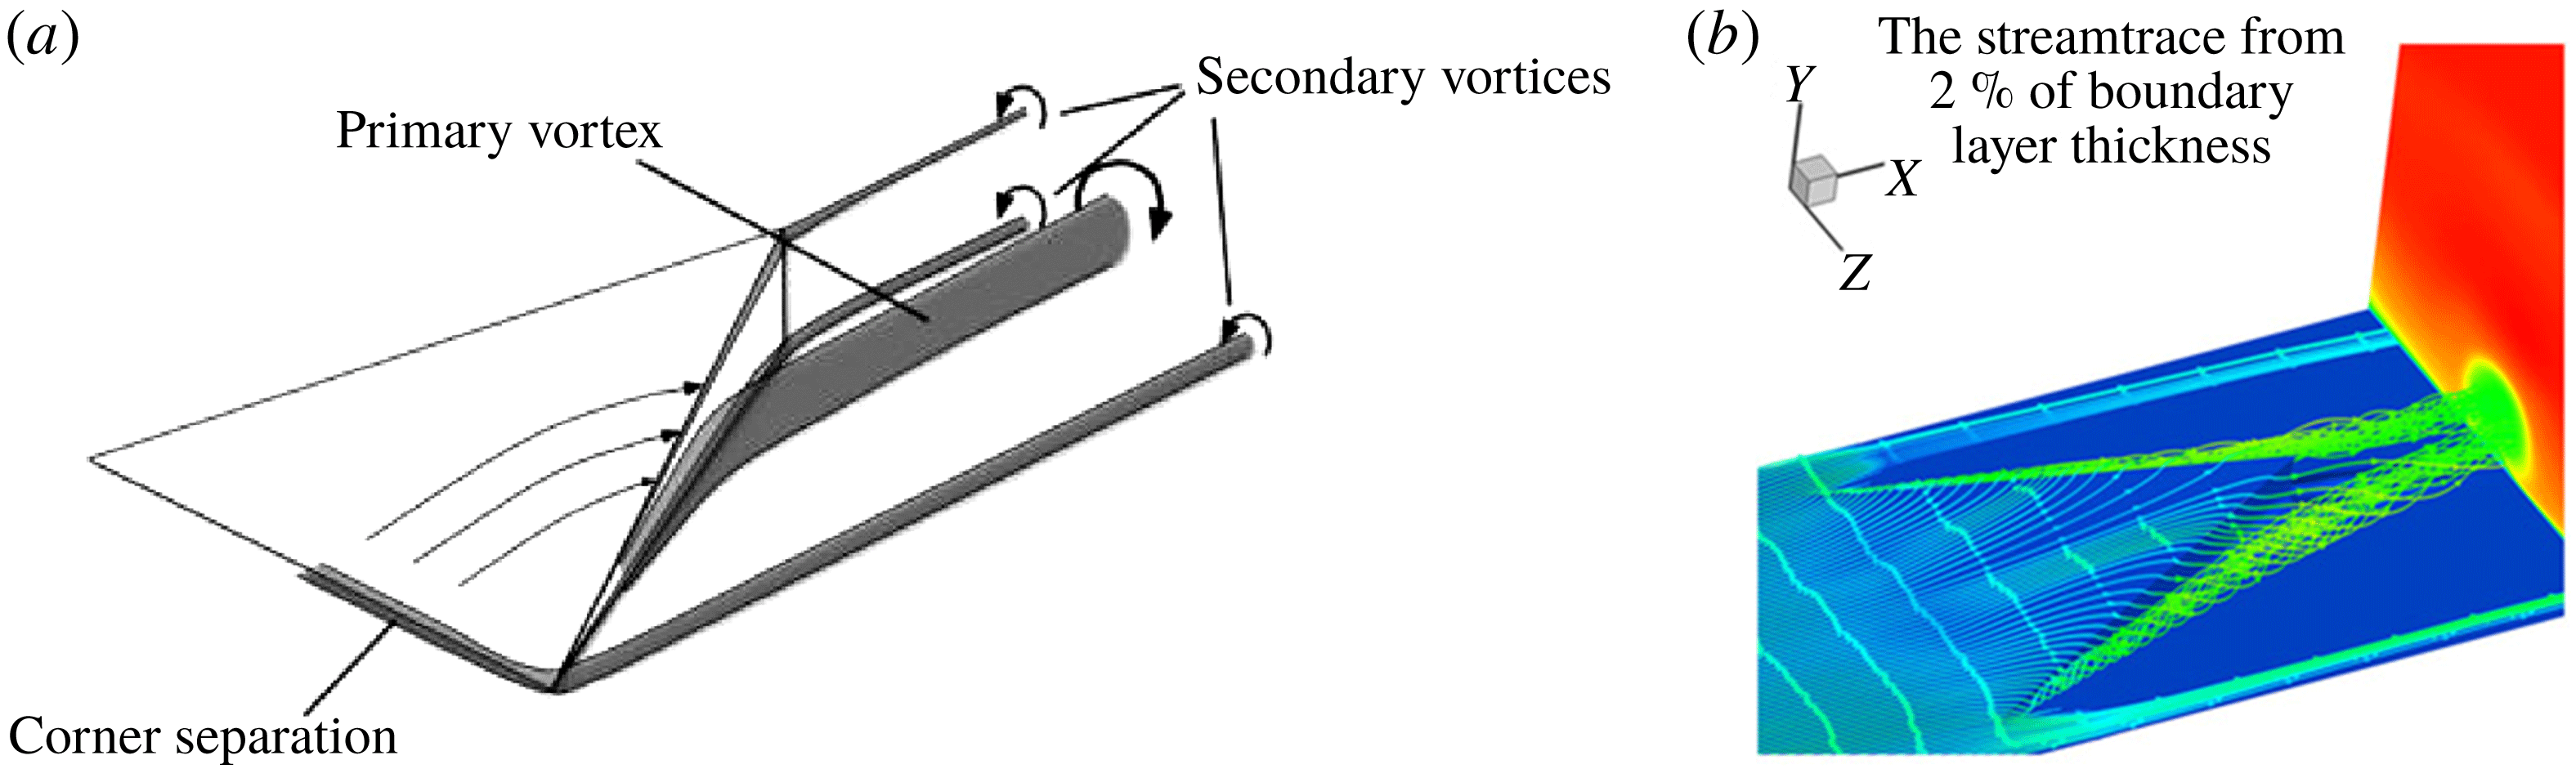
The main features of the micro-ramp wake region are presented in figure 21 to demonstrate the formation of the secondary TCVP. Babinsky, Li & Ford (Reference Babinsky, Li and Ford2009) presented a schematic (reproduced here in figure 21 a) to show that a primary pair of counter-rotating vortices rolls up gradually and is strengthened on the two sides of the micro-ramp, which finally converge near the trailing edge of the ramp. Wang et al. (Reference Wang, Liu, Sun and Zhao2015a ) traced the streamlines and found that streamlines in the inner boundary layer were engulfed into the primary vortex core (shown here in figure 21 b) and streamlines in the outer layer simply pass over the ramp. The jet lateral flow shown in figure 20(c) near the wall passes the separation-wing bubble, where an upwind ramp plays the same role as a micro-ramp in the boundary layer. The formation of the primary vortex in micro-ramp flow is the same as the secondary surface TCVP in jet wake flow. As many previous works in the literature have discussed the mechanism of micro-ramp flow, detailed analysis is omitted here for brevity.
Micro-ramp flow features in a supersonic boundary layer. (a) Sketch of vortices generated around micro-ramp – one side only for clarity (from Babinsky et al. Reference Babinsky, Li and Ford2009). (b) Streamlines passing around the micro-ramp, originating from the supersonic stream at wall-parallel plane with 2 % of boundary-layer thickness (from Wang et al. Reference Wang, Liu, Sun and Zhao2015a ).

Flow topology (types II, III and IV) demonstrated by streamlines in the jet wake with transparent isosurface of
 $u/U_{\infty }=0.0$
coloured by local pressure of
 $J=5.5$
case.

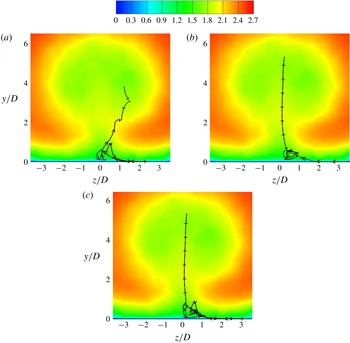
Front view of typical streamlines of types II, III and IV in the jet wake with a Mach number slice at
 $x/D=40$
to demonstrate TCVPs of
 $J=5.5$
. (a) Type II showing primary TCVP. (b) Type III showing secondary TCVP. (c) Type IV showing a combined character of primary and secondary TCVP.

Streamlines passing the separation bubble (from an oblique back view), originating from the lateral side on isosurfaces of
 $u/U_{\infty }=0.05$
and
 $u/U_{\infty }=0.5$
. (a) Isosurface of
 $u/U=0.05$
, type III flow. (b) Isosurface of
 $u/U=0.05$
, type II flow. (c) Isosurface of
 $u/U=0.5$
, type III flow. (d) Isosurface of
 $u/U=0.5$
, type II flow.

Isosurface of streamwise vorticity and schematic of vortex tubes (primary and secondary surface TCVPs) in jet wakes. (a) Isosurface of streamwise vorticity
 $x=-5$
and 5, non-dimensionalized by free-stream velocity and jet orifice diameter. (b) Schematic of vortex tubes (primary and secondary TCVPs) in jet wake.

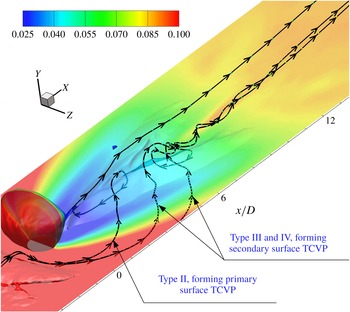
It is inferred that local pressure difference plays a dominant role in the flow recirculation or rotation. Figure 22 demonstrates the pressure contour on the isosurface of
 $u/U_{\infty }=0.0$
with representative streamlines of types II, III and IV. In the jet lee, a bow low-pressure region exists due to the blockage and expansion effects from the jet barrel. The pressure recovers at the reattachment valley. Together with figure 14(a), it is indicated that streamlines from the jet lateral region that run into the reattachment valley would increase the local pressure to a higher level over the surrounding area. The high-pressure flow in the reattachment region pushes the streamlines into the herringbone recirculation region. Type II streamlines go across the separation bubble and are pushed into the jet leeward recirculation zone. The streamlines recirculate and rotate into the jet lee. Type IV streamlines are also pushed by the high pressure of the reattachment region into the oblique separation wing. Streamlines of type III go over the separation wing and directly acquire angular momentum by the blockage of high pressure in the reattachment valley. These streamlines swirl downstream of the herringbone zone and would not roll into any recirculation region. Figure 23 gives the front view of these three streamlines. Compared to figure 11, type II streamlines represent the rotation of the primary TCVP, while type III streamlines represent the rotation of the secondary TCVP. The streamlines on slices in figure 11 are the projection of the 3D streamlines. A type II streamline rotates as well as recirculates in the jet leeward separation bubble. A type IV streamline recirculates in the separation wing first and then follows the secondary TCVP to move. The analysis further validates the conclusion that the primary TCVP and secondary TCVP are different patterns in the jet wake flow.
Figure 24 shows a cluster of streamlines which originate from an oblique line parallel to the separation wing on the isosurface of
 $u/U_{\infty }=0.05$
and 0.5 from the jet lateral side. It is found that streamlines with different patterns are driven by flow and move into different regions. Streamlines in figure 24(a) demonstrate the secondary TCVP structure and in figure 24(b) demonstrate the primary TCVP. It is interesting to see that on the wingtip of the separation bubble, a new shedding vortex is induced and streamlines rotate from the wingtip and the swirling strength fades some distance downstream. In figure 24(c,d) with streamlines originating from the isosurface of
 $u/U_{\infty }=0.5$
, both type II and III flow patterns are found. The main difference of figure 24(c) from figure 24(a) is that the acquired rotation magnitude decays earlier, which indicates that the separation ramp mainly collects the low-momentum streamlines from the inner boundary layer, acting in the same way as the micro-ramp described by Wang et al. (Reference Wang, Liu, Sun and Zhao2015a
). For figure 24(d), the streamlines cover a larger area in the separation wing than figure 24(b), which means that cross-flow in the outer boundary layer enters into the bottom of the separation bubble in type II pattern. In figure 24(d) it is found that some streamlines go over the separation bubble, run into the reattachment valley and move into the far field directly, which corresponds to the prediction in § 3.2. This also reflects that the flow running into the reattachment valley has different origins at different wall-normal locations.
To clearly demonstrate the surface TCVPs, an isosurface of streamwise vorticity is shown in figure 25(a) for the
 $J=5.5$
case. Arrows with solid line point to the primary and secondary surface TCVPs. It is identified that the surface TCVPs are located near the wall. It is seen that the surface TCVPs have an opposite rotating direction to the major CVP. The primary TCVP in the leeward separation zone has the same rotation direction with the secondary TCVP in reattachment zone. This is why usually it is not easy to distinguish them if 3D streamlines are not given. A separation line is imposed at
 $y/D=0.0$
slice to identify the separation zone. It is shown that the secondary TCVP is separate from the primary TCVP in the jet lee, especially in the separation wing. It is therefore concluded that the primary TCVP is a single CVP which occurs in the herringbone recirculation and has no direct relation with the secondary TCVP.
Figure 25(b) shows a schematic of vortex tubes in the near-wall wake to demonstrate the primary TCVP and secondary TCVP. It is seen that the primary TCVP is formed in the herringbone recirculation, including jet leeward separation bubble and the oblique separation wing. A secondary TCVP is formed on the ramp leeward of the separation bubble adjacent to the reattachment valley. The separation bubble serves as a micro-ramp vortex generator, which is well analysed in a previous study Wang et al. (Reference Wang, Liu, Sun and Zhao2015a ). The inner boundary-layer flow would roll and form the vortex tubes in the downstream field which corresponds to the secondary TCVP.
Based on the numerical results and the analysis, it is concluded that the flow in the jet wake has very complex 3D structures, including the collision shock, herringbone separation, reattachment valley and two different TCVPs which are generated by different mechanisms in the near-wall jet wake.
4 Conclusions
In the present study, direct numerical simulations are conducted to uncover physical aspects of a transverse air jet injected into a supersonic air cross-flow at a Mach number of 2.7. Simulations are carried out for two different jet-to-cross-flow momentum flux ratios (
 $J$
) of 2.3 and 5.5. The simulations provide the instantaneous and time-averaged flow features around the transverse jet in the supersonic boundary layer. The results are as follows.
(1) The collision shock waves, the reattached shock waves and the major CVP and TCVP behind the jet are well captured. The collision shock waves induce a herringbone trailing separation region in the near-wall jet wakes. Analysis of velocity profiles along the streamwise direction and streamlines on wall-parallel planes indicate the existence of flow reattachment and multiple TCVPs in the near-wall jet wakes.
(2) Isosurfaces of the streamwise velocity demonstrate that a reattachment valley exists in the herringbone recirculation zone near the symmetry plane. Flow in the separation region recirculates against the free-stream direction, and forms the primary pair of counter-rotating vortices in the spanwise direction. The herringbone separation zone disappears in the far field due to the interaction of the lateral supersonic flow around the jet and the reattached expansion flow in the reattachment valley.
(3) Streamlines running across the reattachment valley in the jet wake exhibit four types of flow patterns. For type I, streamlines go around the jet barrel, converge in the jet lee and rise up following the suction by the major CVP. For type II, streamlines go over the separation into the reattachment valley and concentrate in the vicinity upstream of the reattachment point. Furthermore, these streamlines recirculate and rotate following the oblique separation wing which acts as a tunnel that streamlines penetrate and swirl in. This recirculating flow corresponds to the primary surface TCVP. The recirculated streamlines concentrate in the jet lee and rise up due to the major CVP. For type III, the wing of the herringbone recirculation acts as a micro-ramp vortex generator, and streamlines run across the separation wing and rotate to form a swirling vortex filament further downstream. This swirling flow corresponds to the secondary TCVP, which is different from the primary TCVP formed in type II pattern. For type IV, streamlines go across the separation wing, are pushed by the reattachment compression and recirculate through the oblique separation wing. Furthermore, these streamlines run into the reattachment valley again and follow the secondary TCVP to move downstream. Streamlines of types III and IV rotate and lose swirling strength downstream of the reattachment valley due to the vanishing of the herringbone separation and the local dissipation, which corresponds to the termination of the secondary TCVP.
(4) Based on the numerical results, a 3D schematic of flow features in the jet wake is presented to explain surface TCVP formations. The primary TCVP is formed in the herringbone recirculation zone, while the secondary TCVP is formed in the reattachment valley and the separation bubble serves as a micro-ramp vortex generator.
Acknowledgements
This work is funded by the National Science Foundation of China (grants 11472305 and 11522222) and Outstanding Youth Fund of the National University of Defense Technology. Our sincere thanks go to Professor N. D. Sandham of the University of Southampton for providing the SBLI (shock/boundary-layer interaction) DNS (direct numerical simulation) code and helpful discussion on data analysis. Supercomputer time provided by the UK Engineering and Physical Sciences Research Council under the project ‘Thermal and Reactive Flow Simulation on High-End Computers’ (grant no. EP/J016381/1) is gratefully acknowledged. Data supporting this study are openly available from the University of Southampton repository at https://doi.org/10.5258/SOTON/D0531.