Introduction
In recent decades, different societies have faced emerging and reemerging infectious diseases. 1 The Spanish flu of 1918-1920 became known as the “mother of all pandemics.” One of the characteristics of this pandemic was the death rate several times higher than the seasonal flu and the unusual peak of deaths in young people. Respiratory epidemics occur in waves every once in a while.Reference Dahal, Mizumoto and Bolin 2 Zoonotic diseases are infectious diseases that are transmitted from vertebrate mammals to humans and vice versa. The cause of transmission of pathogenic agents are bacteria, parasites, and viruses. Among these diseases, we can mention Ebola, SARS, and bird flu, which generally lead to fever, respiratory problems, and, in severe cases, death.Reference Can, D’Cruze and Macdonald 3 Epidemics like COVID-19, Ebola, SARS, and MERS have occurred at various rates and led to an increase in the capacity of hospitals.Reference Kapata, Ihekweazu and Ntoumi 4 A large number of patients with symptoms such as dry cough, respiratory distress, and severe types of the disease must be referred to hospitals.Reference Liao, Wang and Kang 5
Preparedness of hospitals means having the capacity and the possibility of increasing the space and staff of the hospital. Meeting the conditions and being ready to receive respiratory patients in epidemics is necessary for hospitals in many regions. Quick response, risk assessment, and risk management are some basic principles in this regard, and decision-makers and policymakers need to consider these principles.Reference Barbisch and Koenig 6 , Reference Petrosillo, Puro and Di Caro 7 Planning for hospital preparedness before and during such events is of great importance. Despite the recommendations regarding preparedness, hospitals face challenges such as insufficient staff and facilities and overcrowding.Reference Misro, Kanagalingam and Theivacumar 8 , Reference Kerlin, Costa and Davis 9
In “A Multiple Criteria Decision-Making Approach for Increasing the Preparedness Level of Sales Departments Against Pandemics related to respiratory diseases: A Real-World Case,” a combination of AHP and TOPSIS models was used. The model consisted of eight criteria, 29 sub-criteria, and seven alternatives. AHP was used to calculate the weight of criteria and sub-criteria, and TOPSIS was used to calculate the preparedness level, rank the companies, and determine the weaknesses that need to be considered in the current market scenario to improve their effectiveness.
In “Evaluation of Influenza Intervention Strategies in Turkey with Fuzzy AHP-VIKOR,” AHP determined the weight of the factors, and VIKOR ranked the strategies based on the criteria. Respondents in Turkey included an infectious disease specialist, an internal medicine specialist, an ENT specialist, a family physician, and a cardiologist.
The study titled “Evaluation of the Pandemics related to respiratory diseases Intervention Strategies with Hesitant F-AHP” was conducted aiming to help decision-makers, especially politicians, government authorities, and doctors. The AHP method was used to compare the intervention strategies introduced by different countries for dealing with respiratory disease pandemics. Seven physicians with different specialties identified 15 interventions.
The WHO has published a checklist for evaluating the preparedness and capacity of health services during respiratory disease pandemics. 10 In this study, we used this checklist, and due to the local conditions, we investigated referral hospitals in Kerman, Iran, to localize the study of these issues.
Methodology
Study Area
Kerman Province, with the city of Kerman as its capital, is the largest province in Iran. This province is located in the southeast of Iran, with a population of 2,938,988. Kerman province has an area of 180,726 km2, accounting for 11% of Iran’s land.Reference Zanjani and Nejatian 11
The hospitals in this province include private, governmental, and social security hospitals; five educational hospitals have been selected as coronavirus referral hospitals. These hospitals are located in five cities that have universities of medical sciences. The hospitals include:
-
1. Afzalipour Hospital in the city of Kerman
-
2. Pasteur Hospital in Bam
-
3. Imam Khomeini Hospital in Jiroft
-
4. Imam Reza Hospital in Sirjan
-
5. Ali Ebn Abi Taleb Hospital in Rafsanjan
Study Procedures
This study investigated the preparedness of the hospitals mentioned above for dealing with respiratory disease pandemics.
First, the primary indicators were set using the hospital preparedness checklist published by the WHO; afterward, due to the local and regional conditions, the items were complemented by a literature review, and finally, experts’ opinions were used to supplement them. Therefore, the factors affecting hospital readiness are summarized in Table 1.
Effective factors in hospital readiness

Table 1. Long description
The table contains fifteen rows, each listing a specific factor for hospital readiness. From top to bottom, the factors are:
* Forming a proper management team
* Predicting trends of disease
* Waste management
* Critical management training
* Existence of transparent protocols and instructions
* Process reforms
* Manage deaths
* Ventilation of sections
* Manage overcrowding
* Beginning of the students’ academic year
* Legal section and contracts
* Environmental disinfection
* Existence of an organizational chart to deal with C O V I D 19
* Existence of security to ensure the security of the hospital
* Existence of supporter plans
Experts’ opinion collection was conducted as follows:
1. Due to the drawbacks of the standard or traditional Delphi method, the fuzzy Delphi method was used to include all experts’ judgments and consider their preferred judgments more appropriately. Kaufmann and Gupta first introduced the fuzzy Delphi method in 1988. This method tries to combine the traditional Delphi method and the concepts of fuzzy theory.Reference Arnold Kaufmann 12 The fuzzy Delphi method (FDM) is used to arrive at a group decisions to solve the ambiguity of experts’ opinions to improve the efficiency and quality of questionnaires. Therefore, the number of interviews and the time needed for the study are decreased, and a comprehensive understanding of experts’ knowledge is obtained.Reference Lee, Wu and Tseng 13 The steps in the Delphi method are as follows:
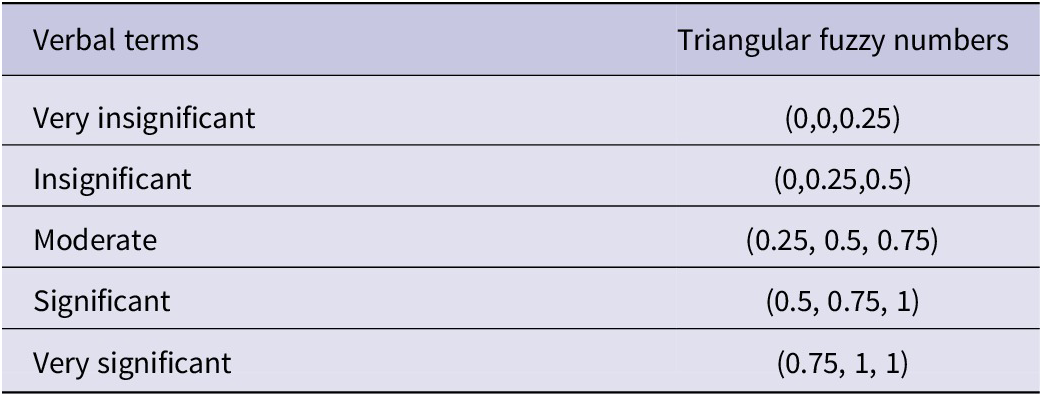
Step 1: Different criteria related to the area under examination were identified and tabulated in this step. Step 2: The criteria were presented to the experts in the form of questionnaires. Step 3: After converting verbal expressions into triangular fuzzy numbers.Reference Chang, Hsu and Chang 14 The third step is based on the fuzzy numbers shown in Table 2.
Verbal terms for criteria

Table 2. Long description
The table consists of two columns titled Verbal terms and Triangular fuzzy numbers.
* Row 1: Very insignificant corresponds to the set 0, 0.25, 0.
* Row 2: Insignificant corresponds to the set 0, 0.25, 0.5.
* Row 3: Moderate corresponds to the set 0.25, 0.5, 0.75.
* Row 4: Significant corresponds to the set 0.5, 0.75, 1.
* Row 5: Very significant corresponds to the set 0.75, 1, 1.
According to the table above, since the opinions on the factors influential on hospital preparedness were obtained from 5 centers, these opinions needed to be aggregated and integrated. To this end, each verbal variable was considered a fuzzy number
$ {\tilde{P}}_j=\left({p}_j,{q}_j,{r}_j\right) $
 , and the relations used for aggregation were as follows.


Step 4: After the aggregation of the opinions, the results for each factor affecting hospital preparedness were defuzzified using the following equations.

Step 5: The maximum value achieved from the 3 defuzzification methods was selected as the definite value of the aggregated opinions. All defuzzified variables with a value of less than 0.7 were omitted; therefore, the number of factors affecting hospital preparedness decreased.
AHP was first introduced by Thomas L. Saaty in 1980.Reference Saaty and Vargas 15 This method is a multi-criteria decision making (MCDM) method. MCDMs are decision-making methods used in complex problems with several criteria and different stakeholders.Reference Kou, Peng and Wang 16 , Reference Durán 17 AHP includes goal, criteria, sub-criteria, and alternatives, and in this method, experts perform pairwise comparisons.Reference Li, Zhang and Dong 18 AHP includes four steps of modeling, (e)valuation, prioritizing, and synthesis, among which prioritizing and synthesis are more important.Reference Lin and Kou 19
The steps of AHP are as follows:
Step 1: Creating a hierarchized structure: The first thing to do in this stage is to determine the primary goal, which is the problem being examined. Then, decision-making criteria are determined; these criteria are placed in different hierarchical levels based on their importance.
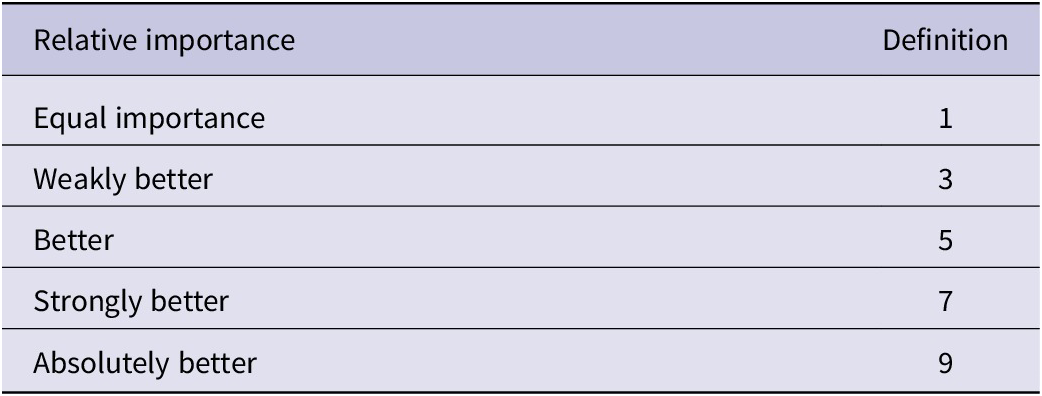
Step 2: Weighing the criteria and sub-criteria: The criteria must be prioritized based on their relative importance. In each comparison made in AHP, only two factors are compared at a time. According to Saaty, the importance of factors is calculated numerically and quantitatively according to Table 3:
Saaty’s scale used in AHP

Table 3. Long description
The table consists of two columns titled Relative importance and Definition.
* Row 1: Equal importance corresponds to the value 1.
* Row 2: Wealthy better corresponds to the value 3.
* Row 3: Better corresponds to the value 5.
* Row 4: Strongly better corresponds to the value 7.
* Row 5: Absolutely better corresponds to the value 9.
After defining the judgment matrices, prioritized vectors are determined; they show the weight of each element in the priority vector matrix by the vector of the matrix normalized based on algebraic bases.
After the pairwise comparisons, the inconsistency ratio is assessed. The inconsistency ratio is of great importance in the AHP method. In the AHP method, the consistency of decisions can be calculated, and decisions can be judged as good, bad, acceptable, or unacceptable. If A is twice as important as B, and B is 3 times as important as C, the judgment is consistent provided that A is 6 times as important as C. Saaty introduced 0.1 as the acceptable limit for the inconsistency ratio.Reference Saaty 20
2. The other method used for data analysis was the Best-Worst Method (BWM); this is also one of the multiple-criteria decision-making methods introduced by Jafar Rezaei in 2015. This method is used for prioritizing and selecting the best (highest priority) and worst (lowest priority) among a set of alternatives.Reference Rezaei 21 The steps in this method are as follows:
Step 1. Determining a set of decision-making criteria (
$ \boldsymbol{C}\Big) $
 .

Step 2. Determining the best, the most favorable, or the most important criterion (
$ B\Big) $
 , and the worst, the least favorable, or the least important one (
$ W\Big) $

Step 3. Determining the relative priority of the best criterion to all criteria using a number from 1 to 9 and forming vector
$ {\boldsymbol{A}}_{\boldsymbol{B}} $


where
$ {a}_{Bj} $
 is the priority of the best criterion to criterion j, and
$ {a}_{BB}=1 $
 .
Step 4. Determining the relative priority of all criteria to the worst one using numbers from 1 to 9 and forming the vector
$ {\boldsymbol{A}}_{\boldsymbol{W}} $


where
$ {a}_{jW} $
 is the relative priority of criterion j to the worst one, and
$ {a}_{WW}=1 $
 .
Step 5. Finding the optimal weights (
$ \boldsymbol{W}\Big) $
 .

The optimal weight for criteria is when for each pair of
$ {w}_B/{w}_j $
 and
$ {w}_j/{w}_W $
 ,
$ {w}_B/{w}_j={a}_{Bj} $
 and
$ {w}_j/{w}_W={a}_{jW} $
 .
To meet this condition, the answer that minimizes the maximum of
$ \left|\frac{w_B}{w_j}-{a}_{Bj}\right| $
 and
$ \left|\frac{w_j}{w_W}-{a}_{jW}\right| $
 for all js must result. According to the required conditions that the weights must be non-negative and the sum of weights must equal one, equation (5) results:


Equation (5) can be changed into equation (6).
$ \min \xi $


The consistency ratio (CR) is obtained using the optimal value of
$ \xi $
 and the consistency index (CI) in the following table.

Higher inconsistency ratios denote lower trustworthiness for comparison. Generally, in all pairwise comparisons, the inconsistency ratio is of great significance, and if pairwise comparisons are not consistent, they are not stable and consistent.Reference Alidoosti, Sadegheih and Govindan 22 The inconsistency ratio in the BWM is between 0 and 1, and values closer to zero show higher consistency of pairwise comparisons; the consistency index value is obtained from the following table (Table 4).
Consistency index (CI)

Table 4. Long description
The table consists of two rows and ten columns.
Row 1 (Header): The first cell contains the variable a sub B W. The subsequent nine columns are numbered sequentially from 1 to 9.
Row 2 (Data): The first cell is labeled Consistency index (max xi). The corresponding values for each column are as follows:
* For a sub B W 1, the value is 0.00.
* For a sub B W 2, the value is 0.44.
* For a sub B W 3, the value is 1.
* For a sub B W 4, the value is 1.63.
* For a sub B W 5, the value is 2.30.
* For a sub B W 6, the value is 3.00.
* For a sub B W 7, the value is 3.73.
* For a sub B W 8, the value is 4.47.
* For a sub B W 9, the value is 5.23.
Results
After assessing the hospital preparedness against the respiratory disease pandemic checklist and the literature review for obtaining the indicators, a semi-open questionnaire was prepared to perform the first round of fuzzy Delphi interviews with the selected experts, who were the managers and heads of the referral hospitals of Kerman province. The items were identified, and the researcher conducted the second round of interviews; finally, after checking the items, the third round of interviews was conducted. The 3 interviews were done in approximately one and a half months, and the experts agreed on 15 primary indicators. The researchers entered the information based on the fuzzy Delphi formulas. Initially, the importance of the indicators was determined based on the opinions of the heads and managers of each hospital separately; afterward, the aggregate of the opinions was scored, and finally, the definite score was specified based on the defuzzification formula. Indicators with scores higher than 0.7 were selected as essential indicators.
Overall, the 8 indicators below were selected out of the 15 primary indicators as the important outputs of the fuzzy Delphi method and were considered for the pairwise comparisons:
-
1. Appropriate management team and planning
-
2. Financial support
-
3. Inter- and extra-sectoral collaboration
-
4. Provision of medicine and equipment
-
5. Provision of human resources
-
6. Clear protocols and rules
-
7. Waste management and disinfection of the environment
-
8. Ventilation of the wards
The other indicators that had scores lower than 0.7 and were excluded from the study were as follows:
-
1. Prediction of the course of the disease
-
2. Management of the deceased
-
3. Manage overcrowding
-
4. Beginning the educational year
-
5. The legal and contracts department
-
6. Existence of the security department
-
7. Crisis management training
The next step included using pairwise comparisons and the AHP method to compare and prioritize the indicators.
The researchers, using the opinion of experts, performed the pairwise comparisons of the eight indicators extracted in the previous stage using Saaty’s scale (Table 3). After the interviews, the information from the questionnaires was entered into the Expert Choice software; The output of the Expert Choice software is shown in Figure 1. As seen from the figure, the indicators are prioritized as follows:
-
1. Appropriate management team and planning
-
2. Provision of human resources
-
3. Provision of medicine and equipment
-
4. Financial support
-
5. Ventilation of the wards
-
6. Inter- and extra-sectoral collaboration
-
7. Clear protocols and rules
-
8. Waste management and disinfection of the environment
Output of Expert Choice software for the AHP results of the eight indicators. The priorities are shown as follows: (1) Appropriate management team and planning (0.2984); (2) Provision of human resources (0.1690); (3) Provision of medicine and equipment (0.1379); (4) Financial support (0.1108); (5) Ventilation of the wards (0.0887); (6) Inter- and extra-sectoral collaboration (0.0748); (7) Clear protocols and rules (0.0703); (8) Waste management and disinfection of the environment (0.0502). The inconsistency ratio was 0.02, which is acceptable (<0.1).

Figure 1. Long description
The interface is divided into two main sections. At the top, a comparison slider is positioned between Management team on the left and Financing on the right, with a scale from 9 to 1 to 9. Below this is a matrix titled Compare the relative importance with respect to: Goal: Readiness for Covid 19. The matrix columns and rows list eight indicators: Management team, Financing, Communication, Medicine and Equipment, Human resources, Transparent protocols, Waste management, and Ventilation. The upper right triangle of the matrix contains numerical values representing the pairwise comparisons. Notable values include Management team versus Financing at 4.0428 and Management team versus Waste management at 4.193. Some values are highlighted in red, such as 1.4963 for Financing versus Human resources. The bottom left cell of the matrix displays Incon: 0.02, indicating the inconsistency ratio.
The first indicator, appropriate management team and planning, was by far the most crucial indicator from the experts’ point of view.
The inconsistency ratio, which must be less than 0.1 in AHP, was 0.02 according to the output of Expert Choice; therefore, the pairwise comparisons done by the experts had an acceptable consistency.
The indicators resulting from the fuzzy Delphi method were given to the experts to assess and compare the indicators based on the BWM method, and they determined the best and worst indicators (the highest and lowest priority). According to the experts, the best indicator was “Appropriate Management Team and Planning”, and the worst was “Waste Management and Disinfection of the Environment”. Afterward, the best indicator was compared with the others through pairwise comparison. The data that has been used in the BWM is shown in Figure 2.
Schematic representation of the Best-Worst Method (BWM) structure used for comparing indicators. According to expert opinions, the best indicator was “Appropriate management team and planning,” and the worst indicator was “Waste management and disinfection of the environment.” Pairwise comparisons were then conducted between the best indicator and all other indicators.

Figure 2. Long description
A screenshot of the Expert Choice software interface. The main window title is Priorities with respect to Goal Readiness for Covid 19. Below this, a list of eight indicators is presented with numerical values and corresponding dark blue horizontal bars.
* Management team has a value of .2984 and the longest bar.
* Financing has a value of .1108.
* Communication has a value of .0748.
* Medicine and Equipments has a value of .1379.
* Human resource has a value of .1690.
* Transparent protocols has a value of .0703.
* Waste management has a value of .0502 and the shortest bar.
* Ventilation has a value of .0886.
At the bottom left of the data area, it states Inconsistency = 0.02 with 0 missing judgments. The top of the window shows a file path ending in C o v i d Geomean dot a h p and standard software menu options like File, Edit, and Assessment.
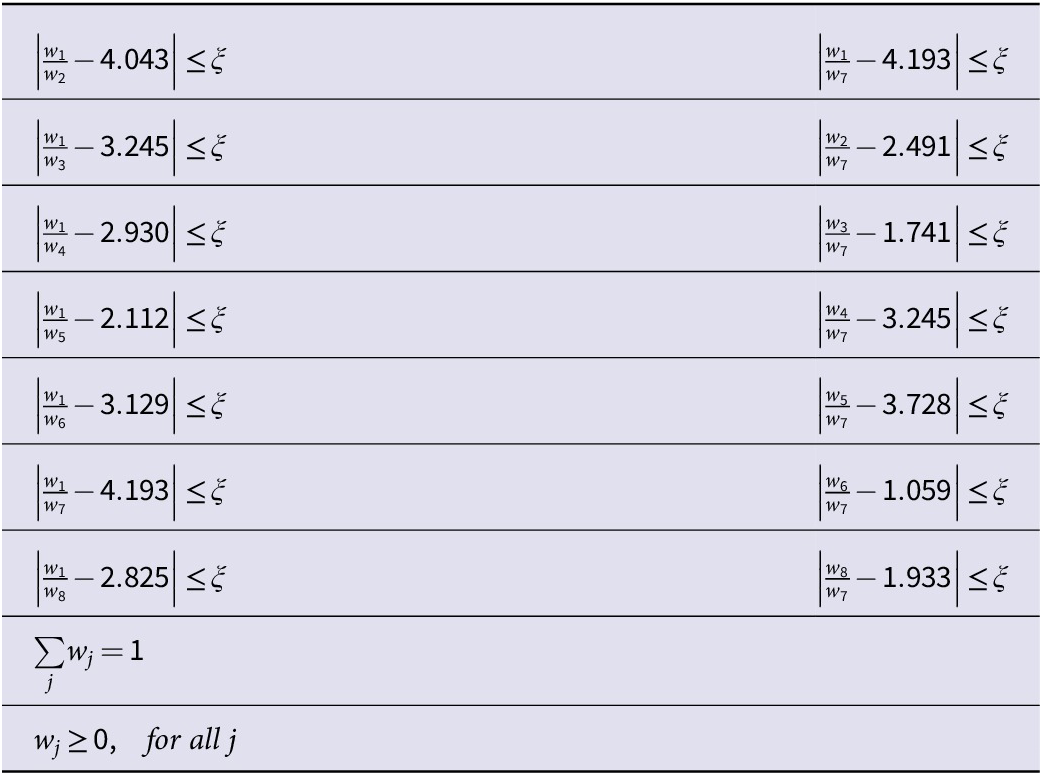
Then, the mathematical model was formulated as follows:

$ s.t. $


Table 5. Long description
The table consists of seven rows with two columns of formulas, followed by two single-column rows at the bottom.
Row 1:
- Left: absolute value of (w sub 1 over w sub 2 minus 4.043) is less than or equal to xi.
- Right: absolute value of (w sub 1 over w sub 7 minus 4.193) is less than or equal to xi.
Row 2:
- Left: absolute value of (w sub 1 over w sub 3 minus 3.245) is less than or equal to xi.
- Right: absolute value of (w sub 2 over w sub 7 minus 2.491) is less than or equal to xi.
Row 3:
- Left: absolute value of (w sub 1 over w sub 4 minus 2.930) is less than or equal to xi.
- Right: absolute value of (w sub 3 over w sub 7 minus 1.741) is less than or equal to xi.
Row 4:
- Left: absolute value of (w sub 1 over w sub 5 minus 2.112) is less than or equal to xi.
- Right: absolute value of (w sub 4 over w sub 7 minus 3.245) is less than or equal to xi.
Row 5:
- Left: absolute value of (w sub 1 over w sub 6 minus 3.129) is less than or equal to xi.
- Right: absolute value of (w sub 5 over w sub 7 minus 3.728) is less than or equal to xi.
Row 6:
- Left: absolute value of (w sub 1 over w sub 7 minus 4.193) is less than or equal to xi.
- Right: absolute value of (w sub 6 over w sub 7 minus 1.059) is less than or equal to xi.
Row 7:
- Left: absolute value of (w sub 1 over w sub 8 minus 2.825) is less than or equal to xi.
- Right: absolute value of (w sub 8 over w sub 7 minus 1.933) is less than or equal to xi.
Row 8 (Centered):
- Summation over j of w sub j equals 1.
Row 9 (Centered):
- w sub j is greater than or equal to 0, for all j.
After solving the mathematical model, the results of BWM will be obtained. Comparing the BWM and AHP results, “Appropriate Management Team and Planning” emerged as the most crucial indicator for hospital readiness, while "Waste Management and Disinfection of the Environment" was identified as the weakest.
Discussion
In the study conducted by Kang et al. analyzing preparedness for the second wave of COVID-19 and pharmaceutical management, problems such as overcrowding in hospitals and staff problems, such as working too many shifts, mental issues, fear of being infected, fear of their family’s infection, and provision of medication were discussed. This study investigated medication management during COVID-19, and the medication management checklist was used for planning for the drug crisis. This checklist includes providing consumer medical equipment and medication, observing protocols, quick diagnosis, planning for human resources, controlling the infection, having plans for a wide range of patients, and emergency planning.Reference Kang, Huggins and Diaz-Fuentes 23 In the study conducted by Griffin et al. (2020), the preparedness of New York hospitals for COVID-19 was assessed. Various aspects, including controlling the infection, practical clinical challenges, increasing the capacity of the ICU, attention to the staff and their health, and observing professional ethics, were considered. Different protocols were created for intubation, use of high-flow oxygen, and interacting with consultants on infectious and cardiac diseases. Some strategies for increasing the hospitalization capacity and improving the efficiency in ICUs were implemented through outsourcing methods. New technologies were used to minimize the calls made by the staff to contact COVID-19 patients. Necessary facilities for patients’ families and their end-of-life issues were provided. Moreover, education was provided to standardize the care. Some guidelines were also designed for different clinical and non-clinical aspects of facing COVID-19 and other potential epidemics and pandemics.Reference Griffin, Karas and Ivascu 24 Nekoie-Moghadam et al., in a systematic review, investigated some tools and checklists for assessing hospital preparedness for disasters. Fifteen items were emphasized in the checklists; these items included overall planning, management and control, triage, post-crisis recovery, education, communication, human resources, evacuation, connectivity, coordination, capacity, security, and structured or non-structured preparedness.Reference Nekoie-Moghadam, Kurland and Moosazadeh 25 Scarfone et al. conducted a study on hospital preparedness and responsiveness regarding the H1N1 influenza pandemic in the US. Using the hospital lobby for seeing patients, 24-hour use of subspecialty clinics, short-stay units for influenza patients, and using physicians in pediatric emergency wards and influenza wards were mentioned.Reference Scarfone, Coffin and Fieldston 26
This study aimed to define the most important indicators in the region (Kerman province) through the review of studies and interviews with the managers and heads of hospitals. The mentioned problems and solutions were as follows:
-
1. The most important factor was creating a strong management team and having proper planning. This indicator would enable us to overcome many difficulties and barriers.
-
2. Ventilation and isolated rooms with proper isolation are essential. Unfortunately, several problems were seen in this regard in hospitals; solving these problems requires addressing infrastructural problems and will be necessary to overcome future crises and potential epidemics. For the time being, in the current crisis, observing environmental health protocols and using ventilation devices and portable filters can help overcome the current problems.
-
3. Intra-sectoral communications for using spaces, facilities, and personnel of other wards, as well as communications with other sectors such as communication with the vice-chancellor for food and drugs to provide drugs and medical consumer equipment, communicating with the vice-chancellor of research and technology to produce masks in knowledge enterprises, and communicating with the vice-chancellor of development to purchase requirements and provide human resources are important.
-
4. Regarding financial issues: financial barter was done with pharmaceutical companies by the vice-chancellor of development. Loans were taken from banks, and the cumulative purchase was made. Required planning to reduce insurance deduction was done. Help was sought from charitable people for providing facilities, equipment, masks, and other necessities.
-
5. The vice-chancellor of development obtained the permissions regarding human resources; different methods of signing contracts and providing human workforce such as 89-day contracts, employing people from the Red Crescent Society and Basij of Medical Society were used.
Recommendations
-
1. More communication in the health sector and focusing on preventing and reducing work pressure in hospitals
-
2. Signing memoranda with other private and governmental centers
-
3. Educating the managers and staff of hospitals regarding preparation skills for dealing with crises and increasing resilience
-
4. Paying more attention to the hospital organizational chart and satisfying staff needs
-
5. Creating proper protocols for facing pandemics and epidemics and continuous education of the protocols
-
6. Preparing physical spaces and preparing these spaces for triage, hospitalization, and isolation of patients
Limitations of the study
The most significant limitation of the study was making arrangements with managers and heads of the referral hospitals in different cities of Kerman. The experts were quite busy, and arranging to meet them for the three stages of fuzzy Delphi, AHP, and BWM was quite challenging.
Author contribution
Shahram Ariafar acted as the study supervisor and methodological advisor, overseeing and critically reviewing the study design and implementation. Elham Amini was involved in all stages of the study, including conceptualization and title selection, data collection, manuscript drafting, and interpretation of findings. Mina Mohammadkhani and Majid Heidari contributed to data collection.
Funding statement
No funds received.
Competing interests
None.
Ethical standard
This study was approved by the Ethics Committee of Kerman University of Medical Sciences (Approval ID: IR.KMU.REC.1399.290). All procedures performed in this study were in accordance with the ethical standards of the institutional and/or national research committee and with the 1964 Helsinki Declaration and its later amendments. Before entering the study, written informed consent was obtained verbally from all participants.
Consent for publication
The authors affirm that no identifying personal information is included in this manuscript.