I. INTRODUCTION
The cost of photovoltaic (PV) modules in the last five decades has decreased exponentially. The growth rate of the global PV market was about 70% per year from 2007 to 2011.1 As early as 1980, an economic analysis suggested that Si is the best material for terrestrial PV applications.Reference Singh and Leslie2 This prediction still holds true, because 90% of the currently manufactured solar cells are based on bulk Si. Highest demonstrated AM1.5G efficiency of a passivated emitter with rear locally diffused (PERL) crystalline silicon solar cells is 25%.Reference Green3 Using commercial-grade p-type silicon wafers, recent work of Wang et al.Reference Wang, Han, Lu, Qian, Chen, Meng, Tang, Gao, Jia, Wu, Fei, Wu, Zhu, Ji, Shi, Sugianto, Mai, Hallam and Wenham4 has led to the development of a commercial version of the PERL cell with a record production-level AM1.5G efficiency of 20.3%. Further improvements in the efficiency of silicon-based solar cells can be achieved by the use of multi-terminal multi-junction solar cells.Reference Singh, Alapatt, Lakhtakia and Todd5 For the new materials, the cost of the raw materials and their atomic concentration in the earth’s crust can give a good indication of the relative cost of that material in a large-scale application. For generating PV electricity at a lower cost ($/kWh) than conventional energy sources, the following criteria must be used in choosing appropriate PV module manufacturing technology (i) no material supply constraints, (ii) lowest cost of ownership, (iii) lowest production cost, (iv) the prospect of further cost reduction, and (v) environmental safety and health issues (ESH) and green manufacturing.Reference Singh and Leslie2,Reference Singh, Gupta and Poole6–Reference Singh, Alapatt and Poole8
Low-cost is the driver of growth and can happen only for the solar cells manufactured with most abundant raw materials.Reference Singh and Leslie2,Reference Singh, Gupta and Poole6–Reference Singh, Alapatt and Poole8 Like silicon, copper is also one of the most abundant and nontoxic element in the earth crust with annual global production of about 16.1 million tons9 and has the potential to be used in solar cell manufacturing. In this work, we have investigated copper (I) oxide films deposited on a silicon substrate using photo-assisted metal-organic chemical vapor deposition (MOCVD) for potential PV applications.
II. BACKGROUND MATERIAL
The best bulk silicon solar cell efficiency reported to date is about 25%, and the maximum single junction theoretical efficiency is about 33%.Reference Shockley and Queisser10 Further significant increases in efficiency of silicon solar cells are unlikely without the use of a multi-junction device structure capable of converting a larger fraction of the spectrum into useful electrical energy. Considering the simplest case of a multi-junction multi-terminal cell, a two-junction cell with silicon as the bottom layer, the highest efficiency calculated from the black body limit is 44% when the band gap of the top material is 1.8 eV. If realized, this increase in efficiency will further reduce the cost of PV-generated power. Semiconductors consisting of abundant materials can be used as the top layer to boost the efficiency of silicon solar cells. The reported band gap of the Cu2O film ranges from 1.7 to 2.6 eV.Reference Ogale, Bilurkar, Mate, Kanetkar, Parikh and Patnaik11–Reference Balamurugan and Mehta13 Therefore, Cu2O fits reasonably well as a promising top layer PV material. Assuming Cu2O band gap of about 2.0 eV, the theoretical calculations have shown that maximum AM1.5G efficiency for Cu2O solar cell is approximately 22% with a required leakage current density at zero bias (J 0) of 4 × 10⁻²⁸ A/cm2 while to achieve a practical efficiency of 9–11% with a required J 0 of about 10−17 A/cm2.Reference Olsen, Addis and Miller14
Copper (I) oxide (Cu2O) is a direct band gap semiconductor with p-type conductivity. PV effect based on copper (I) oxide or Cu2O device was first observed in 1917 by Kennard and Dieterich.Reference Kennard and Dieterich15 Cu2O has several excellent properties such as very high absorption coefficient (of the order of 105 cm−1) for the above band gap wave lengths, good majority-carrier mobility (≈90 cm2/V s), and minority carrier diffusion length of the order of 3.5 µm.Reference Biccari16 After the invention of silicon and germanium diodes, interest in copper (I) oxide based devices declined. Renewed interest started after energy crisis of 1973, and several researchers investigated Cu2O again as a potential PV material. Several methods such as thermal oxidation,Reference Mittiga, Salza, Sarto, Tucci and Vasanthi17 pulsed laser deposition,Reference Jawad, Ismail and Yahea18 chemical vapor deposition (CVD),Reference Maruyama19 electrochemical deposition,Reference Switzer, Liu, Bohannan and Ernst20 thermal evaporation,Reference Huang, Yang, Li, Gu, Du, Lu and Shi21 and sputteringReference Ghosh, Avasthi, Shah, Ganesan, Gupta, Sarangi, Bhattacharya and Assmann22 etc., have been investigated to fabricate Cu2O-based solar cells. However, to date, the maximum efficiency of only 2% has been reported for copper (I) oxide solar cells under AM1.5G spectrum.Reference Mittiga, Salza, Sarto, Tucci and Vasanthi17
As compared to simple thermal processing, rapid photothermal processing (RPP) has been proven to be a superior technique in a variety of materials.Reference Singh, Parihar and Nalwa23–Reference Venkateshan, Singh, Poole, Harriss, Senter, Teague and Narayan26 The operating mechanisms are described in Refs. Reference Singh, Parihar and Nalwa23 and Reference Shishiyanu, Singh, Shishiyanu, Asher and Reedy27. The quantum effects associated with photons with wave length below about 800 nm have the following implications for the photo-assisted CVD process;
(i) At a given processing temperature, the bulk and surface diffusion coefficients are enhanced.
(ii) The processing cycle time is reduced.
(iii) Due to lower microscopic defects, devices and circuits with higher performance, better reliability, and yield are obtained.
III. EXPERIMENTAL
A. Photo-assisted MOCVD system
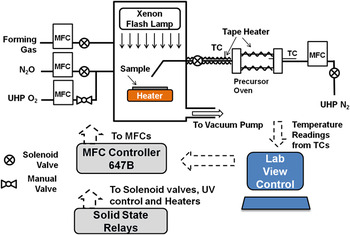
A custom-designed noncommercial MOCVD system with a xenon flash lamp as the source of incoherent UV photons, (Fig. 1), was used to deposit Cu2O thin film on n-type Si <100> substrate. Bis(2,2,6,6 tetramethyl 3,5-heptanedionato)copper(II) [Cu(TMHD)2] with a purity of 99% was used as the precursor for the deposition of copper oxide films. The precursor used in this work was purchased from Strem Chemicals (Newburyport, MA). Based on our previous experience of depositing high quality thin films of oxide-based dielectrics, nitrous oxide, and ultra-high purity (UHP) oxygen were used as the reaction gases.Reference Singh, Parihar and Nalwa23 As shown in Fig. 1, the precursor was kept in a heated stainless steel oven and connected by a heated line to the deposition chamber. The temperature in the precursor oven was monitored with a K type thermocouple and controlled with LabVIEW modules. The UV photon source, mass flow controllers (MFCs), and solenoid gas valves were also controlled with LabVIEW modules to improve process effectiveness. The base pressure and deposition pressure for the process was about 2 × 10⁻² and 8.1 × 10⁻¹ Torr respectively.
Experimental set up of MOCVD system used for in situ cleaning, deposition and in situ annealing of Cu2O films.

B. Process flow of photo-assisted MOCVD
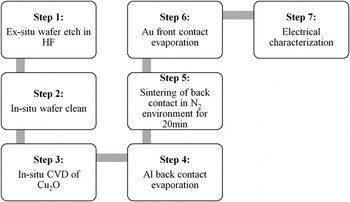
A typical process flow of Cu2O thin film deposition is shown in Fig. 2. First of all, the n-type <100> Si wafer was cleaned ex situ in diluted HF solution for 1 min and then, loaded into the deposition chamber. The substrate was cleaned in situ in 20 sccm flow of forming gas (20% UHP H2 and 80% UHP N2) at 900 °C for 5 min. The precursor was heated in vacuum at 140 °C. After in situ cleaning, the substrate was brought to the deposition temperature of 750 °C; using 200 sccm of UHP N2, the deposition process was performed for 60 min. In addition, N2O and UHP O2 were supplied at 80 sccm during the deposition. After deposition, the substrate was allowed to cool to room temperature in vacuum. The UV light source was kept on during an in situ cleaning and the deposition process. The same process was used to deposit Cu2O thin-film on p-Si and quartz substrates. The quartz substrate was cleaned ex situ using RCA cleaning instead of the HF cleaning. The deposited film on silicon substrates was uniform in a 1 cm diameter region due to limitation of nozzle position in our experimental setup. All the measurements were done on this 1 cm diameter circle.
Process flow for the deposition of Cu2O thin films on silicon and quartz substrates.

C. Characterization details
X-ray diffraction (XRD) measurements were performed on the as-grown films as well as on clean substrate materials using an angle dispersive diffractometer (Rigaku Ultima IV, Tokyo, Japan) with monochromatic Cu Kα (λ = 1.540 Å) radiation at 40 kV. XRD data were collected at a rate of 1.2° 2Θ per min in 0.2° 2Θ steps. An optical reflectance spectrum of the Cu2O film deposited on a quartz wafer was obtained by using a PC-controlled Shimadzu UV-3101 UV-Vis-NIR spectrometer (Shimadzu Corp., Kyoto, Japan) equipped with an integrating sphere. A blank quartz wafer was used as a reflectance standard. The UV-Vis-NIR diffuse reflectance spectrum of the blank quartz wafer and the Cu2O-coated wafer were acquired in the range of 250 nm (5 eV) to 2100 nm (0.6 eV) in reflectance (%R) mode. Absorption coefficient was calculated from the reflectance data using the Kubelka–Munk function.Reference Kortüm, Braun and Herzog28 The thickness of Cu2O thin film was measured with a DekTak III profilometer (Bruker Corp., Billerica, MA) with software package version 1.2. To prepare cross-section TEM samples, Argon ion milling procedure was utilized with an incidence angle of 3° at 3 KeV. A JEOL-2010F field emission TEM (Tokyo, Japan) was used to study the microstructure and to determine crystal structure by selected-area diffraction techniques.
For electrical characterization, aluminum and gold metal dots were evaporated as back and front contact respectively on both n-Si and p-Si devices. Prior to evaporating the gold front contact, the aluminum contact was sintered at 475 °C for 20 min in a nitrogen environment to form an ohmic contact to silicon. After sintering the back ohmic contact, 1.0 mm diameter gold dots were evaporated as front metal contact to Cu2O. The area of the device was measured to be equal to 0.00785 cm2. A Keithley 4200 semiconductor characterization system was used to perform current–voltage measurement.
III. RESULTS AND DISCUSSION
A. XRD of Cu2O thin-film
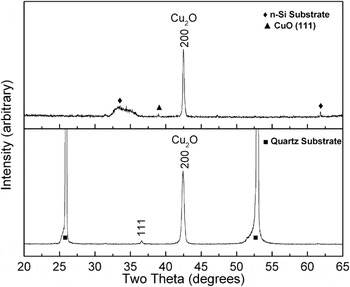
The XRD analysis of the films deposited by photo-assisted MOCVD is shown in Fig. 3. The x-ray data indicate that highly crystalline Cu2O film was deposited on both quartz and Si substrates. In general, we note that a preferred orientation, as (200)-oriented crystals, occurs on both substrates. This is similar to Cu2O films more commonly grown on c-axis ZnO by MOCVDReference Jeong and Aydil29 and also grown by sputtering techniques,Reference Akimoto, Ishizuka, Yanagita, Nawa, Paul and Sakurai30 but a departure from the (111)-oriented films is typically grown by electrochemical means.Reference Izaki, Shinagawa, Mizuno, Ida, Inaba and Tasaka31 A small polycrystalline contribution from (111)-oriented crystals is observed for films grown on the quartz substrate, but it is not the primary orientation. In the case of the Si substrate, a very small amount of CuO is formed, and (111) Cu2O is not observed. There is a broad weak silicon peak at 2θ equal to 33° for Cu2O/n-Si device due to about 150 nm thick Cu2O film.
XRD pattern of the Cu2O films deposited on n-Si substrate (top) and quartz substrate (bottom).

B. Energy gap of Cu2O thin-film
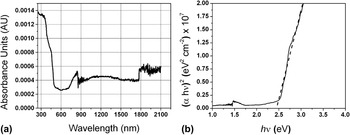
Figure 4(a) shows absorbance spectra of Cu2O thin-film deposited on a 2″ quartz wafer. To calculate the optical band gap of the Cu2O thin film, Tauc’s relationship is used which is given by α × hν = α0 (hν − E g)n, where, α is absorption coefficient, hν is photon energy, α0 is a constant, E g is the band gap, and n is 0.5 for a direct band gap material.Reference Tauc, Grigorovici and Vancu32 Further, absorption coefficient of the Cu2O thin film is given by α = 2.303 (A/d), where d is the thickness of the film and A is optical absorbance.Reference Pathan, Desai and Lokhande33 The thickness of the Cu2O film on quartz was about 15 nm as measured with the DekTak profilometer. As shown in Fig. 4(b), the optical band gap is estimated by extrapolating the linear portion of (α × hν)2 versus hν plot to the hν axis. According to this analysis, the estimated band gap of the film was 2.44 eV on a quartz substrate.
(a) Absorbance spectra of Cu2O thin film deposited on quartz wafer; (b) (α·hν)2 versus energy plot for optical band gap calculations.

C. Transmission electron microscopy
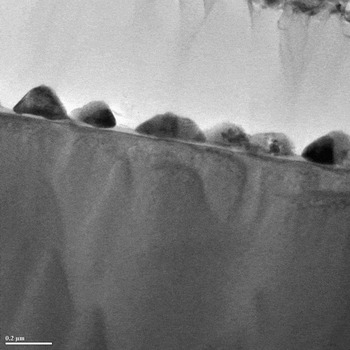
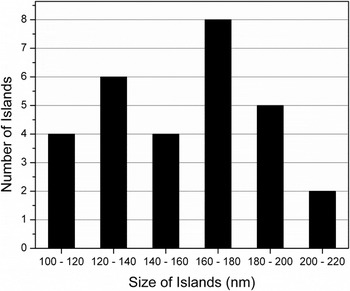
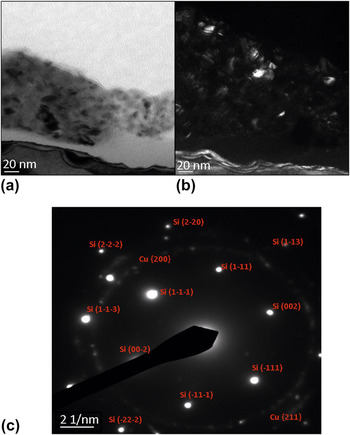
The Cu2O film grows in the form of three-dimensional islands by Volmer–Weber growth on a SiO2/Si (100) substrate, as shown in Fig. 5. This growth mode requires: σs(low) < σf (low) + σsf (high), where (σs) is the free energy of the substrate, (σf) is the free energy of the film, and (σsf) is the interfacial energy. Figure 6 shows the size distribution with islands in the size range of 100–200 nm. The microstructure of these grains shows that these islands are composed of smaller nanocrystalline grains in the range of 10–20 nm containing some defects and their clusters, as shown in the bright-field and dark-field images of Fig. 7. The corresponding selected-area diffraction pattern shows spots from Si <110> orientation and faint rings from the nanocrystalline Cu2O film. In this pattern, the bright spots correspond to Si substrate, while the faint ring corresponds to the polycrystalline Cu2O film.
Bright-field cross-section TEM image of the individual islands.

Size distribution of Cu2O islands/grains.

Polycrystalline grains: (a) cross-section bright-field TEM image; (b) cross-section dark-field TEM image; and (c) selected-area diffraction pattern.

D. Cu2O–Si heterojunction electrical characteristics
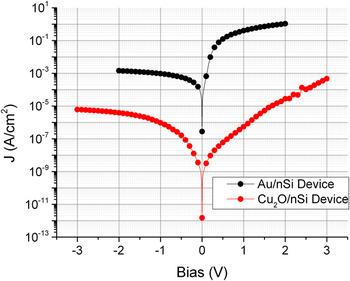
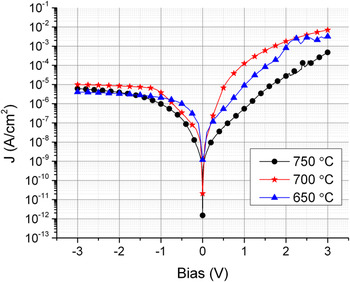
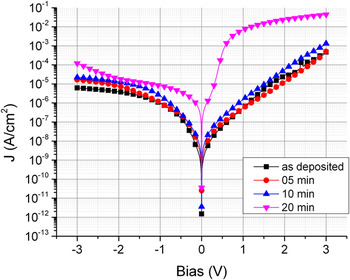
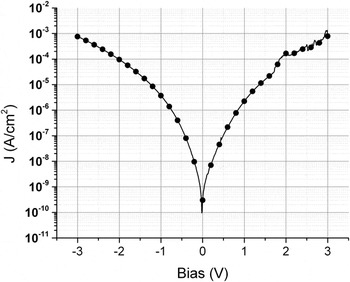
In this section, the electrical characterization of Cu2O/nSi devices fabricated under various processing conditions is described. To begin with, a sample without the Cu2O film was prepared, and current density–voltage (J–V) characteristics were measured to verify Schottky junction formation between gold and the silicon substrate. Figure 8 shows that Cu2O–nSi device has leakage current five orders magnitude lower than Au–nSi Schottky diode. This effect can only result from the high quality interface between the two materials i.e., Cu2O/nSi. Figure 9 shows dark J–V characteristics of Cu2O/n–Si devices fabricated at 750, 700, and 650 °C. The device fabricated at 750 °C shows the lowest dark leakage current as compared to devices deposited at 700 and 650 °C. Therefore, 750 °C was chosen as the deposition temperature for rest of the work. To see the effect of annealing on Cu2O/n-Si devices, the devices fabricated at 750 °C were annealed in a nitrogen environment at 500 °C for various time intervals. Figure 10 shows that the dark leakage current density of the devices remains relatively unchanged for 5 and 10 min annealing and adverse results are obtained for 20 min annealing time. Based on the results of Fig. 10, annealing was not included in the optimum cycle. As shown in Fig. 11, the Cu2O thin film was also deposited on the p-type silicon wafer. The electrical characteristic for Cu2O/p-Si device is found to be nonrectifying. The lowest leakage current density at zero bias is 1.5 × 10⁻¹²A/cm2 for the Cu2O/n-Si device which is an indicator of low interface recombination.
Comparison of J–V characteristics of Au–nSi device (Schottky diode) and Cu2O–nSi device.

Current density–voltage (J–V) characteristics of Cu2O/n-Si devices deposited at various substrate temperatures.

Effect of annealing time on the J–V characteristics of Cu2O/n-Si devices deposited at 750 °C and annealed in situ at 500 °C.

J–V characteristic of the Cu2O/p-Si diode.

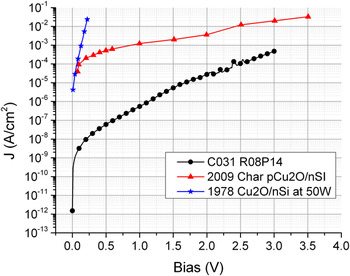
Four samples were fabricated using optimal processing parameters described in the Sec. III. Four dots were measured on each sample to determine descriptive statistics for leakage current density at zero bias. A 95% prediction interval for absolute value of the leakage current density at zero bias lies between 0.54 × 10⁻¹² and 12.08 × 10⁻¹² A/cm2. While, 95% confidence interval for absolute value of the leakage current density at zero bias lies between 4.86 × 10⁻¹² and 7.74 × 10⁻¹²A/cm2. We have also compared our dark J–V characteristics with the results reported in the literature.Reference Drobny and Pulfrey34,Reference Ismail35 As shown in Fig. 12, our dark current density is many orders of magnitudes lower than data reported in the literature. Our results showing lower dark leakage current indicate low defect density of Cu2O films and suitability for potential PV applications. The use of high purity precursor (precursor used in this study was 99% pure) will further reduce the defects of copper oxide films and improve the device electrical characteristics.
Comparison of dark J–V characteristics of Cu2O/n-Si diodes reported in the literatureReference Drobny and Pulfrey34,Reference Ismail35 and present work.

IV. CONCLUSION
Cu2O thin films have been deposited on n-type and p-type silicon substrates. Cu2O/n-Si device shows a rectifying junction behavior whereas Cu2O/p-Si shows nonrectifying current–voltage characteristics. The XRD analysis revealed a single major peak of Cu2O. Based on UV-Vis-NIR spectroscopy measurements, the calculated optical band gap is about 2.44 eV. TEM spectroscopy showed nanocrystalline growth of the film. Electrical characterization of Cu2O/nSi devices showed the lowest leakage current density at zero bias of 1.5 × 10⁻¹²A/cm2 which is a major indicator of low bulk and surface recombination and indicates the potential of Cu2O as a PV material.