


1. Introduction
General reviews, with extensive references, have been published on the properties of compound semiconductors and their pseudobinary alloys [Reference Chen and Sher1,Reference van Schilfgaarde, Sher and Chen2]. This review focuses on fundamental properties of the compounds and their pseudobinary alloys that can be calculated from an ab initio theoretical, or computational standpoint [for details see Ref. 2]. Its purpose is twofold: first to summarize much of what electronic structure theory has contributed recently to the understanding of some aspects of the III-nitride alloys; and, second, to provide some foundation for modern techniques, to provide the nonspecialist with a basis to assess the validity and limitations of the techniques employed in the literature.
Section 2 introduces the virtues and limitations of the local-density approximation (LDA) [Reference Hohenberg and Kohn3] and two higher order corrections, gradient corrections [Reference Perdew, Burke and Enzerhof4] and screened exchange [Reference R Rücker5]. The discussions will be couched in terms of a self-consistent, all-electron theory that employs full potentials between the electrons and ions and a linear muffin-tin orbital (LMTO) [Reference Andersen6] basis [Reference van Schilfgaarde, Sher and Chen2,Reference Methfessel7]. This procedure takes proper account of the d states, which is essential to obtaining accurate results in materials like GaInN alloys. Section 3 summarizes some recent results on fundamental properties of nitride alloys [Reference van Schilfgaarde, Sher and Chen2,Reference Berding, van Schilfgaarde and Sher8]. Section 4 is devoted to concluding remarks.
2. General Theory
An exact, or nearly exact, theory of the ground state in condensed matter is immensely complicated by the correlated behavior of the electrons. For materials with wide-band or itinerant electronic motion, a one-electron picture is adequate, meaning that to a good approximation the electrons (or quasiparticles) may be treated as independent particles moving in an effective external field. The effective field consists of the coulombic interaction of electrons+nuclei, plus an additional effective potential that originates in the correlated electronic motion. This potential must be calculated self-consistently, such that the effective one-electron potential created from the electron density generates through the eigenvectors of the corresponding one-electron Hamiltonian, the same charge density.
2.1 The Local-Density Approximation
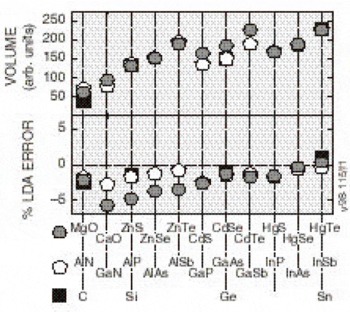
The LDA approximates the formally exact (but unknown) energy functional as one that consists of the coulomb energy, plus a functional of the density, dubbed the “exchange-correlation” energy density. This ansatz leads, as in the Hartree-Fock [Reference Pandey, Jaffe and Harrison9] case, to an equation of motion for electrons moving independently in an effective field, except that in LDA the potential is strictly local. The local form of this potential vastly simplifies the computational effort. Unlike in Hartree-Fock theory, there is no formal justification for associating the eigenvalues of the LDA Hamiltonian with energy bands. However, in one sense, the LDA is an approximation to Hartree-Fock theory where there is a formal justification for this interpretation. Thus, it is expected that the LDA eigenvalues bear a close resemblance to energy bands, and they are widely so interpreted. We mention in passing that the LDA is not merely an approximate Hartree-Fock theory, but determines the exchange energy from a theory of the homogeneous electron gas (jellium). Thus, unlike Hartree-Fock theory, the LDA generates the correct total energy and bands for that problem. On the whole, the LDA predicts with good accuracy ground state properties (such as structural properties and elastic constants) in itinerant materials. Figure 1 illustrates the accuracy of the LDA for s-p bonded systems. In this figure the predicted volume per particle of all the common semiconductors is compared with experiment. The difference is less than 5% in the worst case. If the bond lengths were compared instead of the volumes, the percentage errors decrease by a factor of 3. Most errors are less than 1%. Errors in predicted elastic constants of these same compounds are typically less that 10% and the largest are 15% [Reference Chen and Sher1]. In fact, there has been very little progress in improving on the LDA for ground-state properties of solids.
The experimental volume per unit cell and the percent difference between the theoretical and experimental values for several II-VI, III-V, and group IV compounds. The percent differences would be reduced by a factor of three if the bond lengths were treated instead of the volumes
2.2 Gradient Correction Approximation
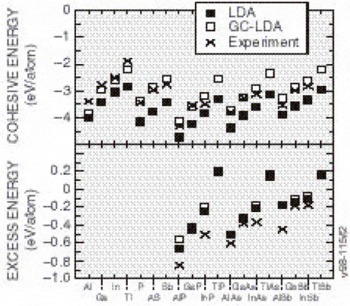
One of the largest errors in the LDA is the heat of formation of the crystal from the separated elements. It is widely accepted that most of the error can be attributed to errors in the free atom; thus, errors in the heats of reaction among different solid phases tend to be much smaller (typically 1/5 as large). Gradient corrections [Reference Perdew, Burke and Enzerhof4] (generalizing the functional to the local plus a term essentially proportional to the Laplacian of the density) largely undoes the large error in the heat of formation from the separated elements. We show in Figure 2 some results from a recently developed generalized gradient approximation (GGA) of Perdew, Burke, and Enzerhof, the so-called “PBE” functional [Reference Perdew, Burke and Enzerhof4]. The percentage errors between the measured and predicted cohesive energies (the energy difference per unit cell between the assembled solid and its separated atoms), are seen to decrease appreciably when GCAs are applied. The excess energies, the difference per unit cell between the cohesive energies of the solid and the best-bound constituent compounds, are also shown in Figure 2. The excess energies are not improved by the addition of GCA.
The cohesive energies and excess energies of several group III and V metals, and III-V compounds. Theory numbers are presented for LDA and GC-LDA along with the corresponding experimental values for comparison. Note the GC-LDA values fit experiment better than the LDA predictions, but the excess energies predictions are not improved as much.
2.3 Screened Exchange
While for the most part the LDA does a pretty reasonable job in the prediction of optical properties, it tends to underestimate the energy bandgaps (roughly by a constant). Gradient corrections do not improve on the LDA gaps; they do not redress the fundamental problem with the LDA, which errs in the gaps for a reason closely related to the errors in the Hartree-Fock approximation. The exact nonlocal exchange operator of Hartree-Fock has a long-range part which is overestimated in a solid because it neglects the ability of the host to screen this term. In the LDA, the exchange operator is replaced by a local exchange and correlation potential, which thus misses entirely the long-range nature of exchange. In semiconductors, the long-ranged part of this interaction should be present but reduced (screened) by the high-frequency dielectric constant. ε. Since this dielectric constant is large compared with unity, the LDA does better by ignoring the nonlocal interaction all together than does Hartree-Fock theory by putting it in unscreened.
Harrison’s model of the gap underestimate provides us with a clear physical picture of the missing ingredient in the LDA and semiquantitative estimate for the correction [Reference Harrison10]. The LDA uses a fixed one-electron potential for all the energy bands; that is, the effective one-electron potential is unchanged for an electron excited across the gap. Thus, it neglects the electrostatic energy U cost associated with the separation of electron and hole for such an excitation. This Harrison modeled by noting a coulombic repulsion between the local excess charge and the excited electron. U is screened by the surrounding medium so that an estimate for the additional energy cost, and therefore a rigid shift for the entire conduction band including a correction to the bandgap is U/ε. This simple model produces a correction of the right order of magnitude, although formal theories that incorporate this correction show more complex behavior.
The GW approximation [Reference Rubio, Corkill, Cohen, Shirley and Louie11] has been the only way to correct errors in the optical properties that are inherent in the LDA. Formally, the GW approximation is the first term in the series expansion of the self-energy in the screened coulomb interaction W. However, the series is not necessarily convergent, and in any case such a viewpoint offers little insight. It is more useful to think of the GW approximation as being like Hartree-Fock theory, but with a frequency-dependent, nonlocal screened interaction W replacing the bare coulomb interaction.
There have been several attempts to introduce approximations to the GW theory. Very recently, Rücker introduced a generalization of the LDA functional to account for excitations [Reference R Rücker5]. His approach, which he calls the “screened exchange” (SX) theory, differs from the usual GW approach in that the latter does not use the LDA at all except to generate trial wave functions needed to make the quantities such as G, ε−1, and W. His scheme was implemented in the LMTO-atomic spheres approximation (LMTO-ASA) [Reference Andersen6], and promises to be extremely efficient for the calculation of excited-state properties, with accuracy approaching that of the GW theory. The screened exchange formalism is described in Ref. [Reference van Schilfgaarde, Sher and Chen2], and the reader is referred to that paper for further detail.
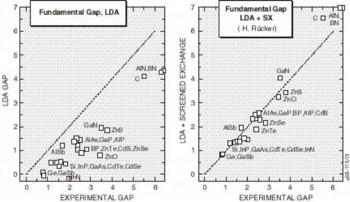
Although it is not essential to the theory, Rücker’s implementation uses only the static response function, so that the one-electron equations have the Hartree-Fock form. The theory is formulated in terms of a generalization of the LDA functional, so that the N-particle LDA ground state is exactly reproduced, and also N+1-particle ground state is generated with a corresponding accuracy, provided interaction of the additional electron and the N particle ground state are correctly depicted. In some sense, Rücker’s approach is a formal and more rigorous embodiment of Harrison’s model. Results of the band gap predictions of the LDA and SX are presented in Figure 3. The improvement of the SX predictions from the consistently underestimated gaps predicted by the LDA is obvious. With the addition of SX to the structural property predictions of LDA, ab initio theory can now reliably generate all the numbers needed for insertion into statistical theories to accurately simulate performance and processing of semiconductor devices. The next section provides examples of this capability.
The LDA and LDA+SX predicted energy gaps, versus the experimental values for all the common semiconductor materials. Screened exchange obviously corrects the major errors in the LDA predictions.
3. Equilibrium Thermodynamic Properties
3.1 Bulk Compounds
The two most common phases reported for the III-nitrides are the hexagonal wurtzite structure and the cubic zinc blende structure, the wurtzite structure being the ground state for each case; transformation to a third polymorph, the rock salt structure, is observed under pressure [Reference Elwell and Elwell12,Reference Christensen and Gorczyca13]. Calculated and experimental lattice constants of AlN, GaN, and InN in the zinc blende and wurtzite structures are summarized in Reference [Reference Bi and Tu14]. The agreement between theory and available experiment is quite good; as a general rule, the LDA accurately predicts structural properties in compounds where the electrons are itinerant. Because wurtzite is the lowest energy state of the III-nitrides, there is far less experiment information on their properties in the zinc blende phase, although the latter phase is of interest because of the possibility of alloying the nitrides with other cubic III-V compounds.
3.2 Nitride-Based Alloys
Cation-substituted alloys are attractive candidates for optoelectronic, high-temperature, and high-power device applications because of the flexibility they offer to tune both the lattice constant and band gap. While alloys can be formed by mixing constituents on the cation and/or sublattice, most attention has been focused on alloys where the substitution is on the cation sublattice—for example, GaInN and AlGaN which form the basis for blue and green LEDs and laser diodes [Reference Nakamura15]. The mixed group V alloys have been the subject of fewer experimental investigations, owing to the enormous size difference between nitrogen and the other group V elements, and the resulting large miscibility gap.
3.3 Electronic Properties
The band structure of the nitride-based compounds and alloys is fundamental to the determination of electronic and optical properties exploited in device design. In this section the band structures of nitride compounds in both the zinc blende and wurtzite structures are discussed. The properties of the alloys are also discussed. Finally, some unusual features of the GaN band structure, and the impact that it has on the hot-electron properties are examined.
Compound Band Structures. In the past several years, there have been several band calculations using the local-density [Reference Christensen and Gorczyca13,Reference van Schilfgaarde, Sher and Chen2,Reference Fiorentini, Methfessel and Scheffler16-Reference Miwa and Fukumoto18], the GW [Reference Rubio, Corkill, Cohen, Shirley and Louie11,Reference Palummo, Reining, Godby, Bertoni and Börnsen19-Reference Palummo, Del Sole, Reining, Bechstedt and Cappellini20], and the screened exchange (LDA+SX) [Reference van Schilfgaarde, Sher and Chen2] approximations. The agreement between the PWPP and FP-MLTO bands, both calculated within the LDA, is relatively good; a notable difference in the two calculations is in their predictions of the position of the deep s-like bands, which the PWPP cannot expect to reproduce since it lacks hybridization with the deep d levels.
There are two principal errors in band structures calculated using the LDA. The first is that the deep cation d levels in GaN and InN are too high [Reference van Schilfgaarde, Sher and Chen2,Reference Lambrecht, Segall, Strite, Martin, Agarwal, Morkoa and Rockett21]. The second principal error, and the most technologically important, is the tendency of the LDA (as discussed in Section 2) to underestimate the band gap [Reference Jones and Gunnarsson22]; indeed, the LDA gap comes out slightly negative in InN.
The band structures for zinc blende and wurtzite structures of GaN, calculated with the LDA+SX, are shown in Figure 4. The minimum energy gaps are also summarized in Table I, where the LDA, GW, and experimental gaps are also shown for comparison. With the exception of AlN in the zinc blende structures, all of the nitride compounds have direct band gaps.
Energy bands of (a) wurtzite and (b) zinc blende GaN calculated in the LDA+SX. Dotted lines show several of the LDA bands.

Band gaps of AIN, GaN, and InN from various calculations and from experiment. GW energies were taken from Ref. [Reference Rubio, Corkill, Cohen, Shirley and Louie11]. LDA were taken from Ref. [Reference van Schilfgaarde, Sher and Chen2] and LDA+SX were taken from Ref. [Reference van Schilfgaarde, Sher and Chen2] and this work.
| Wurzite | Zinc blende | ||||||||
|---|---|---|---|---|---|---|---|---|---|
 |
|
|
|||||||
| AIN | GaN | InN | AIN | GaN | InN | AIN | GaN | InN | |
| LDA | 4.3 | 1.9 | −0.3 | 4.1 | 1.9 | −0.4 | 3.2 | 6.4 | 2.8 |
| LDA+SX | 6.4 | 3.4 | 0.8 | 6.3 | 3.1 | 0.7 | 5.1 | 4.8 | 4.1 |
| GW | 5.8 | 3.5 | 6.0 | 3.1 | 4.9 | 4.7 | |||
| exp | 6.28 a | 3.5 b | 1.9 c | 3.4 d | |||||
a From Perry and Rutz [Reference Perry and Rutz23].
b From Monemar [Reference Monemar24].
c From Tansley and Foley [Reference Tansley and Foley25].
d From Hong et al. [Reference Hong, Pavlidis, Brown and Rand26].
The GW and LDA+SX theory both produce significant improvement to the LDA bands, although there are some discrepancies. In the current implementation, the LDA+SX is more approximate than the GW theory because LDA+SX includes only the long-ranged part of nonlocal screened exchange potential. The deep d orbitals essentially require an on-site, orbital-dependent Hartree-Fock-like exchange, which the current LDA+SX theory lacks. Existing GW calculations pseudize out the deep d orbitals, but presumably an all-electron GW calculation would rectify this error, as it does in ZnSe [Reference Aryasetiawan and Gunnarsson27]. The LDA+SX theory does, however, widen the upper valence bands by the same amount as do GW calculations (compare the full and dotted lines in Figure 4). Furthermore, because a limited basis set consisting of one principal quantum number per l-channel was used in the LDA+SX calculations, the high-lying conduction bands are not very reliable. The InN direct gap is rather badly underestimated. It is not clear at this stage what the origin of the error is. Possibly the deep In d orbitals are inadequately treated; it may be connected with the fact that the starting LDA gap is negative. For further comparisons of the various calculated eigenvalues at some high symmetry points in the Brillouin zone, see Ref. [Reference van Schilfgaarde, Sher and Chen2]. There are some differences in the present SX calculations and those in Ref. [Reference van Schilfgaarde, Sher and Chen2], mainly that f orbitals and the nonspherical corrections to the ASA potential are added here to render the LDA bands almost identical to full-potential ones.
Alloy Band Structures. Calculating the properties of random alloys is, in general, a far more difficult task than calculating the properties of the compounds, and several calculational approaches are generally applied to the problem. In the virtual crystal approximation (VCA), the alloy is modeled by replacing the varying potential due to the alloy disorder by an average potential, approximated by a compositional-weighted average of the potentials of the constituents. Such a crude approximation can be expected to produce poor results in predicting the properties of the nitride alloys, particularly those of the anion-substituted alloys for which there are large chemical and bond length differences. Strong scattering theories such as the coherent potential approximation (CPA) build upon the VCA by including a complex self-energy to describe the alloy inhomogeneities (see Ref. [Reference Chen and Sher1] and references therein). The CPA theory can include both on-site disorder arising from differences in diagonal terms in the potential, and off-site or off-diagonal disorder arising from differences in bond lengths. Wei et al. developed a method particularly well suited to the entrenched supercell method of the ab initio methods in which relatively small supercells, or special quasi-random structures (SQS), are specified to reproduce the expected atom-atom correlation function in a fully random structure [Reference Wei, Ferreira, Bernard and Zunger28]. Finally, averaging over samplings of random configurations can also be used to predict the composition-dependent properties of alloys.
In many cases, the band gap of the alloy A1−xBxC is fit to the function form

where b is the bowing parameter. Several theoretical calculations have been directed at the properties of the technologically important cation-substituted nitride alloys [Reference Kim, Limpigumnong, Lambrecht and Segall29-Reference Wright and Nelson31]. From 32-atom supercells in the wurtzite (zinc blende) structure, van Schilfgaarde calculated the bowing parameter in the cation-substituted nitrides [Reference van Schilfgaarde, Sher and Chen2] and found b = 0.3(0.6) for AlGaN, b = 3.6(3.5) for AlInN, and b = 1.7(1.3) for GaInN. Two values for the experimental bowing parameters for AlGaN have been reported: ∼0 eV [Reference Bellaiche, Wei and Zunger30,Reference Wright and Nelson31] and ∼1 eV [Reference Khan, Skogman, Schulze and Gershenzon32,Reference Wickenden, Bargeron, Bryden, Miragliotta and Kistenmacher33].
More dramatic changes in the energy bands are observed in the anion-substituted nitride alloys. Analogous behavior is not observed in the cation-substituted nitride-based alloys discussed above. Several authors noted that there is a strong localization of the band edge wave functions in GaAsN [Reference Khan, Koide, Itoh, Sawaki and Akasaki34,Reference Koide, Khan, Hiramatu, Sawaki and Akasaki35] and AlAsN [Reference Khan, Koide, Itoh, Sawaki and Akasaki34] owing to large chemical and size differences between nitrogen and arsenic. The localization is extremely sensitive to the alloy concentration, the detailed configuration of the impurities, and the lattice relaxation around the impurities. Bellaiche et al. [Reference Rubio and Cohen36] used empirical pseudopotentials with large, fully relaxed, randomly occupied supercells to examine the properties of the anion-substituted alloys GaPN and GaAsN, and found substantial compositional-dependent downward bowing of the band gap, comparable to experiment. In the dilute alloy, impuritylike levels in the band gap associated with the minority constituents, were predicted at ∼0.6 eV for phosphorus in GaN and at ∼0.75 eV for arsenic in GaN. LDA calculations of a single impurity in large supercells of 216 atoms reveal similar localized levels, though they tend to appear to be resonances in the valence band and near the valence-band maximum, rather than localized states within the gap [Reference Neugebauer and Van de Walle37], as Bellaiche and Zunger found.
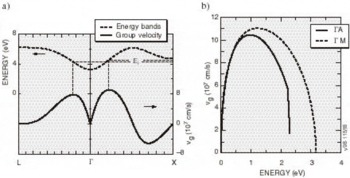
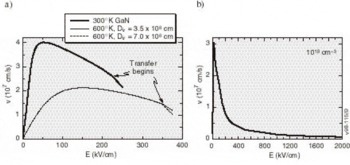
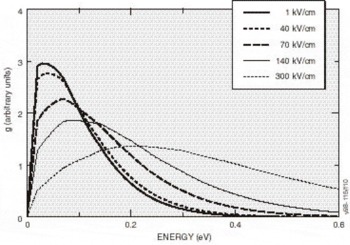
High-Field Transport. Transport calculations have been reported for several nitride alloys in both zinc blende and wurtzite structures [Reference Bellaiche, Wei and Zunger38-Reference Gelmont, Kim and Shur41]. Because the calculation of the hot electron transport is sensitive to details of the band structures employed, results reported in these works differ substantially. In the work by Krishnamurthy et al. [Reference Bellaiche, Wei and Zunger38], a hybride empirical tight-binding pseudopotential Hamiltonian was fit to the nitride band structures calculated using the LDA+SX discussed above. For GaN in both the zinc blende and wurtzite crystal structures, LDA+SX predicts that the central valley inflection points in both structures lies below the energy separation between the central valley minimum and the bottom of the first satellite valley. This character is illustrated in Figure 5a for the zinc blende phase and Figure 5b for the wurtzite phase of GaN; aside from the nitrides, this has not been found in any other group IV, III-V compound, or II-VI compound seminconductor. Also, the empirically derived nitride band structures used in other transport studies of the nitrides apparently did not possess this property [Reference Schilfgaarde39-Reference Gelmont, Kim and Shur41]. As a consequence of the inflection point lying below the minimum of the first satellite valley, an anomalous drift velocity-field characteristic is predicted, shown in Figures 6a and 6b. While these velocity-field curves superficially resemble that of other materials, the mechanism responsible for the peak is quite different in GaN. Although the peak group velocity occurs at the inflection point (Figure 5), the electron effective mass goes to infinity at the reflection point, and becomes negative above it, where electrons are then decelerated by the applied field. This deceleration by the field results in the peak in the drift velocity being reached before electrons have sufficient energy to transfer to the satellite valley. The anomalous negative differential resistance velocity-field curves are supported by examination of the electron distribution. Tracking the electrons in various valleys indicates that all of the electrons remain in the Γ valley for fields well above that at which the peak in the drift velocity occurs, indicating that the negative differential resistance is caused by band structure features in the Γ valley, rather than by scattering into a satellite valley. Electron populations at 300 K as a function of energy for different field strengths applied in the (100) direction in the zinc blende structure are plotted in Figure 7, where drifted distributions are found. The peak drift velocity predicted for GaN is quite high, and is comparable to that of the best found in other materials [Reference Chen and Sher1], and the breakdown fields for GaN will probably be enormous.
The conduction band structure and group velocity in (a) zinc blende and (b) wurtzite GaN. The inflection point corresponds to a maximum in the group velocity.
Velocity-field characteristics (a) at 300°K and 600°K for zinc blende GaN and (b) at 300°K for wurtzite GaN with carrier concentrations of 1018 cm−3. Arrows indicate the fields at which the intervalley scattering begins to be important.
Electron distribution at 300°K along the (100) direction for several applied electric fields. For fields below 225 kV/cm, nearly all of them remain in the central Γ-valley.
Hot electron device designs will have to take account of the reported anomalous behavior. For example, GaN-based devices that require high peak drift velocity-field products will work well, but those like the Gunn oscillator, whose speed depends on the drift velocity that occurs after the valley in the velocity-field curve, are not likely to fare well. Also, devices that depend on avalanche breakdown may not function well. A more complete examination of these questions needs to be undertaken.
4 Summary
Theoretical predictions of the structural properties of the nitride-based compounds have been shown to be in good agreement with experiment. For AlInN, GaInN, and the mixed group V alloys, large miscibility gaps are predicted due mostly to the large size mismatch among the constituents.
Both LDA+SX band structures for the nitride compounds have been presented and predict band gaps that are in good agreement with experiment. Based on a fit to the LDA+SX bands, the velocity-field characteristics of the nitrides have been examined and have been found to show some anomalies due to the inflection point lying below any higher-lying minima. This anomaly must be taken into account in designing hot-electron devices.
Acknowledgments
This work was supported by the Defense Advanced Research Projects Agency and the Electric Power Research Institute through a subcontract with the University of Florida, Contract No. UF-EIS-9809001-SRI.






