


Introduction
Ice cores are one of the best proxy climate indicators and are therefore important in reconstructing past climate conditions. the longest continuous instrumental records from Antarctica only cover the period since 1956, and therefore ice cores are important for extending the climate record back in time and improving spatial coverage. An important step in converting ice-core proxy data to climate information is the calibration of recent ice-core data with available climatic and instrumental records.
Dronning Maud Land (DML) was until recently one of the scientifically least explored parts of Antarctica. However, research activity has increased with the European Project for Ice Coring in Antarctica (EPICA), whose main objective is to drill deep ice cores through the Last Glacial Maximum. As part of EPICA, several pre-site surveys have been completed in the area. Most effort has been put into high-latitude interior areas (e.g. Reference OerterOerter and others, 1999, Reference Oerter2000; Reference KarlöfKarlöf and others, 2000), with only a few new coastal records recovered (e.g. Reference Isaksson, Pinglot and GundestrupIsaksson and others, 1999). Because long-term climate records have been the focus of most palaeoclimate studies in Antarctica, relatively few coastal cores, which could provide good shorter-term records, have been recovered.
Global-warming scenarios predict an increase in Antarctic precipitation due to an increase in the moisture-holding capacity of the atmosphere, so reports of accumulation increases that could indicate such a change have received much attention (e.g. Reference Morgan, Goodwin, Etheridge and WookeyMorgan and others, 1991; Reference Mosley-ThompsonMosley-Thompson and others, 1995). Circulation changes can affect the position of storm tracks (Reference King and TurnerKing and Turner, 1997; Reference Noone, Turner and MulvaneyNoone and others, 1999) and lead to high variability in temperature and precipitation. Because most of the precipitation in Antarctica accompanies cyclones, which seldom penetrate very far inland, it is likely that any significant changes in precipitation patterns will be visible in coastal areas first. Recently, different atmospheric models have been used to study interannual variability in Antarctic climate, particularly in precipitation (e.g.Reference Cullather, Bromwich and Van WoertCullather and others, 1996, Reference Cullather, Bromwich and Van1998; Reference Noone, Turner and MulvaneyNoone and others, 1999; Van Lipzig, 1999). Because precipitation mechanisms are different for coast and polar plateau, it is important to obtain good spatial coverage of ice cores from different geographical areas in Antarctica. In this paper we synthesize some shallow ice-core records from coastal DML with respect to accumulation and proxy-temperature variability during the past few decades. Data from all these cores have previously been published (Reference Isaksson and KarlénIsaksson and Karlén, 1994a,Reference Isakssonb; Reference Isaksson, Karlén, Gundestrup, Mayewski, Whitlow and TwicklerIsaksson and others, 1996, Reference Isaksson, Pinglot and Gundestrup1999; Reference MelvoldMelvold,1999; Reference Van den BroekeVan den Broeke and others, 1999), so the dating and quality of the individual cores are not discussed in detail in this paper.
Area Description and Meteorological Conditions
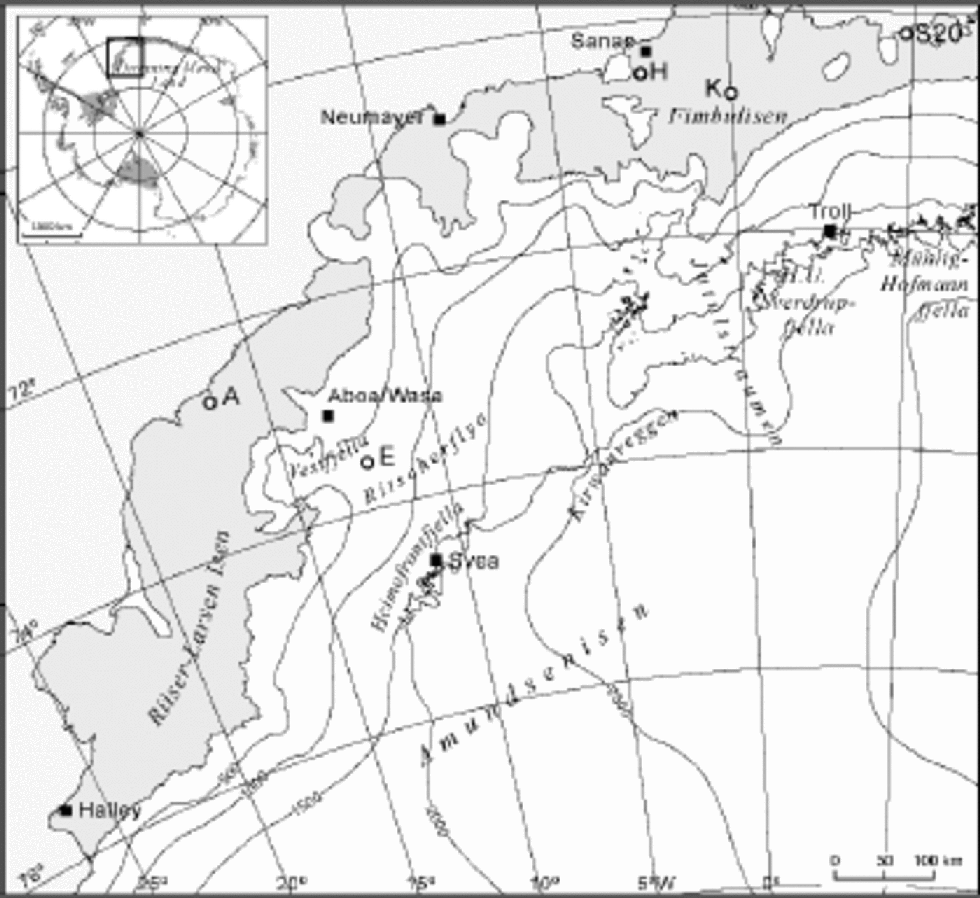
The coastal section of DML comprises several small ice shelves, such as the Riiser–Larsen Ice Shelf and Fimbulisen (Fig.1). the inland ice is largely dammed by mountain ranges (Heimefrontfjella, Kirwanveggen, H.U. Sverdrupfjella and Mühlig-Hofmannfjell), running parallel to the coast. the largest ice stream in the area, Jutulstraumen, drains about 126000 km2. for more details on the area see Reference IsakssonIsaksson and Karlén (1994b) and Reference Melvold and GundestrupMelvold and others (1998). Before EPICA, glaciological work in this part of DML was conducted on several Swedish and Norwegian expeditions. These collected shallow cores, with the main focus on variability in annual accumulation rates and climate interpretation during the last century (Reference Isaksson and KarlénIsaksson and Karlén, 1994a,Reference Isakssonb; Reference Isaksson, Karlén, Gundestrup, Mayewski, Whitlow and TwicklerIsaksson and others, 1996; Reference Melvold and GundestrupMelvold and others, 1998; Reference MelvoldMelvold, 1999). As for Antarctica in general, the specific atmospheric conditions are not well known for this part of DML. Most of the low-pressure systems reaching this area originate in the northern Weddell Sea (Reference King and TurnerKing and Turner, 1997). However, there is significant interannual variability in the atmospheric circulation of the high southern latitudes. the nearest meteorological records available are from the Halley and South African National Antarctic Expedition (SANAE) stations (Fig. 1), both of which cover the period from 1956 to the present.
Map of part of DML with the core sites (open circles) and geographical names mentioned in the text. Stations in the area are marked with black squares.
Data Presentation
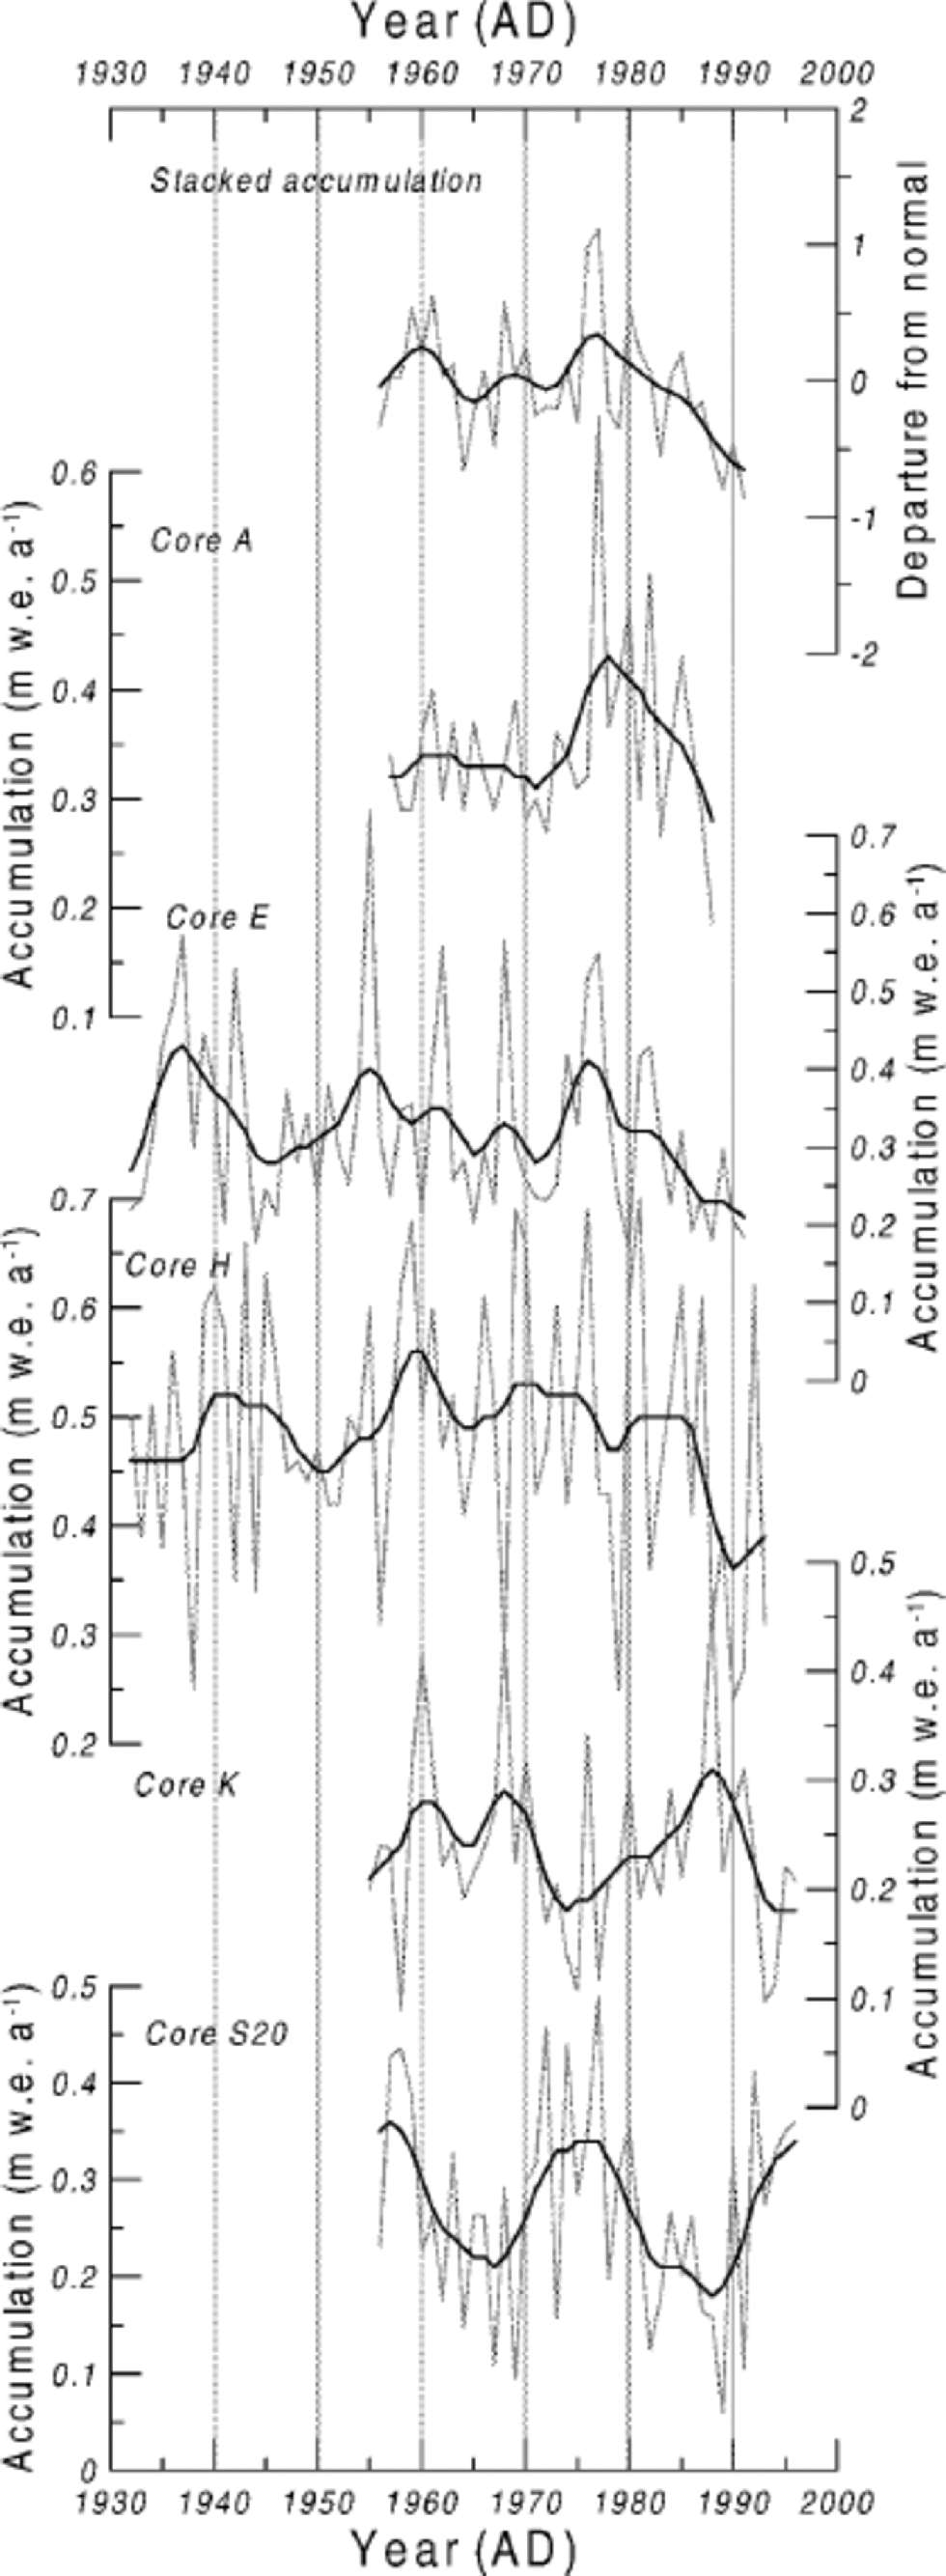
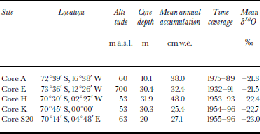
Core locations and site data are shown in Figure 1 and Table 1. All the cores were drilled with a Polar Ice Coring Office (PICO) hand-auger system. Stacked records have been produced by averaging normalized annual core data from the following ice cores (Fig. 2 and 3):
Annual accumulation records from the five cores described in the text. the stacked record was produced by averaging normalized annual core data. Site information is included in Table1.
Annual oxygen isotope records from five cores. the stacked record was produced by averaging normalized annual core data. the site information is included in Table 1. Mean annual temperature records from Halley and SANAE are included for comparison.

Core-site information
CoreA was collected in 1989 and sampled with 5 cm resolution for δ18O. It was dated back to 1976 based on its well-developed δ18O stratigraphy, and the dating error is ±1year. An extended accumulation record was produced using older data from the vicinity (Orheim and others, 1986), which partially overlap in time. This composite record is discussed in Reference IsakssonIsaksson and Karlén (1994b). the dating error for the compiled record may be greater than ±1year. the δ18O record is not available for this longer time period, so data from this core are used only in the accumulation stack.
Core E was collected in 1992 and sampled with 5 cm resolution for δ18O. It was dated counting summer peaks, with additional control by the electrical conductivity measurement (ECM) record. A comparison with the Halley annual temperature record suggests that the dating error is in the order of ±3 years (Reference Isaksson, Karlén, Gundestrup, Mayewski, Whitlow and TwicklerIsaksson and others, 1996).
Core H was drilled in 1994 and sampled with 3.5 cm resolution and 10–15 cm resolution for radioactive isotopes. the oxygen isotope stratigraphy was used to count summer peaks back to 1954. the dating was constrained using the radioactivity peaks found in the core, which appear in 1964/65 and 1954 (Reference MelvoldMelvold, 1999). the estimated dating error is ±1year. An extended accumulation record was produced using older data from the vicinity from Reference LundeLunde (1961) and Reference NeethlingNeethling (1970), which partially overlap in time (Reference MelvoldMelvold,1999).
Core K was collected in 1997 and sampled with 2.5 cm resolution for δ18O. the core was dated counting δ18O summer peaks, with additional control from radioactive time horizons. the estimated dating error is ±2 years. the record is discussed further in Reference MelvoldMelvold (1999).
Core S20 was drilled in 1997 and sampled with 4–5 cm resolution. the variations in the oxygen isotope stratigraphy and the ECM record were used to date the core back to 1955. the dating error is estimated to be ±3 years, based on ambiguities in the δ18O stratigraphy (Reference Isaksson, Pinglot and GundestrupIsaksson and others, 1999; Reference Van den BroekeVan den Broeke and others, 1999).
Sea-ice records: We used Weddell Sea ice-extent data at 10˚W, based on passive-microwave emission from 1973–98 (available at http://www.antcrc.utas.edu.au/~jacka/seaice.html), and a fast-ice duration record from Signy Island in the South Orkney Islands (Reference Murphy, Clarke, Symon and PriddleMurphy and others, 1995) (Fig. 4).
August sea-ice record from Weddell Sea at 10˚W (thick line) and the fast-ice duration record from Signy Island; the SOI index; the mean annual temperature record from Halley; and the stacked accumulation and oxygen isotope records from this study.

Temperature records: the Halley temperature record is the longest continuous record from the Antarctic continent and begins in 1956 (available from British Antarctic Survey at http://www.antarctica.ac.uk) (Fig. 3). the SANAE temperature record was obtained from the South AfricanWeather Bureau (Fig. 3).
Results and Discussion
Accumulation variability
Not surprisingly, there is high variability in the accumulation rate between individual years and sites (Fig. 2). Interannual variability has been monitored using stake measurements for some years along a transect from the coast and inland (including sites A and E), and these data show 30% variation from one year to the next (Reference IsakssonIsaksson and Karlén,1994b). A high temporal variability in accumulation is characteristic of flat coastal areas like DML, where atmospheric disturbances are frequent and can penetrate relatively far inland (Van Lipzig, 1999).
Several of our accumulation records indicate above-average accumulation in the first part of the 1970s, with a substantial decrease thereafter (Fig. 2). This decrease has been reported in our earlier work and seems to include both the immediate coastal area and the escarpment area (core E) (Reference IsakssonIsaksson and Karlén, 1994b; Reference Isaksson, Karlén, Gundestrup, Mayewski, Whitlow and TwicklerIsaksson and others, 1996; Reference MelvoldMelvold, 1999). the stacked accumulation record corresponds more closely with the temperature record from SANAE than with that from Halley (Table 2). the relatively low correlation coefficient may reflect the different trends in the instrumental records during the second half of the 1980s (Fig. 3). During this period the accumulation shows a pronounced decrease, while temperature increases. At Neumayer (Fig. 1) the number of low-pressure systems moving in over the ice shelf during the 1980s is reported to have decreased (Reference SchlosserSchlosser,1999), which would explain the decrease in accumulation seen in our ice-core records.
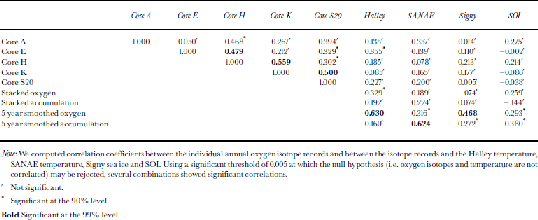
Correlation matrix between the cores and the climatic indicators discussed in the text
Oxygen-isotope variability
The overall pattern in the δ18O records is remarkably similar in the four cores, considering their geographical spread (Fig. 3). We found significant correlation between the oxygen isotope records in cores E and H, H and K, and K and S20, respectively (Table 2). Less significant correlations exist between cores A and H, E and S20, and Hand S20, respectively. the isotope record from core A covers only 14 years, which may account for the lack of correlation with other cores. the similarities point towards a common moisture source and indicate that the general circulation conditions predominate over local differences at the core sites. There is no significant trend in the oxygen isotope records, but there are some common features: all four cores show depleted δ18O values (indicating colder conditions) at the beginning of the 1960s, a positive anomaly during the 1970s and a short pronounced negative anomaly in the early 1980s. Only one of the individual annual δ18O records (core E) shows a significant correlation with Halley, with a correlation coefficient of 0.36 (Table 2). One likely reason for this is that this is the longest of the δ18O records. the annual stacked δ18O record and the Halley temperature have a correlation coefficient of 0.33, probably reflecting the geographical distance between the records. of course, in an optimal case all the cores in the stacked record would be from a restricted geographical area.
A pronounced feature in all the individual δ18O records is the negative values at the beginning of the 1980s (Fig. 3). Both temperature records indicate colder conditions in this period, but nothing exceptional compared to the rest of the record. As we discuss further below, it is likely that the anomalous δ18O values are not directly temperature-related but reflect circulation changes that occurred during the strong El Niño–Southern Oscillation (ENSO) event of 1982–83 (Fig. 4). In the stacked δ18O record, there is a defined positive peak in 1976 and 1977. This could be related to an additional local moisture source during winter, such as the Weddell polynya, which appeared during the winters of 1974–76 (Reference CarseyCarsey, 1980) in this sector of DML. Its large size makes it likely that the polynya affected the regional climate during this period.
Reference SchlosserSchlosser (1999) shows that annual averaged δ18O values in snow at Neumayer are highly dependent on the temporal accumulation distribution through the year, so the δ18O record is not a reliable temperature indicator on shorter time-scales. Our work suggests that the δ18O records do reflect both temperature and the large-scale climatic conditions in the surrounding area and that individual events are sometimes recorded. As others have concluded in studies of annually resolved ice-core data (e.g.Reference WhiteWhite and others, 1997), the most reliable results on shorter time-scales are obtained using stacked records.
Links to sea ice and Southern Oscillation Index (SOI)
Our knowledge of sea-ice extent around the Antarctic continent is limited to information from satellite data since 1973 (Reference JackaJacka,1990). These data show no trend and high interannual variability in both time and space. A record of fast-ice duration reaching back to 1903 is available from Signy Island and suggests a decline in sea ice during this period (Reference Murphy, Clarke, Symon and PriddleMurphy and others, 1995). A comparison between the data from Signy Island and the satellite data suggests that the former record reflects the larger-scale dynamics in the Weddell Sea.
The stacked accumulation and δ18O records show a relatively good correspondence between 1955 and 1985 (Fig. 4). However, there is a clear deviation in the latter part of the record, in which accumulation decreases while δ18O increases. According to the passive-microwave data, the Weddell Sea ice extent has been increasing since about 1985. This may have caused the cyclonic paths to take a more northerly route causing less precipitation, which fits Reference SchlosserSchlosser’s (1999) observations from Neumayer.
The location of the primary moisture source for Antarctica is widely debated (e.g. Reference Delaygue, Masson, Jouzel, Koster and HealyDelaygue and others, 2000). Modelling studies suggest a source in the mid-latitudes, while observational studies favour a source further south, near the pack-ice edge (Reference BromwichBromwich, 1988). Reference Bromwich and WeaverBromwich and Weaver (1983) postulate that sea ice controls the δ18O in coastal Antarctic precipitation since it is the determining factor for the primary moisture source. This means that the δ18O record, in an optimal case, would be a good sea-ice proxy. Our results seem to support this idea, as the smoothed δ18O record was found to correlate significantly with the Signy sea-ice duration (Table 2). the smoothed δ18O record is also well correlated to the smoothed Halley temperature.
The accumulation decrease and the observed increase in the Weddell Sea ice extent since the mid-1980s may be related to Southern Hemisphere circulation patterns such as ENSO and the Semi-Annual Oscillation (SAO). When investigating temperature records from East Antarctica, Reference Van den BroekeVan den Broeke (1998) found that warm ENSO events (negative SOI) correspond with strong westerlies, a weakening of the SAO, andcold temperatures in East Antarctica. SAO has the largest impact on Antarctic temperatures, and there has been a weakening of SOI since about 1975, resulting in cooling due to a decrease in the meridional air exchange (Reference Van den BroekeVan den Broeke, 1998, Reference Van den Broeke2000). Meteorological records show that warm ENSO events are associated with cold Antarctic temperatures (Reference Savage, Stearns and WeidnerSavage and others, 1988; Reference Van den BroekeVan den Broeke, 1998). Furthermore, the colder temperatures seem to be associated with higher wind speeds at the coastal stations, i.e. an increase in the katabatic winds, which could be one explanation for the pronounced negative δ18O values in our ice cores during the strong ENSO of 1982– 83. In addition, variations in precipitation correlated with ENSO have been reported from the South Pacific sector (Reference Cullather, Bromwich and Van WoertCullather and others, 1996), and an Antarctic sea-ice and ENSO connection was previously suggested by several investigators. Reference GloersenGloersen (1995) presented time series of sea-ice cover from Antarctica showing the same periodicities as ENSO, and Reference Simmonds and JackaSimmonds and Jacka (1995) suggested a strong relationship between SOI and Antarctic sea-ice anomalies. Evidently, ENSO affects Antarctic climatic conditions in multiple ways.
The complicated nature of interactions in the climatic system on interannual time-scales around Antarctica has been demonstrated by Reference White and PetersonWhite and Peterson (1996) through the Antarctic Circumpolar Wave (ACW), a system of coupled anomalies in atmospheric pressure at sea level, wind stress, sea surface temperature and sea-ice extent over the Southern Ocean. Over a period of 4–5 years this system of anomalies, initiated in the equatorial Pacific and associated with El Niño, moves eastwards around the continent. Reference White and PetersonWhite and Peterson’s (1996) study showed that the low-latitude climate affects the high latitudes more or less directly, but there are still many unresolved problems surrounding the connection between the tropics and Antarctic climate (Reference King and TurnerKing and Turner, 1997, and references therein).
Reference MelvoldMelvold (1999) applied spectral analysis to the accumulation record from core H and found dominant periodicities of 4 and 12 years and increased accumulation during most of the ENSO years covered by this core. Thismay indicate links to other meteorological phenomena with similar periodicity such as the ACW, SAO and ENSO. These phenomena influence cyclonic patterns and sea-ice extent, but the physical processes controlling the periodicity are still not understood. Reference Noone, Turner and MulvaneyNoone and others (1999) used European Centre for Medium-Range Weather Forecasts data to show that storms affecting the high-altitude polar plateau in DML are influenced by ENSO and SAO. In their study, the 1982–83 ENSO event is associated with a higher than normal precipitation rate on this part of the polar plateau. However, neither the individual nor the stacked accumulation records used in our study reveal a consistent pattern of accumulation during periods with negative SOI (Fig. 2 and 4).
Conclusions
Our results suggest that both the accumulation and δ18O records from coastal DML ice cores contain a record of local climatic conditions, based on the correspondence of the stacked records with the instrumental temperature records, sea ice and ENSO. the accumulation records of individual cores show high annual variability, indicating that the accumulation pattern is very local; nevertheless, there are similar overall decadal trends. In one case, a specific climate event (ENSO1982–83) seems to be recorded in the δ18O records in all the cores we used in this study. However, we believe that only on rare occasions will individual records provide sufficient climatic information at annual resolution, and to obtain a reasonable detailed climatic history it is necessary to average several cores, preferably in close proximity to one another.
Acknowledgements
We wish to thank those who helped collect and analyze the cores. In particular, we thank W. Karlén, J.O. Hagen and J.-G.Winther for their support, N. Gundestrup who provided the oxygen isotope analysis, and J.F. Pinglo. who determined the radioactive time horizons. E. Murphy kindly provided the sea-ice data from Signy, A. Estoppey drew the map and J. Kohle. improved the English. We appreciate the helpful comments of E. Steig, D. Schneider and an anonymous reviewer.



