I. INTRODUCTION
Cancer, defined as the cells with uncontrolled growth and proliferation, has become the second leading cause of death worldwide.Reference Siegel, Miller and Jemal1 As one of the most common malignant cancers, liver cancer seriously threatens human health. Nowadays, the commonly used treatments of liver cancer are surgery and drug chemotherapy at an early stage.Reference Pez, Lopez, Kim, Wands, de Fromentel and Merle2 Despite the significant effects of these clinical therapies, the drawbacks and limitations still exist: the recurrence and metastasis rates are very high after surgery; the clinical drugs used in chemotherapy may eradicate cancer cells, at the same time harm the normal tissues, which can cause severe toxic side effects.Reference Feng and Chien3,Reference Power and Kemeny4 Therefore, more and more researchers focus on the development of antitumor drugs to achieve a higher drug efficacy as well as minimum toxic side effects.
Since quaternary phosphonium salts (QPS) were found to have the ability to selectively inhibit the growth of cancer cells,Reference Rideout, Calogeropoulou, Jaworski, Dagnino and McCarthy5,Reference Manetta, Gambo, Nasseri, Podnos, Emma, Dorion, Rawlings, Carpenter, Bustamante, Patel and Rideout6 it was found in the next research studies that the QPS had antitumor effects on colon cancer, ovarian cancer, liver cancer, renal cancer, and breast cancer cells.Reference Kumar and Malhotra7,Reference Bachowska, Kazmierczak-Baranska, Cieslak, Nawrot, Szczęsna, Skalik and Bałczewski8 Triphenylphosphonium salt (TPP), one of the widely used QPS, possesses a special structure, which can form delocalized lipophilic cations with positive charge itself.Reference Wang, Shao, Zhang and Cheng9 It has been reported that TPP can preferentially transfer from an aqueous to the hydrophobic environment, and selectively accumulate in the mitochondria of cancer cells because of the higher transmembrane potentials than that in normal cells.Reference Boddapati, Tongcharoensirikul, Hanson, D’Souza, Torchilin and Weissig10–Reference Yamada and Harashima12 The connecting efficiency between TPP and the mitochondria depends on the lipophilic nature and delocalized positive charge of TPP. As a result, TPP has been used to modify some molecules and polymers to achieve drug targeted delivery.Reference Wang, Shao, Zhang and Cheng9,Reference Zhang, Shen, Teng, Yan, Bi and Morais13–Reference Zhou, Zhao, Ma, Ju, Li, Li, Sun, Shi, Zhang and Lu15 Callahan et al.Reference Callahan and Kopeček16 reported that BODIPY FL-labeled semitelechelic HPMA (N-(2-hydroxypropyl)methacrylamide) copolymers, which possessed a single terminal lipophilic TPP and low molecular weight (<5 kDa), exhibited significant organelle localization in the isolated mouse liver mitochondria. Biswas et al.Reference Biswas, Dodwadkar, Piroyan and Torchilin11 found that the surface modification of poly(amidoamine) (PAMAM) dendrimers with TPP could reserve the mitochondria-targeting ability of TPP. Dong et al.Reference Dong, Jameson, Tilly, Prochazka, Rohlena, Valis, Truksa, Zobalova, Mahdavian, Kluckova, Stantic, Stursa, Freeman, Witting, Norberg, Goodwin, Salvatore, Novotna, Turanek, Ledvina, Hozak, Zhivotovsky, Coster, Ralph, Smith and Neuzil17 reported that the Mito VES (mitochondrially targeted analog of vitamin E succinate), which modified VES by tagging the TPP compound, showed better antitumor activity than VES and precisely located in the mitochondria of cancer cells. Besides, TPP also exhibits cytotoxicity against cancer cells. Cooper et al.Reference Cooper, Bartier, Rideout and Delikatny18 investigated the antitumor activity of (triphenylphosphoniummethyl) benzaldehyde chloride and [4-(hydrazinocarboxy)-1-butyl] tris-(4-dimethylaminophenyl) phosphonium chloride, and the results showed that both compounds selectively inhibited cell growth and proliferation in breast cancer cells. Several studies also reported that TPP with different alkyl chain lengths of space or conjugated with other compounds showed different efficiencies of toxicity on cancer cells, and the higher cytotoxicity was observed with the increased density of TPP.Reference Bachowska, Kazmierczak-Baranska, Cieslak, Nawrot, Szczęsna, Skalik and Bałczewski8,Reference Bielski, Zhong, Brown and da Rocha19,Reference Wang, Wang, Wu, Song, Guo, Zhang, Ma and Tan20 Therefore, TPP could be a prospective compound for clinical therapy of cancer.
Chitosan, a natural linear macromolecule derived from chitin, is the cationic polysaccharideReference Rinaudo21 and has received extensive interest in the biomedical applications due to its favorable biological properties, such as biodegradability, antioxidant activity, biocompatibility, nontoxicity, and antimicrobial activity.Reference Liu, Jiao, Wang, Zhou and Zhang22–Reference Hsu, Chang, Tsai, Fu, Wang and Tseng24 Besides, considerable research studies reported that chitosan could also exhibit antitumor activities by inducing apoptosis, enhancing immune functions, and inhibiting cell proliferation,Reference Maeda and Kimura25–Reference Gibot, Chabaud, Bouhout, Bolduc, Auger and Moulin27 which makes chitosan a promising biomedical material in oncotherapy. Although the poor water-solubility of chitosan will restrict its applications, it can be greatly approved after various modifications, e.g., quaternary ammonium/phosphonium chitosan,Reference Wang, Xu, Guo, Peng and Tang28,Reference Qian, Xu, Shen, Li and Guo29 and the antitumor effects of chitosan can be hopefully promoted by conjugating with QPS.
To date, there are no previous research studies investigating the antitumor activity of triphenylphosphonium chitosan and its antitumor mechanism of action. Thus, in our present work, (3-carboxypropyl) triphenylphosphonium bromide chitosan (TPPB-CS) was synthesized by the activated ester-mediated modification of chitosan and the structure was characterized. The antitumor efficacy of TPPB-CS in vitro and in vivo was evaluated, and the mechanism of action was preliminarily investigated.
II. MATERIALS AND METHODS
A. Materials
Chitosan (deacetylation degree of 91.13%, viscosity average molecular weight of 22 kDa) was purchased from Guangzhou Qiyun Biotech-Ltd. (Guangzhou, China). (3-Carboxypropyl) triphenylphosphonium bromide (TPPB) was purchased from Aladdin (Shanghai, China), with a purity of 98%. N-(3-dimethyllaminopropyl)-N′-ethylcarbodiimide hydrochloride (EDC·HCl) with a purity of 98.5% and 1-hydroxybenzotrizole (HOBt) with a purity of >97% were purchased from Shanghai Macklin Biochemical Co., Ltd. (Shanghai, China). Fetal bovine serum (FBS) and 5-fluorouracil (5-Fu) were supplied by Jianyang Biotech-Ltd. (Guangzhou, China). Minimum Essential Medium (MEM) and Dulbecco’s Modified Eagle Medium (DMEM) were obtained from GIBCO (Grand Island, NY). Other chemicals used were all of analytical grade and purchased from Sigma-Aldrich (St. Louis, Missouri).
B. Preparation of triphenylphosphonium bromide chitosan
The preparation of TPPB-CS was synthesized on the basis of the study of Guo et al.Reference Wang, Xu, Guo, Peng and Tang28,Reference Qian, Xu, Shen, Li and Guo29 with little modification. Briefly, 400 mg chitosan and 664 mg HOBt were added into H2O/DMSO (v/v = 2/1) solution (30 mL), and the mixture was stirred for several hours at 20 °C until the white homogenous mixture was obtained. A certain amount of TPPB which dissolved in H2O/DMSO (v/v = 2/1) was added into the solution after adjusting the pH of white homogenous mixture to 4.8–5.5, then a solution of EDC·HCl (940 mg) in H2O/DMSO (v/v = 2/1, 9 mL) was added dropwise. The reaction was carried out in the ice bath for 24 h and the resultant mixture was precipitated in acetone/diethyl ether (v/v = 2/1), followed by drying under vacuum overnight and dialyzing (MWCO = 3000) for 3 d, and finally the products were obtained by freeze drying in a lyophilizer.
C. Characterization
1. 1H NMR spectroscopy
The structures of chitosan and TPPB-CS were confirmed by 1H NMR spectra which were obtained from a BRUKER AV 500 spectrometer (Dresden, Germany). Chitosan and TPPB-CS were dissolved in D2O/CH3COOH (v/v = 98/2) and D2O at room temperature, respectively.
2. FT-IR spectroscopy
The FT-IR spectra of TPPB-CS and chitosan, which were prepared as the KBr pellet, were recorded on a FT-IR spectrometer (Perkin Elmer Co., Waltham, Massachusetts) with the scan range of 400–4000 cm−1 while using the KBr pellet as a blank sample.
3. Measurements of zeta potential
Chitosan, TPPB, and TPPB-CS were added into deionized water to form suspension or solution (1 mg/mL), respectively. The zeta potential was measured by Zetasizer Nano ZS (Malvern Instruments Ltd., Malvern, United Kingdom) at room temperature.
4. Calculation of the degrees of substitution of TPPB-CS
TPPB-CS reacted with 8 mL of nitric acid by heating till a yellow solution was obtained. After adding 6 mL of perchloric acid into the solution and continuous heating, a colorless solution was obtained and transferred to 100 mL volumetric flask. The content of P atom in TPPB-CS was obtained by inductively coupled plasma-atomic emission spectrometry (ICP-AES) (Thermo Fisher, Waltham, Massachusetts), and the degrees of substitution (DS) of TPPB-CS were calculated by the following formula:
 $${\rm{DS}} = {{{n_{{\rm{P}}\;{\rm{atom}}}}} / {{n_{{\rm{N}}\;{\rm{atom}}}}}} \times 100\% \quad .$$
D. Cell culture and animals
Mouse embryonic fibroblast NIH3T3 (3T3) cells, human osteosarcoma cell (MG-63) cell line, and human hepatocellular liver carcinoma (HepG2) cell line were offered by Medical Laboratory, Jinan University, China. HepG2 and MG-63 cells were cultured at 37 °C in 5% CO2 in MEM (Gibco, Grand Island, New York) supplemented with 10% (v/v) FBS (Gibco, Grand Island, New York). 3T3 cells were grown in DMEM (Gibco, Grand Island, New York) supplemented with 10% (v/v) FBS and incubated at 37 °C in 5% CO2. Cells were passed using ethylene diamine tetraacetic acid containing 0.25% trypsin every 3–4 days.
Twenty female BALB/c-nu mice weighing 13 g were purchased from Guangdong Medical Laboratory Animal Center, Foshan, China. All animals were handled in accordance with the guidelines of Guangdong Province Experimental Animal Management Committee, and experiments were in compliance with the National Institutes of Health Guide for the Care and Use of Laboratory Animals.
E. Cell cytotoxicity
The cytotoxicity of the complexes was investigated using a Cell Counting Kit-8 (CCK8) assay, Jianyang Biotech-Ltd., Guangzhou, China. NIH3T3(3T3) cells were detached and made into suspension solution at a density of 5–10 × 104 cells/mL, then seeded in 96-well culture plates and incubated at 37 °C in an atmosphere of 5% CO2 for 24 h. A TPPB-CS solution of 200 μL, which was dissolved in DMEM, was added to each well at different concentrations (1, 10, 50, 100, and 500 μg/mL) while set a positive control (5-Fu) with equivalent concentration and dosage of TPPB-CS and a complete medium without TPPB-CS as the negative control. After incubation for 48 and 72 h, CCK-8 solution (20 μL) was added to each well and incubated for another 4 h. The plate was then read at 450 nm on Bio-Rad iMark™ (Bio-Rad Laboratories, Inc., Tokyo, Japan). Each experiment was repeated three times. MG-63 and HepG2 followed the procedure mentioned above. The cell relative growth rate (RGR) was determined using the following formula:
 $${\rm{RGR}}\;\left( \% \right) = {{\left( {{\rm{O}}{{\rm{D}}_{{\rm{sample}}}} - {\rm{O}}{{\rm{D}}_{{\rm{blank}}}}} \right)} / {\left( {{\rm{O}}{{\rm{D}}_{{\rm{negative}}\;{\rm{control}}}} - {\rm{O}}{{\rm{D}}_{{\rm{blank}}}}} \right)}} \times 100\% \quad ,$$
where ODsample represents the cell absorbance treated with TPPB-CS and ODnegative control represents the cell absorbance treated without TPPB-CS.
F. Transwell migration assay and invasion assay
Cell migration was assayed using a Transwell membrane chamber (6.5 mm inserts, 8.0 μm pore size, Corning Incorporated, Corning, New York). HepG2 cells were resuspended in MEM without FBS and added to the upper inserts with a density of 7 × 10⁴ cells/well. 600 μL of MEM containing 10% (v/v) FBS used as the chemoattractant was added to the bottom and both of upper and bottom chambers were incubated with 100 μL of TPPB-CS1 (10, 50, and 100 μg/mL). After 18 h incubation at 37 °C, cells from the upper chamber were gently wiped by cotton swabs. The migrating cells were fixed in methanol in the bottom chamber for 30 min and stained with 0.1% crystal violet for 20 min. After washing several times, the chamber was observed under the microscope (Axiovert 200, Carl Zeiss, Shanghai, China) and photographs of migrating cells were taken at 100× magnification. Cell migration was determined by measuring the stain intensities at 570 nm on a Bio-Rad iMark™ microplate reader, Bio-Rad Labratories, Inc., Tokyo, Japan, using 33% acetic acid to dissolve crystal violet. Each assay was repeated three times and the inhibition rate of migration (IRM/%) was calculated using the following formula:
 $${\rm{I}}{{\rm{R}}_{\rm{M}}}\;\left( \% \right) = \left( {1 - {{{\rm{O}}{{\rm{D}}_{{\rm{sample}}}}} / {{\rm{O}}{{\rm{D}}_{{\rm{negative}}\;{\rm{control}}}}}}} \right) \times 100\% \quad ,$$
where ODsample represents the cell absorbance treated with TPPB-CS and ODnegative control represents the cell absorbance treated without TPPB-CS.
Transwell matrigel invasion assay using Transwell chambers (8 mm pore size; Corning Incorporated, Corning, New York) precoated with 20 μL matrigel (Jianyang Biotech-Ltd., Guangzhou, China) was used to determined cell invasion. After precoating the matrigel, the invasion assay followed the procedure mentioned above and the inhibition rate of invasion (IRI/%) was calculated using the following formula:
 $${\rm{I}}{{\rm{R}}_{\rm{I}}}\;\left( \% \right) = \left( {1 - {{{\rm{O}}{{\rm{D}}_{{\rm{sample}}}}} / {{\rm{O}}{{\rm{D}}_{{\rm{negative}}\;{\rm{control}}}}}}} \right) \times 100\% \quad ,$$
where ODsample represents the cell absorbance treated with TPPB-CS and ODnegative control represents the cell absorbance treated without TPPB-CS.
G. Antitumor experiment in vivo
H22 cells were restarted from nitrogen canister and were cultured at 37 °C in 5% CO2 for 48 h. After being detached and centrifuged, H22 cells were resuspended by physiological saline and adjusted at a concentration of 2.5 × 10⁷ cells/mL. The cells were injected in BALB/c-nu mouse abdominal cavity while the mouse was fed normally for 3–4 days. The H22-bearing mouse was then killed by using the method of dislocated cervical vertebra and the H22 cells were extracted, washed, and centrifuged from the ascites. Single-H22 cell suspensions were prepared by physiological saline and 200 μL of suspensions (approximately 5 × 10⁶ cells/mouse) were injected subcutaneously in the right axilla to twenty mice.Reference Zhou, Zhao, Ma, Ju, Li, Li, Sun, Shi, Zhang and Lu15 The mice were randomly divided into four groups (five mice each), and after tumor implantation (marked 0 day), physiological saline (negative control, 0.5 mL/mouse), 5-Fu (positive control, 25 mg/kg), and different doses of TPPB-CS1 (5 mg/kg, 50 mg/kg) were administrated into mice via peritoneal injection at 1, 3, 5, 7, 9, and 11 days, respectively. The mice were monitored every three days for tumor progression. After the last administration, the mice were fasting for 24 h. Blood was collected from the orbital venous of each mouse. The mice were then killed and tumor tissue of each mouse were stripped intactly and weighed. The tumor volume was calculated with the following formula:
 $$V = {\rm{length}} \times {{{\rm{widt}}{{\rm{h}}^2}} / {2\left( {{\rm{m}}{{\rm{m}}^3}} \right)\quad ,}}$$
where length and width represent the tumor diameters.
The inhibition growth rate of the H22 tumor was determined by the following formula:
 $${\rm{IR}}\;\left( \% \right) = \left( {1 - {{{W_{{\rm{sample}}}}} / {{W_{{\rm{negative}}\;{\rm{control}}}}}}} \right) \times 100\quad ,$$
where W sample represents the tumor weight of TPPB-CS group and 5-Fu group and W negative control represents the tumor weight of the saline group.
H. Measurement of the cell cycle
HepG2 cells were incubated with or without TPPB-CS1 at different concentrations (10, 50, and 100 μg/mL) for 48 h. Then cells were resuspended and fixed in ice-cold 70% ethanol at 4 °C overnight. After being centrifuged, the cells were treated with RNase A (Sigma-Aldrich, St. Louis, Missouri) for 30 min, followed by incubation with propidium iodide (Sigma-Aldrich, St. Louis, Missouri) evaded the light preservation for 15 min. The cell cycle was analyzed by using a flow cytometer (BD FACSAria, BD Biosciences, San Jose, California).
I. Reactive oxygen species level and mitochondrial transmembrane potential (∆ψm)
To investigate the level of reactive oxygen species (ROS) with 2,7-dichlorofluorescin diacetate (DCFH-DA) in cells, HepG2 cells were seeded in 6-well plates and incubated for 24 h, then treated with various concentrations of complexes for 48 h. After treatment, cells were washed twice with PBS and treated with 10 μM DCFH-DA at 37 °C for 30 min. After washing twice, the fluorescence intensities of cells were measured by using a flow cytometer.
To detect the changes of the mitochondrial transmembrane potential (∆ψm), a conventional cationic voltage-sensitive probe JC-1 was used in this experiment. Briefly, HepG2 cells were cultured and treated with TPPB-CS1 as described above. After incubation with JC-1 for 20 min and washing twice, the cells were analyzed by flow cytometry.
J. Assay of vascular endothelial growth factor and TNF-α
Mouse serum was isolated by centrifugation (2000 × g) using a centrifuge (KDC-160HR, ZONKIA, Hefei, China) and the supernatant was collected and stored at −20 °C. The level of vascular endothelial growth factor (VEGF) and TNF-α was analyzed by enzyme-linked immunosorbent assay (ELISA) kits (R&D Systems, Inc. Minneapolis, Minnesota), following the manufacturer’s protocols.
K. Statistical analysis
All the results are expressed as the mean ± standard deviation (SD) of three independent experiments unless otherwise specified. Data were analyzed by SPSS 16.0 and *P < 0.05 was regarded as statistically significant.
III. RESULTS AND DISCUSSION
A. Preparation and characterization of TPPB-CS
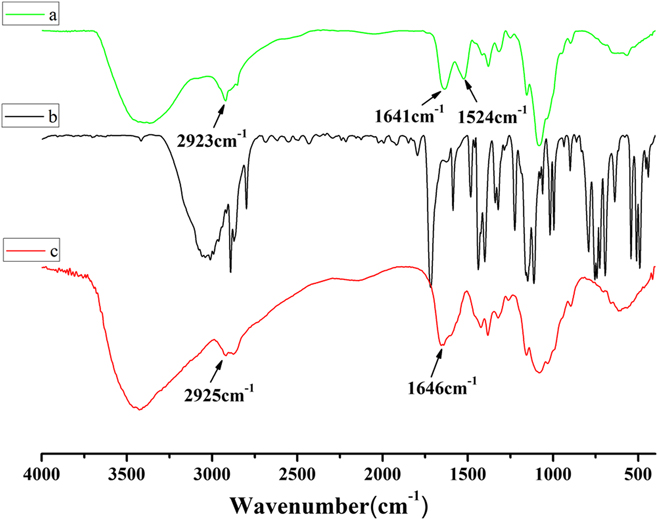
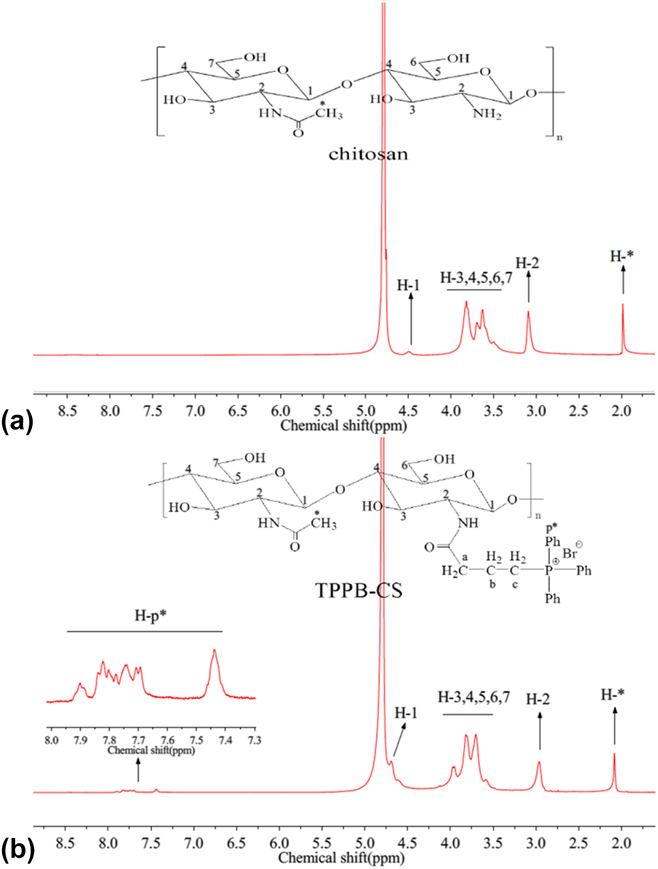
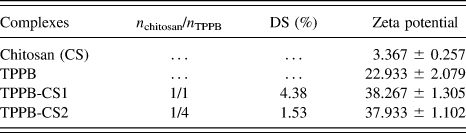
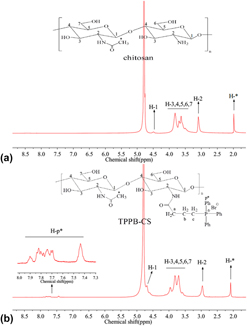
The FT-IR spectra of TPPB-CS, TPPB, and chitosan from 400 to 4000 cm−1 are shown in Fig. 1(a). In TPPB-CS, there was a new absorption peak presenting at 1524 cm−1 [Fig. 1(a)], corresponding to the absorption bands of the benzene rings C=C.Reference Rajamani, Muthu and Karabacak30 The intensity of the C–H stretching vibration at 2923 cm−1 increased and the N–H bending vibration at 1641 cm−1 became weak, and both peaks were a little blue shift compared with that of chitosan in Fig. 1(c). Moreover, compared to the spectrum of chitosan, there was no vibration peak of the ester group appearing at 1720–1770 cm−1 in the spectrum of TPPB-CS, demonstrating that TPPB mainly reacted with the amino groups of chitosan. The 1H NMR spectra of chitosan and TPPB-CS are shown in Fig. 2. Comparing to the 1H NMR spectrum of chitosan, new signals between 7.4 and 8.0 ppm appeared on the spectrum of TPPB-CS, which is the characteristic shift of the benzene rings in triphenylphosphonium groups.Reference Wang, Xu, Guo, Peng and Tang28,Reference Li, Liu, Zeng and Ao31 The signals of methylene in TPPB could not be observed clearly due to the overlaps by the chitosan backbone. With different contents of TPPB, the DS of TPPB-CS1 and TPPB-CS2 was calculated as 4.38% and 1.53%, respectively (Table I). The DS became lower with increased TPPB content, which probably due to the strong steric hindrance of benzene groups of TPPB and the limited efficiency of the initiator (EDC·HCl) in the reaction. In general, all the above observed in the spectra of FT-IR and 1H NMR confirm that TPPB was successfully introduced into chitosan by reacting with amino groups.
FT-IR spectra of TPPB-CS1 (a), TPPB (b), and chitosan (c), respectively.

1H NMR spectra of chitosan (a) and TPPB-CS1 (b) with the solvent of D2O.

DS of TPPB-CS calculated based on ICP-AES and zeta potential of chitosan, TPPB, and TPPB-CS.

B. Cytotoxicity in vitro
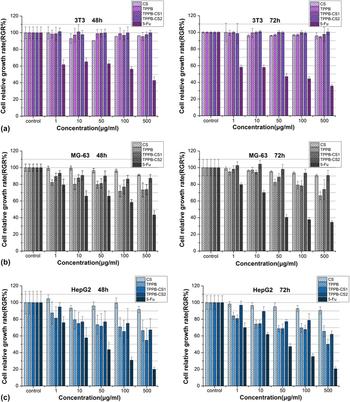
The cytotoxicity of complexes in three kinds of cell lines was assessed using the CCK-8 assay. The cell lines were incubated with complexes for 48 and 72 h and also used a clinical antitumor agent 5-Fu as the positive control. As shown in Fig. 3, the results showed that the cell RGR of three different cell lines treated with chitosan was all above 90% which demonstrated that chitosan exhibited almost nontoxicity in all experimental cell lines. On the other hand, the TPPB-CS group exhibited selective growth inhibition in different cells, i.e., caused a significant toxicity in cancer cell lines (MG-63 and HepG2 cells) but nontoxicity in 3T3 normal cells and greater toxicity in the HepG2 cell than in the MG-63 cell. This result might be connected to the higher mitochondrial transmembrane potential in tumor cells than in the 3T3 normal cell. As the unique property of triphenylphosphonium compound, which could preferentially transfer and accumulate in the mitochondrion of higher transmembrane potential,Reference Biswas, Dodwadkar, Piroyan and Torchilin11,Reference Yamada and Harashima12 more TPPB-CS accumulated in tumor cells than that accumulated in the 3T3 normal cell, and thus exhibited selective growth inhibition. Also, in HepG2 cancer cell lines [Figs. 3(b) and 3(c)], as the concentration of TPPB and TPPB-CS complexes increased to 500 μg/mL, the cell RGR declined correspondingly. The RGR and the IC50 (1.031 ± 0.324 mM of TPPB, 0.603 ± 0.247 mM of TPPB-CS1 and 0.793 ± 0.099 mM of TPPB-CS2 in 48 h; 1.110 ± 0.046 mM of TPPB, 0.659 ± 0.119 mM of TPPB-CS1 and 0.853 ± 0.154 mM of TPPB-CS2 in 72 h) between 48 and 72 h showed no significant difference, which indicated that the cytotoxicity of TPPB and TPPB-CS was concentration-dependent but not time-dependent. Moreover, with the DS of complexes increased, a higher toxicity was observed, which might be related to the potentials of complexes. As mentioned above, appropriately raising the potentials of TPP might be one of the effective approaches to enhance its antitumor activity.Reference Wang, Peng, Yang, You, Teng, Tang, Zhang and Li14,Reference Cooper, Bartier, Rideout and Delikatny18 Notably, compared to the TPPB-CS complexes, 5-Fu had caused a high toxicity (Fig. 3) in both cancer cells (2.100 ± 0.599 mM of IC50 in MG-63 cell and 0.792 ± 0.141 mM in the HepG2 cell in 48 h; 1.131 ± 0.171 mM in the MG-63 cell and 0.838 ± 0.075 in the HepG2 cell in 72 h) and normal cells (2.158 ± 0.167 mM of IC50 in 48 h and 0.912 ± 0.350 mM in 72 h). Thus, the cytocytoxicity showed that the selective growth inhibition of TPPB-CS in vitro might make it possess the potentiality to avoid toxic side effects in vivo. Additionally, TPPB-CS1 was selected to be used in the subsequent experiments due to its greater inhibition in HepG2 cells.
Cytotoxicity assay of chitosan (CS), TPPB, TPPB-CS, and 5-Fu on 3T3 (a), MG-63 (b), and HepG2 (c) cells in vitro.

C. Effects of TPPB-CS complexes on migration and invasion in HepG2 in vitro
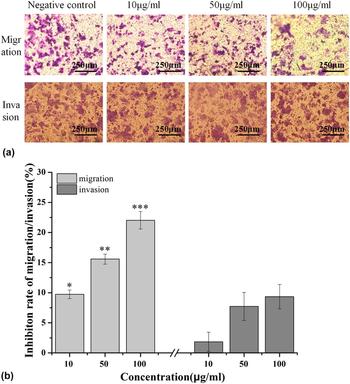
As it is known, tumor cells can cause great harm to human lives by spreading to other tissues or organs because of its metastatic and invasive ability. A recent research study reported that cell migration could influence the processes of tumor angiogenesis, tumor invasion, and tumor metastasis.Reference Chen, Wang, Xue, Li, Sun, Xue and Chai32 Liu and his colleaguesReference Jiang, Han, Li, Yang and Liu33,Reference Jiang, Han, Li, Li, Yang and Liu34 had reported that the water soluble carboxymethyl chitosan possessed antitumor activity by inhibiting tumor cell migration and tumor angiogenesis. To evaluate whether TPPB-CS complexes possess the capacity of inhibiting tumor migration and invasion, Transwell assay with and without matrigel was performed on HepG2 cells. It was found that TPPB-CS exhibited an effective inhibition on migration of HepG2 cells (P < 0.01) in Fig. 4(a), as well as a concentration-dependent manner in Fig. 4(b) (left side). In contrast to the results on migration, although TPPB-CS showed a concentration-dependent manner on inhibiting cell invasion, the invasive inhibition rate of TPPB-CS complexes was just below 10% [Fig. 4(b), right side], which showed no significant differences on invasion in vitro (P > 0.05). These findings indicated that the TPPB-CS complexes might mainly induce HepG2 cells’ growth inhibition by inhibiting cell metastasis and proliferation.
Transwell assay on migration and invasion of HepG2 cells after incubation with TPPB-CS1 for 18 h and 48 h, respectively. (a) Photographs of cells adhering to the bottom of chambers (100× magnification); (b) Inhibition rate of migration/invasion was determined by measuring the crystal violet-stained intensities on the microplate reader. Data represent mean ± SD (n = 3); *P < 0.05, **P < 0.01, ***P < 0.001 was regarded as statistically significant compared with negative control.

D. Antitumor effects of TPPB-CS complexes in H22-bearing mice in vivo
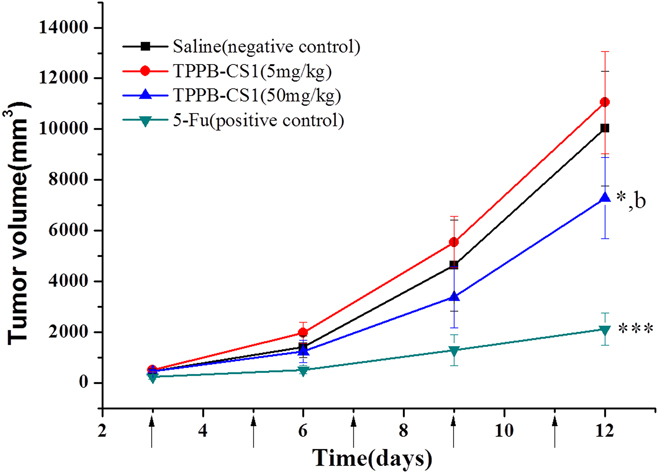
Considering that TPPB-CS complexes had an effective antitumor activity in vitro at high concentration, the capability of TPPB-CS to inhibit tumor growth in vivo was investigated. The tumor volume growth in H22 tumor-bearing BALB/c-nu female mice model shown in Fig. 5 illustrated that compared with the negative control, the high-dose group of TPPB-CS complexes showed an effect on inhibiting the tumor growth (P < 0.05) while the low-dose group was opposite. Quantitative analysis of antitumor effects on administration of different drugs is shown in Table II, and the positive control group of 5-Fu showed the greater antitumor effect than the high-dose group of TPPB-CS (IR of 5-Fu group and TPPB-CS group was 69.68% and 19.94%, respectively, P < 0.01) and also high dose of TPPB-CS group showed a significant difference comparing to the saline group (P < 0.05), which was in consistent with the results of cytotoxicity in vitro. However, because of its toxic side effects,Reference Katona, Kralovánszky, Rosta, Pandi, Fónyad, Tóth and Jeney35,Reference Wettergren, Carlsson, Odin and Gustavsson36 there were only three mice in the 5-Fu group survived, whereas all mice were survived in high-dose group of TPPB-CS. This situation implied that TPPB-CS caused little toxic side effects in vivo compared to 5-Fu group. This potentiality of TPPB-CS might be attributed to its selective growth inhibition in different cell lines.
Changes of H22 tumor volume in BALB/c-nu mice. The arrows represent the drug administrated time. Data represent mean ± SD (n = 5), *P < 0.05 and ***P < 0.001 versus saline negative control; b, P < 0.01 versus 5-Fu positive control.

Tumor weight and its inhibitory growth rate in H22 tumor-bearing BALB/c-nu female mice after administration of different drugs.

Data represent mean ± SD (n = 5), *P < 0.05 and ***P < 0.001 versus saline negative control; a, P < 0.001 and b, P < 0.01 versus 5-Fu positive control.
E. Influence of TPPB-CS complexes on cell cycle, cell ROS level, and mitochondrial transmembrane potential
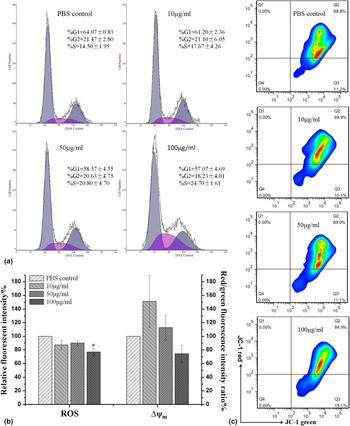
To preliminarily investigate the antitumor mechanism of the TPPB-CS complex treatment in HepG2 cells, cell cycle analysis, cell ROS level, and mitochondrial transmembrane potential (∆ψm) were tested. As shown in Fig. 6(a), no apoptotic peak could be observed in HepG2 cells after TPPB-CS1 treatment, and the TPPB-CS group showed an effect on the distribution of S phase in HepG2 cells. Compared with cells in the S phase (14.50%) of the PBS control group, when the concentration of TPPB-CS1 increased from 10 μg/mL to 100 μg/mL, the distribution in the S phase increased to 17.67%, 20.80%, and 24.70%, respectively. These results demonstrated that TPPB-CS could affect the cell cycle of Hepg2 cells in the S phase in a concentration-dependent manner and play an important role in inhibiting the proliferation of HepG2 cells in vitro. Thus, to delay the cell cycle in the S phase might be one of the antitumor mechanisms of TPPB-CS.
Influences of different concentrations of TPPB-CS1 (10, 50, and 100 μg/mL) complexes on cell cycle, cell ROS level, and mitochondrial transmembrane potential (∆ψm) in HepG2 cells, whereas cell cycle, ROS, and ∆ψm were stained by PI, DCFH-DA, and JC-1, respectively. (a) The cell cycle of HepG2 cells treated with different concentrations of TPPB-CS1 for 48 h and cells in G1, S, and G2 phases were calculated by MultiCycle software. (b) The relative fluorescence intensity and red/green (high ∆ψm/low ∆ψm) fluorescence intensity ratio, represented the ROS level and changes of ∆ψm, were measured by flow cytometry. (c) Pictures of quantitative analysis in ∆ψm from fluorescence assay. Data represent mean ± SD (n = 3); *P < 0.05 was regarded as statistically significant compared with PBS control.

ROS, a natural chemical molecule of aerobic respiration and aerobic metabolism, plays an important role in injuring cancer cells.Reference Pelicano, Carney and Huang37 Several studies indicate that the improvement of the level of ROS can obviously induce apoptosis of cancer cellsReference Wu, Dipietrantonio and Hsieh38–Reference Ralph, Moreno-Sánchez, Neuzil and Rodríguez-Enríquez40 due to the more excessive production of ROS in cancer cells than in normal cells.Reference Hileman, Liu, Albitar, Keating and Huang41 Because the mitochondria are indispensable organelles of the cells as well as the major site for ROS production, especially in cancer cells the higher transmembrane potentials of mitochondria play an important role in maintaining physiological functions,Reference Boddapati, Tongcharoensirikul, Hanson, D’Souza, Torchilin and Weissig10–Reference Yamada and Harashima12 the fluctuation of the ROS level might be accompanied by the change of Δψm and ultimately influence proliferation, metastasis and apoptosis of cancer cells. Thus, the impact on the ROS level and ∆ψm in HepG2 cells after incubation with TPPB-CS1 was examined by using the flow cytometer using the stains of DCFH-DA and JC-1. The relative fluorescent intensity and red/green (high ∆ψm/low ∆ψm) fluorescence intensity rato represented the ROS level and changes of ∆ψm, respectively. As shown in Fig. 6(b), after incubation with TPPB-CS1 for 48 h, there was a maximum reduction from 151.31% to 74.35% of ∆ψm and a decrease in ROS level to 85.25%, 90.04%, and 77.15%, respectively (compared with PBS control), which demonstrated that TPPB-CS could reduce the level of ROS and ∆ψm in concentration-dependent manner. Based on these results, it could be inferred that the cell growth inhibition of TPPB-CS might be related to eliminating excessive ROS in HepG2 cells, which was partially consistent with previous reports.Reference Qin, Chen, Zhou, Gong and Han42,Reference Qin, Pan, Tang, Zhou and Gong43 Meanwhile, no significant differences were observed in the JC-1 green fluorescent cells of TPPB-CS groups [Fig. 6(c)] and in the red/green fluorescence intensity ratio (P > 0.05). This was likely because TPPB-CS did not disrupt the mitochondrial membrane integrity but just influenced the mitochondrial function. Therefore, these data indicated that the antitumor mechanism of TPPB-CS may be attributed to affecting ROS production and the change of Δψm in mitochondria, so that influenced the proliferation and metastasis of cancer cells.
F. ELISA assay of VEGF and TNF-α in mouse serum
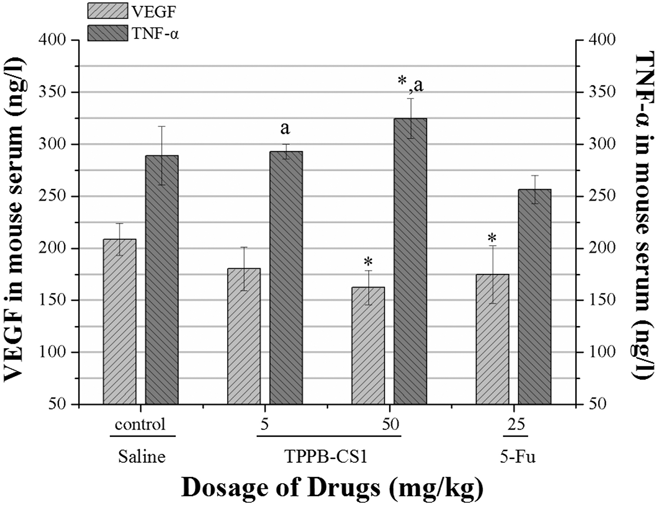
VEGF, a key factor playing important role in angiogenesis, is abundantly produced by a large percentage of tumor cells.Reference Ohm and Carbone44 There are some reports demonstrating that VEGF has a relation to tumor cell growth, invasion, and migration.Reference Ni, Sun, Dong, Sun, Zhao, Liu and Gu45 These findings drive researchers consider the possibility of VEGF as a new way for antitumor therapy. TNF-α is an inflammatory cytokine which is produced by activated macrophage. It has been found that TNF-α can activate apoptosis-related factors and pathways to induce tumor cell apoptosis, regulate the processes of tumor growth and invasion as well as influence the vascular functions.Reference Varfolomeev and Ashkenazi46,Reference Ji, Cao, Yang, Zhang, Iwamoto, Lim, Nakamura, Andersson, Wang, Sun, Dissing, He, Yang and Cao47 TNF-α has also been reported that it shows significant cytotoxicity to tumor cells at high concentrations, but at low concentration, it could increase tumor growth,Reference Li, Vincent, Cates, Brantley-Sieders, Polk and Young48 regulate processes of tumor metastasis,Reference Kim, Takahashi, Lin, Descargues, Grivennikov, Kim, Luo and Karin49 and promote tumor angiogenesis by influencing the production of VEGF.Reference Mantovani, Allavena, Sica and Balkwill50 Considering their unique functions on affecting tumor growth and metastasis and even tumor angiogenesis, VEGF and TNF-α were investigated by ELISA assay. It is found in Fig. 7 that compared with saline control, the VEGF level in the mice serum of the TPPB-CS group was decreased while the TNF-α level was opposite. And at a higher dose, the TPPB-CS group could more significantly regulate VEGF and TNF-α level which suggested that the changes of VEGF and TNF-α level may be one of the antitumor mechanisms for TPPB-CS. However, it needs more studies to further understand the mechanisms how TPPB-CS inhibits tumor cells growth and regulates the relevant factors.
Content of VEGF and TNF-α in mouse serum analyzed by ELISA assay. Data represent mean ± SD, n = 3 (the serum of three mice were randomly chosen from each group), *P < 0.05 versus saline negative control; a, P < 0.05 versus 5-Fu positive control.

IV. CONCLUSION
In our research, TPPB-CS was synthesized by the activated ester-mediated modification. The antitumor efficacy of TPPB-CS including cytotoxicity, cell migration and invasion in HepG2 cells in vitro, and H22-bearing mice in vivo were investigated. The results indicate that TPPB-CS shows selectivity-toxicity among different cell lines and also exhibits a significant inhibitory effect on cell migration but not on cell invasion in HepG2 cells. TPPB-CS can inhibit tumor growth at a high dose administration in vivo. Furthermore, the antitumor mechanism of TPPB-CS was also investigated in our study. With the treatment of TPPB-CS in HepG2 cells, the cell cycle in the S phase has been delayed. Meanwhile, a reduction of the ∆ψm level and the ROS production have been observed. During the experiment in vivo, TPPB-CS has been proved that it can regulate the expression of VEGF and TNF-α. All the aspects mentioned above could be part of the antitumor mechanism of TPPB-CS. In general, TPPB-CS may become a promising antitumor drug for clinical therapy that desires further studies to understand its antitumor mechanisms.
ACKNOWLEDGMENT
This work was supported by National Natural Science Foundation of China (No. 209760868/B060805).