


A substantial body of research in American politics explores the impact of “racial threat” (Key Reference Key1949) on White Americans’ political attitudes and behavior. As summarized in prior scholarship (Enos Reference Enos2016; Oliver Reference Oliver2010; Cho and Baer Reference Tam Cho and Baer2011; see Online Appendix A for an expanded review), this literature is beset with conflicting findings, with one of the primary contributing factors being the problem of selection bias. Indeed, this research typically analyzes the impact of the size of geographically proximate racial minority populations on Whites using observational data, limiting causal inference due to concerns over the non-random nature of minority settlement patterns and residential selection among Whites (Clark Reference Clark1992). Prior scholarship has attempted to assuage these concerns by controlling for self-reported neighborhood racial preferences (Oliver and Wong Reference Oliver and Wong2003), performing endogeneity tests (Rocha and Espino Reference Rocha and Espino2009), demonstrating that racial orientations are not predictive of respondents’ racial context (Branton and Jones Reference Branton and Jones2005), and using instrumental variables (Acharya, Blackwell, and Sen Reference Acharya, Blackwell and Sen2016). Additionally, scholarship has attempted to bypass this issue altogether by using survey and field experiments (Glaser Reference Glaser2003; Enos Reference Enos2014). A promising direction taken in recent research is the identification of events where large changes in minority populations occurred and characteristics of the event facilitate causal inference, typically by mitigating concerns about selection bias. Examples include the influx of African American evacuees from New Orleans into neighboring cities following Hurricane Katrina (Hopkins Reference Hopkins2012) and the exodus of African American residents from Whites’ neighborhoods following the demolition of public housing in Chicago (Enos Reference Enos2016).
In this letter, we identify a previously overlooked event in American history that provides useful features for gaining insight on the effect of racial context on White voter behavior. Following the First Great Migration (1910-1930) of African Americans out of the American South to Northeastern cities (Gregory Reference Gregory2005), a second and larger exodus of African Americans out of the South (1941-1970) resulted in a massive and unprecedented migration to the American West—most notably to the state of California (Wilkerson Reference Wilkerson2011). Dubbed the Second Great Migration (SGM), this event provides a useful test of racial threat, as African Americans previously constituted an almost non-existent share of the California population. Residential choice among Anglo-Californians prior to the SGM occurred largely in the absence of Black residents, distinguishing this event from the vast majority of existing studies of racial threat where the Whites under study had long-standing contact with African Americans and residential decisions were made with regard to racial demographics (Freund Reference Freund2007).
We leverage this historical event to evaluate the impact of proximity to areas undergoing rapid demographic change on White voting for Proposition 14, a California ballot proposition in the 1964 election that sought to exempt the real estate industry and homeowners from anti-discrimination laws (HoSang Reference HoSang2010). Applying theories of racial threat, we expect proximity to rapidly diversifying cities to be associated with stronger support among White voters for Proposition 14. Because many Anglo-Californians in the early 1960s made housing decisions before this demographic shock took place, we have increased confidence that the SGM provides a rare test of racial threat that ameliorates concern over selection bias.
THE SECOND GREAT MIGRATION AND PROPOSITION 14
Throughout the early twentieth century, the African American population in California was small and concentrated in a handful of census tracts designated specifically for non-Whites. The 1940 decennial census, conducted immediately before the start of the SGM, indicates that African Americans comprised less than 2% of the state population and less than 3% of the population in urban counties that would come to house the largest Black populations. Holding aside the Black population, the non-Black minority population in California in 1940 was only 2.7%, leaving the state nearly 96% White.
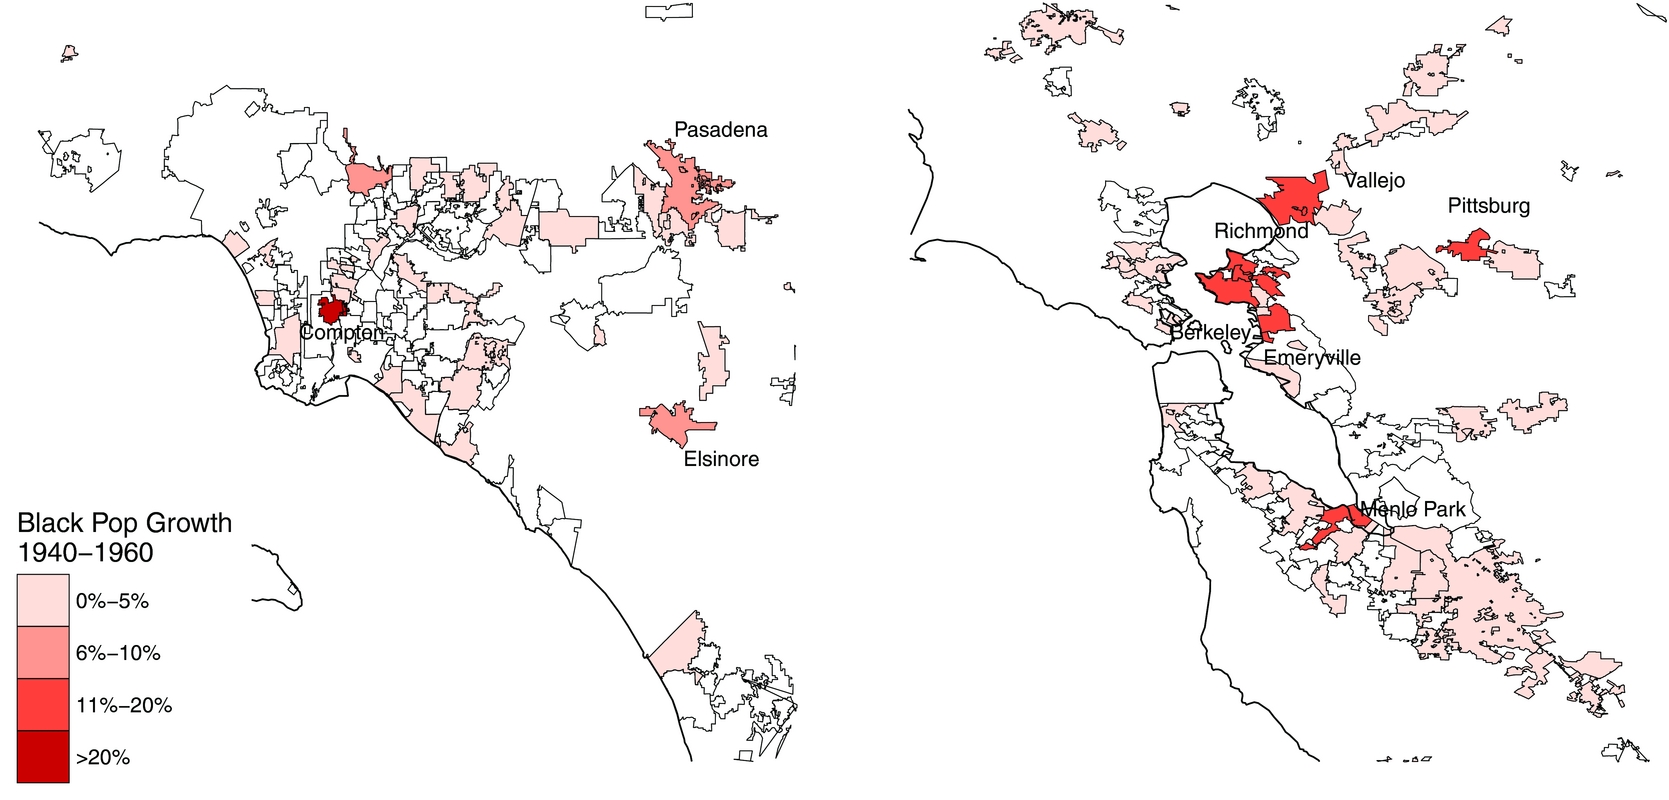
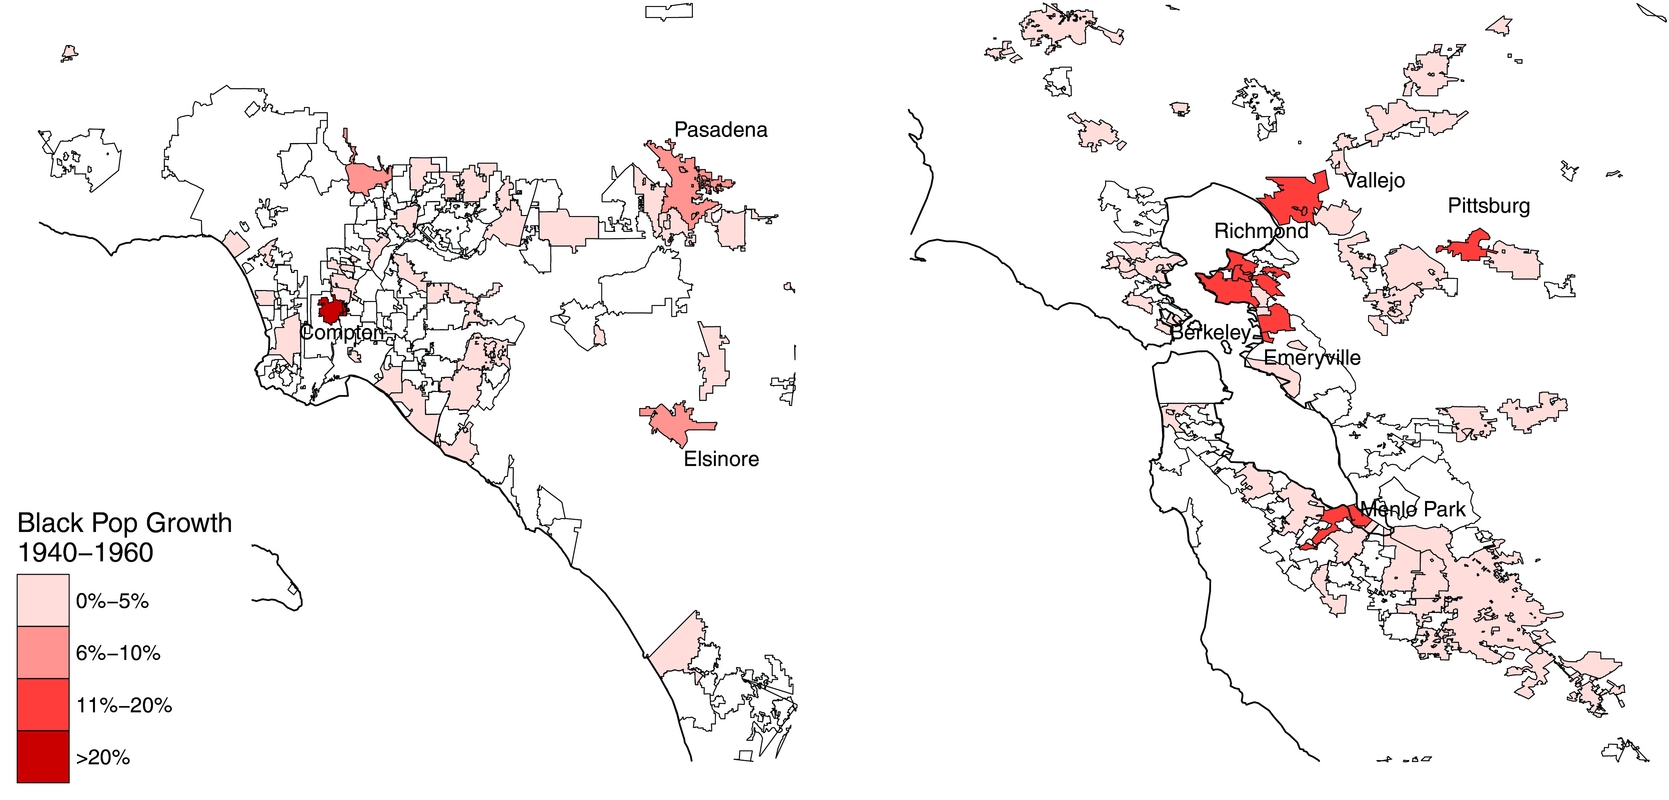
The SGM drastically changed this, and represents one of the largest demographic shocks to White society in contemporary American history. By 1960, California's Black population grew by over 600% to approximately 885,000. In a number of cities, the Black population exploded: Berkeley, Emeryville, Richmond, and Vallejo all saw their Black populations expand by ten percentage points or more. In Compton, the Black population grew from zero to nearly 40 percent by 1960. Figure 1 displays the cities with the highest Black population growth. This population growth strained housing in the few Black neighborhoods throughout the state, increasing demand for housing in neighboring communities (HoSang Reference HoSang2010). As the Black community grew, political elites and homeowners sought to protect White communities from what they saw as a threat to home values and neighborhood identity (Lipsitz Reference Lipsitz1996). Together, these actors maintained racial exclusion through a variety of official and unofficial policies, leading to some of the most entrenched segregation in the nation (HoSang Reference HoSang2010).
Map of Rapidly Growing Black Cities 1940–1960
The election of state legislator William Rumford (D) in 1949 and Governor Pat Brown (D) in 1958 aided in the passage of several anti-discrimination measures, precipitating the White backlash that culminated in Proposition 14. Real estate interests, politicians, and evangelical church leaders coordinated to collect signatures for a proposition to amend the state constitution, protecting what White residents believed was their right to discriminate. The measure, Proposition 14, passed 65 to 35 percent with overwhelming support from White Californians who, according to the CA Field Poll surveys, supported the measure by 3 to 1 (HoSang Reference HoSang2010). Less than one year after the passage of Proposition 14, the Watts Riot broke out in Los Angeles, which was one of the most destructive urban race riots in American history (Queally Reference Queally2015).
In sum, 1940 to 1965 represents a pronounced period of racial change and conflict in the American West, and key features of the SGM afford a unique opportunity to assess the causal effect of racial threat on White voting behavior. First, the residential decisions of the study group (Whites) were largely made in the absence of the treatment group (African Americans). The interpretation of findings from prior observational studies of racial threat are often marred by concerns over selection bias; however, in the case of the SGM, residential decisions by Whites were made largely without consideration of the Black composition of their own or neighboring communities. Second, the migration of African Americans into California was rapid and concentrated in a few cities, increasing our confidence that the 1964 vote preceded much of the White flight that occurred between mid-1960 to 1980 following the Watts Riots, the overturning of Proposition 14 by the Supreme Court, and school desegregation (Schneider Reference Schneider2008). In short, we treat the rapid increase in California's Black population as a racially threatening “shock” to White society and a potentially important source of White support for Proposition 14.
EMPIRICAL STRATEGY AND DATA
As the SGM involved the drastic growth of Black populations in key areas throughout the state of California, our empirical strategy centers upon analyzing the effect of spatial proximity to Black growth cities on White support for Proposition 14. Theories of racial threat are rooted in Key's (Reference Key1949) proposition that White political behavior in the American south was partly a consequence of the presence of African Americans in their communities. More recent work, however, argues that it is the in-migration and growth of an out-group that serves as a motivating shock to White political behavior (Green, Strolovitch, and Wong, Reference Green, Strolovitch and Wong1998; Hopkins Reference Hopkins2009; Newman Reference Newman2013). Following this work, and that by Enos (Reference Enos2016), we conceptualize racial threat as the motivating effect on White political behavior of drastic changes in a spatially proximate Black population. Given that theories of racial threat argue that the psychological salience of a group is a function of its size and spatial proximity (Enos Reference Enos2016), we conceptualize our “treatment” as the proximity of White voters to epicenters of Black population growth.
We constructed a dataset from historical administrative data from the U.S. Census Bureau and the Office of the Secretary of State. The data is provided at the Census place (i.e., city) level, the finest level of aggregation we could acquire from historical sources. In total, our full dataset includes voting results for 392 cities in California. Because we are primarily interested in White voting behavior, we subset the data for our analyses to cities that were 90% or greater White (n = 340) in 1960. Our dependent variable is city-level vote for Proposition 14 (mean = 65.7%, sd = 10.6%) as reported by the 1964 California Secretary of State Supplement to the Statement of the Vote. Our key independent variable is city proximity to its nearest Black growth city. To calculate this measure, we used city-level demographic estimates from the 1940 and 1960 U.S. Census files to calculate percentage point change in the Black population (mean = 1.17%, s.d. = 3.97%). Figure 1 displays the level of Black growth in cities throughout Southern and Northern California. We identified Black growth cities as those in the 98th percentile of Black population growth, capturing cities that experienced Black population growth between 10 and 40 percentage points over the twenty-year span, constructed a matrix of Euclidean distances between the centroids of all California cities, and defined proximity as the distance in miles from the nearest Black growth city (mean = -69.8, sd = 64). For ease of interpretation, we divide this variable by 100 and multiplied by -1, so that a unit increase indicates a 100-mile increase in proximity. By using a continuous treatment indicator on non-nested data, we bypass the concern in the racial threat literature over the sensitivity of results using multilevel data to the choice of administrative boundary (Tam Cho and Baer Reference Tam Cho and Baer2011; Voss Reference Voss1996; for more discussion see Online Appendix B).
We gathered a number of additional control variables at the census tract level and merged them with our dataset via a weighted spatial join. We obtained 1964 voter registration figures for cities from the Berkeley School of Law Center for Research and control for city-level percent Democrat (of registered) to rule out partisanship as a confounder. Measures of population density control for variation in geographic and population size of each city. As poorer and more racially conservative Whites might be more likely to live adjacent to high Black growth cities, we include controls for median income, home ownership, and unemployment (descriptive statistics are included in Online Appendix C).
RESULTS
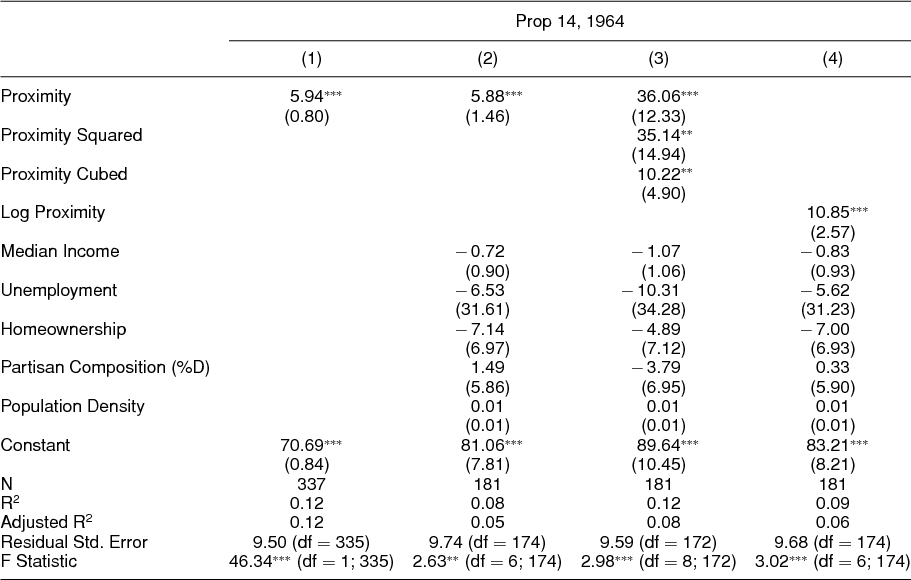
We begin by estimating the bivariate relationship between proximity and city-level vote for Proposition 14 for cities with 90% or greater White population, the results of which are presented in column 1 of Table 1. The results indicate that proximity to cities with rapidly growing Black populations is associated with higher levels of White support for Proposition 14. The benefit of this analysis is that it maximizes statistical power, as the analyses including control variables have a reduced sample size due to the limited coverage of smaller cities in the 1960 decennial census.Footnote 1 As the relationship in column 1 could be driven by confounders, column 2 presents the results from a model including city-level control variables. As shown in column 2, the relationship between proximity to nearest Black growth city and support for Proposition 14 holds. To assess the robustness of these results when accounting for possible nonlinearity in the relationship between proximity and city-level voting for Proposition 14, we estimate a model including a squared and cubed proximity term (column 3) and logged proximity (column 4). While these results indicate a non-linear relationship between these two variables, it is difficult to compare the average impact of proximity across models. To do so we estimate predicted values and first-differences.
The Effect of Proximity to Black Growth Areas on Support for Proposition 14

Note: OLS coefficients with heteroskedastic robust standard errors in parentheses. 90% and greater White cities. Columns 1 and 2 assume linear relationship between proximity and city-level Proposition 14 vote. Columns 3 and 4 allow for non-linearity.
*p < 0.1; **p < 0.05; ***p < 0.01 (two-tailed).
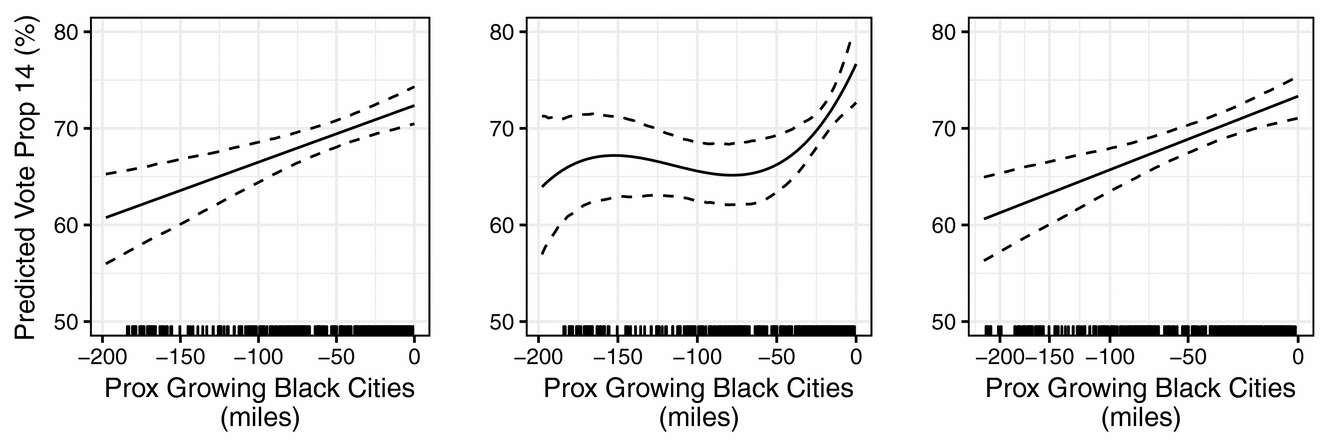
We plot predicted city-level Proposition 14 vote in Figure 2 for models 2 (panel 1), 3 (panel 2), and 4 (panel 3) from Table 1. In panel 1, holding all other variables at their means, we find that a city located adjacent to a Black growth city is estimated to support Proposition 14 at 72.4% (95% CI: [70.5%, 74.3%]), whereas estimated support in a city 200 miles away (mean – 2 s.d.) is 60.6% (95% CI: [56.1%, 65.1%]), a difference of 11.8 percentage points (95% CI: [6%, 17.2%]). Looking at panel 2, we find that the effect of proximity seems to be most pronounced in the first 75 miles. The effect of moving from a city 75 miles away to one adjacent to a Black growth city is 11.5 percentage points (95% CI: [5.4%, 18.1%]). The difference across the full range of proximities is only a slightly larger 12.7% (95% CI: [4.3%, 20.6%]). In panel 3, using logged proximity, we find an almost identical first difference of 12.6% (95% CI: [6.4%, 18.9%]). Because the effect of proximity is similar in all models, for ease of interpretation we will use the linear specification for the remaining models in the article.
Effect of Proximity to Black Growth Areas on Support for Proposition 14

ROBUSTNESS CHECKS
We demonstrate in the Online Appendix that our results hold when using beta regression (Table D.1) and when including county-level fixed effects (Table D.2). Given our interest in the behavior of White voters, we demonstrate that our results hold when further restricting the analysis to cities that were 95% or greater White in 1960 (Table E.1), and when employing an ecological inference model to estimate support for Proposition 14 among White voters (Table F.1). Alternatively, our results hold when lifting the percent White sample restrictions (Table E.1). Additionally, our results hold when using different thresholds to define a “treatment” city (Table G.1) and when measuring proximity to Black growth cities using driving distances and times (Table G.2). To account for possible post-treatment bias, we demonstrate that our results hold when replacing our 1960 control variables with pre-treatment (i.e., before the SGM) variables derived from the 1940 Census (Table H.1). While column 1 of Table 1 demonstrates that our results hold when analyzing all predominantly White California cities, to further ensure that our results are not driven by the mid-to-large cities covered by the 1940 and 1960 Censuses, we demonstrate that the effect of proximity holds when analyzing the n = 187 smaller-sized cities not covered by these censuses (Table E.1). Next, as placebo tests, we demonstrate that the positive effect of proximity to Black growth cities is restricted to Proposition 14 and not observed when analyzing race-neutral propositions (Table I.1). Lastly, we uncover complementary results to those presented in Table 1 when analyzing individual-level survey data estimating White support for Proposition 14 as a function of Black population growth in respondents’ counties of residence (Table J.1).
While the SGM and the 1964 election offer a case where selection bias is substantially reduced, such concern is not entirely removed. Black residents did not settle at random in California cities. Further, while “White flight” from California cities was most pronounced between mid-1960 to 1980 (Schneider Reference Schneider2008), it is possible that substantial residential sorting occurred between 1940 to 1964. One method for addressing this possibility is to re-analyze our model among targeted subsamples of the data.
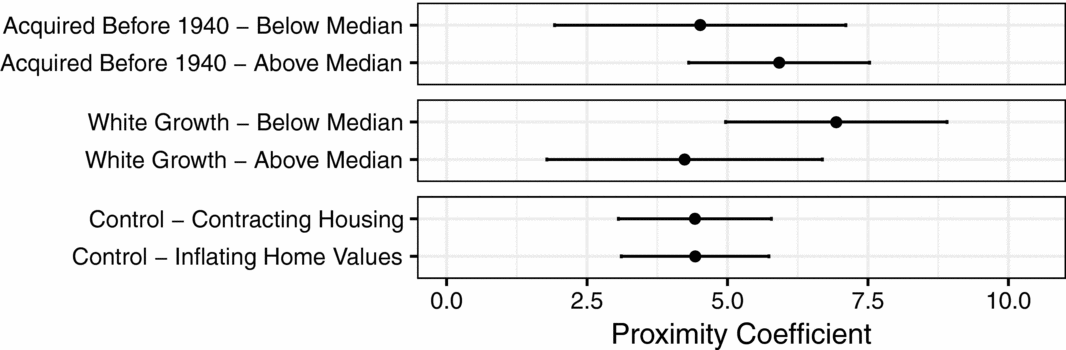
First, we explore whether our results hold when looking at White cities with higher levels of White residential tenure. The 1960 decennial census includes data on when individuals moved into their residence. Using this data, we can restrict our analysis to White cities where a higher rate of residents reported having moved in before 1940 (i.e., before the start of the SGM). The first row of results in Figure 3 (full results available in Table K.1) demonstrates that the effect of proximity to Black growth cities holds (p < 0.01) when looking at above-median tenure cities. This result is critical, as it indicates that when conducting a test reducing White residential selection bias, the estimated effect of proximity remains positive and statistically significant.
Reanalysis by Residential Tenure, White Growth, and Housing Markets

Second, we can assess whether our results hold when looking at majority-White cities with lower levels of White population growth between 1940–1960. Racially conservative Whites residing in cities experiencing Black in-migration may have fled to adjacent all-White cities, taking their racially threatened attitudes with them. Such a process could have induced the findings we observe, suggesting they are less due to the activation of racial threat among Whites residing in proximity to Black growth cities and due instead to the migration of racially threatened Whites to neighboring cities. While we find suggestive evidence that White populations contracted the most in cities within five miles of Black growth cities, we find no evidence that White population growth disproportionately occurred within neighboring cities five or more miles away from Black growth cities (see Figure L.1). Moreover, the results presented in Figure 3 belie this concern: rather than being endemic or more pronounced in White cities experiencing high White population growth, we find the effect of proximity to Black growth cities is stronger in White cities with below median White growth (range: [−17.2, −0.003], mean = −2.2).
It is also possible that “redlining” (Rothstein Reference Rothstein2017) forced African Americans to settle in neighborhoods deemed less desirable, which may have contained poorer and more racially conservative Whites. Such possibility could explain the relationship we observe between proximity to Black growth cities and White support for Proposition 14. This possibility is not suggested by the data, as proximity to Black growth cities is not strongly correlated with pretreatment indicators of 1940 socioeconomic standing, such as median home values (r = 0.10), homeownership rates (r = 0.15), or unemployment rates (r = 0.01). Another concern is that our results are due to housing competition. It is possible that proximity to Black growth cities is capturing the effect of proximity to areas experiencing increased competition for housing. The bottom panel of Figure 3 display the coefficient for proximity to Black growth cities when adding a control variable for proximity to cities with the most drastic (95th percentile) contraction in available housing units (i.e., vacant units for sale or rent) between 1940–1960, or the most drastic increases in home values between 1940–1960. We find the effect of proximity holds in both models (p < 0.001), indicating that proximity to Black growth cities remains positive and significant when holding constant proximity to areas manifesting symptoms of housing competition.
CONCLUSION
Exploiting a large demographic shift during the SGM, we sidestep some of the concerns of existing observational research on racial threat and find evidence that White residential proximity to growing Black populations in California was positively associated with voting for Proposition 14 in the 1964 election. As such, our study makes a novel and compelling contribution to the existing scholarship on the role of racial threat in shaping White political behavior. Remarkably, demographic change remains a politicized and salient issue fifty years after the referendum we study. As the nation continues to diversify, understanding the impact of these demographic shifts on the attitudes and behaviors of native-born residents is increasingly crucial to understanding national political trends writ large.
SUPPLEMENTARY MATERIAL
To view supplementary material for this article, please visit https://doi.org/10.1017/S0003055418000448
Replication materials can be found on Dataverse at: https://doi.org/10.7910/DVN/UAQZRO.




Comments
No Comments have been published for this article.