Introduction
Traits such as disease resistance are receiving increasing attention by agricultural industries and export markets (e.g. Bishop et al., Reference Bishop, de Jong and Gray2002). Disease poses a high risk to the success of intensive agriculture and aquaculture through its effects on both production and animal welfare. However, disease resistance is particularly costly for breeding companies to evaluate and is slow to improve using the current challenge testing methodology or information from field data. As there are risks that survivors of a challenge test may carry the disease, these individuals, who have the greatest resistance to the disease within each family, are not normally utilised for further breeding (e.g. unchallenged siblings belonging to the best performing families are used instead by the Atlantic salmon breeding programme in Norway, Gjedrem, Reference Gjedrem2005). We need appropriate technologies that can be used to measure disease resistance on live breeding candidates.
One technology with potential application to the choice of livestock for production and selective breeding is high-throughput gene expression profiling. Two possibilities exist for the use of gene expression profiles with selective breeding. Such profiles can be used to discover genes affecting particular traits or involved in particular processes (e.g. Liu et al., Reference Liu, Cheng, Tirunagaru, Sofer and Burnside2001) and the variants of these genes contributing to trait variation can subsequently be identified. Another possibility is to use the gene expression profile to predict a phenotype or breeding value, such as susceptibility to a disease. As tissue for gene expression profiling can potentially be collected from live candidates, the profiles could then be used as an indirect selection tool. The use as a selection tool assumes that we have a method of eliciting a gene expression response from breeding candidates, for example by challenging cells derived from these individuals to disease.
The prediction of a disease-resistant phenotype from gene expression data is in many ways analogous to the classification of cancer types in human patients using microarray data (e.g. Golub et al., Reference Golub, Slonim, Tamayo, Huard, Gaasenbeek, Mesirov, Coller, Loh, Downing, Caligiuri, Bloomfield and Lander1999; Tibshirani et al., Reference Tibshirani, Hastie, Narasimhan and Chu2002; Van’t Veer et al., Reference Van’t Veer, Dai, Van de Vijver, He, Hart, Mao, Peterse, Van der Kooy, Marton, Witteveen, Schreiber, Kerkoven, Roberts, Linsley, Bernards and Friend2002; Antonov et al., Reference Antonov, Tetko, Mader, Budczies and Mewes2004; Wang et al., Reference Wang, Klijn, Zhang, Sieuwerts, Look, Yang, Talantov, Timmermans, Meijer-van Gelder and Yu2005) or to the prediction of tumour resistance to chemotherapy (Barbado et al., Reference Barbado, Preisser, Boisdron-Celle, Verriele, Lorimer, Gamelin and Morel2006). In the case of cancer, the cells of the tumour and surrounding cell types respond to the genetic changes occurring in the cells making up the tumour. One particular point mutation could lead to cascades of gene expression changes. These gene expression changes could potentially be used to help classify patient tumour types so that the most effective available treatment could be recommended. In the case of disease, certain cells (e.g. macrophages or leukocytes) respond to the disease agent, and the resulting cascades of gene expression changes in these cells could potentially differ between animals that are able to resist v. those that are more susceptible to the disease. We chose to utilise datasets from cancer studies because they were the largest available and because the results of the validation of our method for prediction could be directly compared to those of other published methods for classification.
Cancer research has focussed on the use of gene expression data for the classification of patients and a number of discrimination methods have been compared for this purpose (Dudoit et al., Reference Dudoit, Fridlyand and Speed2002). Univariate approaches, where expression values for the genes most correlated with phenotype, are subsequently used to predict disease outcome, give a poor classification success rate (Dabney and Storey, 2005). This is because gene expression is part of a co-regulatory network, so the value of including multiple genes affected in the same network into the prediction equation is often not as great as including genes from different networks, even though the correlation with the phenotype may be higher for the genes in the same network. No single multivariate discrimination or classification method has been found to be clearly better than the others for all situations (Dudoit et al., Reference Dudoit, Fridlyand and Speed2002).
However, doubts have been raised over the accuracy of these methods and their validation. There is little overlap in the gene sets that have been identified by different studies to predict survival to the same type of cancer; the set of genes arrived at has been found to be highly dependent on the subset of patients used for gene selection, and when one group’s predictor is tested on another group’s data the success of prediction decreases significantly (Ein-Dor et al., Reference Ein-Dor, Kela, Getz, Givol and Domany2005; Michiels et al., Reference Michiels, Koscielny and Hill2005; Ein-Dor et al., Reference Ein-Dor, Zuk and Domany2006). There are two possible reasons for the discrepancies observed. First, biases in the validation of the prediction have been introduced into many of these studies. Ntzani and Ioannidis (Reference Ntzani and Ioannidis2003), in an assessment of 84 different studies, found that most were not properly validated. Complete validation of all steps in the prediction method (selection of genes, computation of solutions and creation of the prediction rule) is critical, otherwise substantial bias can be introduced into the test of the method (Simon et al., Reference Simon, Radmacher, Dobbin and McShane2003; Michiels et al., Reference Michiels, Koscielny and Hill2005). Second, the patients used in the calibration may not accurately reflect those in the wider population (Simon et al., Reference Simon, Radmacher, Dobbin and McShane2003).
In both the animal disease resistance and the cancer case, there is likely to be expression information from a large number of genes that we wish to utilise to predict the phenotype of the animal or patient, and in both cases we are limited to a relatively small number of samples that we can use to train our classification procedure (either by budget or by availability). For both cases we need to determine which genes contribute most to the classification or prediction, and then determine how each gene’s expression data should be weighted in a prediction equation. We also need an equation that is predictive for most subsets of patients or breeding candidates. For animal breeding and production purposes we need a method for quantitative prediction that will allow us to choose the best performing animals. Here, we propose a method involving the use of random regression with cross validation, which both accounts for the distribution of variation in the trait and utilises different subsets of individuals to perform a validation of predictive ability. To test the method we have used publicly available gene expression data from patients with cancer. Although we envisage the use of the method for animal breeding, this cancer dataset was used to test the method because it provided more individuals with both gene expression data and phenotypes than was available elsewhere.
Method
Data utilised
We utilised primary breast tumour gene expression data kindly supplied by Van’t Veer et al. (Reference Van’t Veer, Dai, Van de Vijver, He, Hart, Mao, Peterse, Van der Kooy, Marton, Witteveen, Schreiber, Kerkoven, Roberts, Linsley, Bernards and Friend2002) (www.rii.com/publications/2002/vantveer.html). The data were from 97 patients who developed distal metastases (a poor prognosis). The actual time until the development of distal metastases (measured in years from when the breast tumour biopsy was taken) was the trait used for the calibration and testing. The dataset included expression information for 24 481 genes. Annotation of this set of genes was last updated on 23 October 2000. One patient was dropped from the set because there were many missing gene expression values for this particular individual. Van’t Veer et al. (Reference Van’t Veer, Dai, Van de Vijver, He, Hart, Mao, Peterse, Van der Kooy, Marton, Witteveen, Schreiber, Kerkoven, Roberts, Linsley, Bernards and Friend2002) describe the methodology used for the measurement of the gene expression values. A cRNA pool was created from each of the sporadic carcinomas and used as a common reference sample in the Van’t Veer et al. study. All background corrections, normalisation and log conversions had already been applied by Van’t Veer et al. (Reference Van’t Veer, Dai, Van de Vijver, He, Hart, Mao, Peterse, Van der Kooy, Marton, Witteveen, Schreiber, Kerkoven, Roberts, Linsley, Bernards and Friend2002).
Class and phenotypic prediction using random regression to identify genes and maximum likelihood estimation of solutions with cross validation
A multiple regression equation using expression data from a subset of the genes was used to predict time to metastases. When the best predictors from a large set are chosen, the estimated regression coefficients are biased upwards. To reduce this bias the regression coefficients were treated as random variables. Use of such random regression models has become common in animal breeding applications (e.g. Van der Werf et al., Reference Van der Werf, Goddard and Meyer1998; Schaeffer, Reference Schaeffer2004). To determine the number of variables included in the multiple regression equation, an internal cross-validation procedure was used. Finally, to test the accuracy of the final regression equation, an external cross validation was used in which the 96 patients were randomly divided into a calibration set of 77 patients and a validation set of 19 patients. The validation set was kept aside and was not used in the derivation of solutions. The selection of patients and collation of corresponding gene expression and phenotypic datasets were done using scripts written by the authors in the R language (R Development Core Team, 2007).
Determining the optimum number of genes to use in the models. An iterative algorithm (NUMGEN) was employed sequentially adding genes at each iteration (k = 1, 2, 3, …) until no further prediction improvements could be made, based on a correlation measure. Details of the algorithm are as follows.
NUMGEN. One thousand randomly generated subsets of 67 patients were selected from the calibration set of 77 patients, without replacement. Corresponding subsets of remaining patient data (10 patients) were also generated and were kept aside for testing how the prediction equations performed with the addition of increasing numbers of genes to the model (see below). For each subset of 67 patients, we repeated the following steps for k iterations:
1. The correlation between gene expression for gene i (xi) and the vector of phenotypes (time to metastases, y) was calculated for all 24 481 genes. The gene with the highest correlation to the phenotype was added to the set of predictors as the kth gene, e.g. xkj is the level of expression for the jth individual for the gene with the highest correlation to the phenotypes in iteration k.
2. The prediction equation was estimated using the k genes by fitting the model yj=μ + ∑bkxkj + ej, where μ was a constant, ej was the random residual and bk was a random regression coefficient where bk∼N(0, σ 2bk). This was done using the program ASReml (Gilmour et al., Reference Gilmour, Gogel, Cullis and Thompson2006).
3. Phenotypes were corrected for the genes already in the model so that new yj = yj − ∑bkxkj. Gene k was removed from the dataset and added to the set of predictors xkj. Return to step 1.
At each iteration, the correlation of predicted to actual phenotype was calculated for the 10 left-out patients. The correlations were averaged over the 1000 iterations. The optimum number of genes (k) to include in subsequent models was estimated as the value of k with the highest average correlation coefficient.
Prediction equation. Random regression with cross validation was applied and tested in the following different ways.
EST1. NUMGEN above yielded 1000 sets of models (each consisting of k genes, corresponding k regression coefficients and residual variance) that were predictive for a randomly selected subset of 67 patients. The frequency of occurrence of these predictive genes over all 1000 NUMGEN models was determined for the set of 77 calibration patients. For EST1 we repeated steps 1 to 5 above (NUMGEN) k times; however, this time the mean regression coefficients for the k most frequently occurring genes over all analyses of the 1000 subsets of 67 patients from NUMGEN were used in the prediction for the jth animal over models m where

where

where ni = number of times gene i is included in the prediction equation.
EST2. For EST2, we repeated steps 1 to 5 above (NUMGEN) k times; however, this time all 77 calibration patients were used in the prediction where

Validation. The prediction equations from EST1 and EST2 were used to predict phenotype for 19 patients in the validation set (i.e. those not used at all in the derivation of prediction equations) as

actual phenotypes (r) was used to test and compare equations EST1 and EST2.
Standard error of correlation coefficient and sensitivity to sample size. In order to calculate the standard error (s.e.) of r, the whole EST1 and EST2 procedures described above, including the random division of the data into calibration and validation sets, were repeated 10 times. All the steps described above were carried out independently on each set of calibration and corresponding test patients.
The sensitivity of the method to sample size was checked by repeating NUMGEN, this time using 1000 randomly generated subsets of 20 patients. The list of genes selected using this smaller sample size was compared to those selected using subsets of 67 patients (described above).
Comparison to other methods. Previous studies have used classification or discrimination procedures (e.g. eigengene-based linear discriminant models, ELDA; Shen et al., Reference Shen, Ghosh, Chinnaiyan and Meng2006) to analyse the same dataset as we used here to test our method. To allow direct comparison of our method to previous methods, we converted the predicted and actual phenotypic values for the left-out patients into the same binary classes utilised by these prior studies (greater than or less than 5 years to metastases).
Results
Number of genes
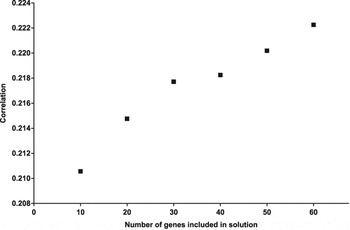
Choice of an optimum number of genes for use in the prediction equation was made using procedure NUMGEN. With the addition of more genes to the model under procedure NUMGEN, the correlation between the predicted and actual phenotypes for the left-out patients increased until the point where more than 60 genes were added to the model (correlation of 0.22 with 60 genes; Figure 1). The program did not converge when more than 60 genes were included due to singularities in the information matrix, indicating insufficient data were available to predict the effects of larger numbers of genes. Therefore, models were constructed using 60 genes in subsequent steps (EST1 and EST2). When 60 genes were included in the models, and predictions from NUMGEN were converted into binary classes, 61% of patients were successfully classified into >5 or <5 year classes (10 000 tests).
Correlation of predicted v. actual phenotype with increasing numbers of genes for 1000 sets of 10 left-out patients (NUMGEN).

Genes selected for inclusion in the models
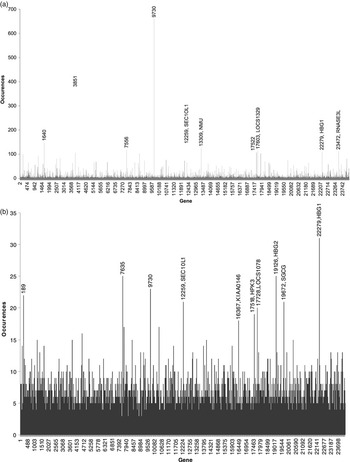
Figure 2a and b shows the frequency of occurrence of genes that were added to the models (those giving highest correlation with phenotype) over the 1000 subsets of randomly chosen patients (NUMGEN for models with 60 genes). The sensitivity of the method to calibration set sample size is shown by comparing the occurrence of genes identified when subsets of 67 v. 20 patients are used. The genes showing a high occurrence when subsets of 20 patients were used were mostly the same genes with high occurrence found when samples of 67 patients were chosen without replacement. However, when subsets of 20 patients were used, these genes had a generally lower frequency of occurrence (i.e. there is greater variation in the subsets of genes that show high correlation) and so the most frequently occurring genes were less differentiated from the bulk of genes (those occurring in 4 to 6 of the subsets). For instance, gene 2279 (HBG1) was encountered in 110 of the 1000 subsets of 67 patients and in 31 of the 1000 subsets of 20 patients (Figure 2a and b). Background noise (i.e. the number of genes with multiple occurrences throughout the 1000 subsets) was higher when subsamples of 20 patients were used to formulate solutions compared to subsets of 67 patients. Gene 9730 (unidentified EST) was the gene most commonly found to predict phenotype (high correlation with phenotype in 660 of the 1000 subsets of 67 patients). Four of the five most commonly identified genes with the random regression and cross-validation method were also identified by the ELDA method (Shen et al., Reference Shen, Ghosh, Chinnaiyan and Meng2006) (SEC10L1, NMU and unidentified expressed sequences 9730 and 3851).
Occurrence of genes with the highest correlation to time to metastases derived from one thousand subsets of (a) 67 patients and (b) 20 patients that were randomly chosen without replacement. Identification numbers and names are shown for the 10 most frequently occurring genes.

Validation
The correlation of predicted with actual phenotype, and success of classification, was highest when the mean solutions derived from the 1000 subsets were applied to predict the phenotype of the 19 remaining patients (Table 1, EST1). The estimate of the correlation coefficient is unbiased because the derivation of the prediction equation and testing were performed using independent samples (correlation between predicted v. actual phenotype for 19 patients not included in the calibration set, 60 genes included in prediction equations). The average correlation was 0.32 ± 0.06 (P < 0.001, ±s.e.; Table 1). Sixty-five percent of the 19 left-out patients were correctly classified when the time from tumour biopsy until development of metastases was classed as either more than 5 years or less than 5 years (Table 1).
Correlation of predicted to actual time to metastases and success of classification using random regression with cross validation

***P < 0.001.
Success of classification was determined after binary conversion of the predicted and actual phenotypes. The correlation and classification success is for prediction equations derived from methods EST1 and EST2. The biased test was a form of incomplete cross validation where gene selection was made using all 77 patients, solutions for these genes were derived from subsets of 67 patients drawn from the 77 patients and resulting prediction equations were applied to the corresponding subset of 10 ‘left-out’ patients. n, number of predictions tested for each correlation. n sets, number of correlation coefficients.
When all 77 calibration patients were used to estimate genes and solutions, and this equation was applied to predict the phenotype of 19 additional patients (EST2), the average correlation between the predicted and actual phenotypes for 19 test patients was 0.25 ± 0.05 (P < 0.001, ±s.e., 60 genes in the model; Table 1). For EST2, 62% of the 19 left-out patients were correctly classified when the time from tumour biopsy until development of metastases was classed as either more than 5 years or less than 5 years (Table 1).
Discussion
The general multivariate approach we adopt in this paper for use of gene expression data for predicting continuous phenotypes for animal production and breeding builds a predictive subset of genes rather than individual gene predictors. There are likely to be many combinations (subsets) of genes that act as effective predictors in such a network (Ein-Dor et al., Reference Ein-Dor, Zuk and Domany2005 and Reference Ein-Dor, Kela, Getz, Givol and Domany2006). We used two different approaches to formulate prediction equations and performed a complete validation of all steps in the prediction method. These approaches resulted in subsets of genes and solutions that were predictive of the phenotype (moderate significant correlations between the predicted and actual phenotypes for left-out individuals). The use of mean solutions with re-sampling of the calibration dataset gave the highest correlation between the predicted and actual phenotypes (0.32, P < 0.001; Table 1). It is important to note that there were only 19 individuals in each validation and that the s.e. for the 10 repetitions of the procedure was high as is expected for small sample sizes (Efron and Tibshirani, Reference Efron and Tibshirani1997).
Classification methods, such as ELDA, have been reported to work with high accuracy (e.g. Tibshirani et al., Reference Tibshirani, Hastie, Narasimhan and Chu2002; Van’t Veer et al., Reference Van’t Veer, Dai, Van de Vijver, He, Hart, Mao, Peterse, Van der Kooy, Marton, Witteveen, Schreiber, Kerkoven, Roberts, Linsley, Bernards and Friend2002, as high as 70% to 90% using the same dataset as in this paper, Dabney and Storey, 2005; Shen et al., Reference Shen, Ghosh, Chinnaiyan and Meng2006). But critics of past studies have pointed out that published estimates of classification rates have been excessively optimistic due to inadequate validation and bias (Ntzani and Ioannidis, Reference Ntzani and Ioannidis2003; Simon et al., Reference Simon, Radmacher, Dobbin and McShane2003; Ioannidis, Reference Ioannidis2005; Michiels et al., Reference Michiels, Koscielny and Hill2005). In some cases the validation of the prediction equation is incomplete because the entire process, including the selection of predictive genes, is not repeated for each cross-validation training set. Michiels et al. (Reference Michiels, Koscielny and Hill2005) used a multiple validation study to show that five of seven previous studies did not actually classify patients better than chance. When a completely unbiased cross-validation method was used, error rates were high (41%, Van’t Veer et al., Reference Van’t Veer, Dai, Van de Vijver, He, Hart, Mao, Peterse, Van der Kooy, Marton, Witteveen, Schreiber, Kerkoven, Roberts, Linsley, Bernards and Friend2002). This error rate is slightly greater than the averages detected by our study using complete cross validation (35% to 38%; Table 1). When bias from incomplete validation was introduced into our method (by using information from all 77 patients in the calibration dataset to select genes for inclusion in the equation used to predict the phenotype of each subset of 10 left-out patients with procedure NUMGEN), the same order of classification success reported by Shen et al. (Reference Shen, Ghosh, Chinnaiyan and Meng2006) and Van’t Veer et al. (Reference Van’t Veer, Dai, Van de Vijver, He, Hart, Mao, Peterse, Van der Kooy, Marton, Witteveen, Schreiber, Kerkoven, Roberts, Linsley, Bernards and Friend2002) was achieved (correlation 0.85, predictive success 84% for classes >5 or <5 years; Table 1).
It would be surprising if these or other methods were as highly predictive as has been reported in the past. All of the studies performed to date have utilised a relatively small number of individuals for calibration and testing. All individuals are profiled using expression values for tens of thousands of genes. There is a high chance of detecting false-positive associations under these circumstances. Traits like time to metastases or disease resistance are likely to be influenced by many factors that would not directly affect gene expression levels in the target and surrounding tissue at the moment samples are taken. A single ‘snapshot’ of gene expression data is unlikely to provide a good prediction under these circumstances. Also, variation in gene expression levels due to technical error in the microarray results is likely to be high. These influences would create some noise in the microarray data, which would reduce the accuracy of prediction.
Use of the averaged solution from the 1000 random samples without replacement (EST1) gave a higher correlation between the predicted and actual phenotypes for the left out 19 individuals than using the solution from the full calibration set of 77 individuals (EST2). This is likely to be because some individuals have outlying gene expression values for some genes and, when all 77 individuals are used to derive solutions, these outlying values influence the prediction equation. Using re-sampling tends to reduce the influence of these outliers on the prediction equation. Some of the genes chosen with re-sampling could be under co-regulation (e.g. genes HBG1 and HBG2 (Figure 2b), which are presumed to have arisen by duplication and whose expression are both silenced by the STAT signal transduction pathway, Foley et al., Reference Foley, Ofori-Acquah, Yoshimura, Critz, Baliga and Pace2002). The overall effect of including these co-regulated genes in the prediction equation could be beneficial as greater emphasis will be given to those signal transduction pathways whose overall behaviour is highly correlated with the trait. Therefore, use of genes that are most often highly correlated with the phenotype within different subsets and average solutions from re-sampled subsets, or similar utilisation of re-sampled data to generate a set of genes and solutions, is recommended in future application of this method to animal breeding.
Although the probability of classification success has been calculated in some instances, classification methods used to date in the literature are not designed to rank individual patients or animals. In contrast, the random regression method described here provides a quantitative estimate of the phenotype, which can be used to rank animals or patients to pick those with the greatest chance of extreme phenotypic performance. Noise due to individuals in the calibration set with phenotypic values close to the cut-off between two phenotypic classes is eliminated in our analysis because the raw phenotypic measurements for the trait are utilised directly.
For traits such as disease resistance, it will be worth including large numbers of animals in formulating the prediction equations from microarray data. To minimise costs and maximise accuracy, microarrays could be used as a ‘first pass screen’ to identify likely indicator genes using a modest calibration dataset consisting of samples from extreme performing animals for the phenotype of interest. Gene expression values for the indicative genes could be measured for larger numbers of animals (in the order of thousands, preferably) using MassARRAY competitive RT PCR (Ding and Cantor, Reference Ding and Cantor2003), or other more sensitive, reproducible and cost-effective means of measuring gene expression (i.e. those methods designed to process many samples and fewer genes). These measurements could then be used to determine the final set of genes and solutions for inclusion in the prediction equation. Ongoing evaluation could result in refinement of the choice of genes and solutions as more animals are tested.
An ideal species to test our prediction method on is the Atlantic Salmon in Norway, as large numbers (thousands) of animals are routinely challenged experimentally with disease to provide data for the selection of breeding candidates (Gjedrem, Reference Gjedrem2005). Information and samples collected over subsequent generations from such animals could be used to refine tests and prediction equations. Gene expression responses that are found to be correlated with disease resistance may provide clues about causative genes that could be targeted for vaccines, RNAi or other treatments and could assist producers to choose the best performing animals for grow-out in particular production environments.
However, no studies have yet evaluated whether it would be profitable and how this technology could be implemented for animal selective breeding. Small improvements in traits such as disease resistance have been shown to have large economic benefits for such industries, even when the costs of implementation are high (Thorarinsson and Powell, Reference Thorarinsson and Powell2006). This is because the benefits from genetic improvement are directly passed on to most producers (>90%) in the industry. A potential advantage of this gene expression technology over current methods (challenge testing, where survivors to the disease are not used for breeding) is that it might allow prediction of the most disease-resistant individuals within families. Because of the broad flow of benefits, and because genetic response would be improved with selection within families, even a set of genes whose expression has a low to moderate correlation with disease resistance could be beneficial, providing that a method of eliciting a gene expression response from individual breeding candidates (e.g. by challenging cells derived from these individuals to disease in vitro) is available. But few published studies have yet described how the response of large numbers of genes differs between resistant and susceptible animals (Duncan et al., 2002; Diez-Tascon et al., Reference Diez-Tascon, Keane, Wilson, Zadissa, Hyndman, Baird, McEwan and Crawford2005; Keane et al., Reference Keane, Zadissa, Wilson, Hyndman, Greer, Baird, McCulloch, Crawford and McEwan2006; Glass and Jensen, Reference Glass and Jensen2007; Jensen et al., Reference Jensen, Paxton, Waddington, Talbot, Darghouth and Glass2008). Also, we do not know what the predictive ability of tests for such genes might be as few individuals (11 or less) have been used in these studies, equations describing the relationship between gene expression and disease resistance have not been derived and the predictive ability of such gene expression profiles has not been tested. The outcome of our validation here suggests that targeted experiments to collect such data and to evaluate the use of gene expression profiles as a predictor of phenotype for animal selective breeding would be warranted.
Gene expression data could be used to predict the breeding value for traits other than disease resistance that are difficult to improve by conventional methods (e.g. meat quality) or to predict a phenotypic value that is useful in making management decisions. For instance, gene expression data might be used to predict dairy cows at risk of metabolic disease so that treatment could be given, or to predict the most effective treatment. In all these applications, it will be important to use large datasets to develop the prediction equation and to validate it in independent samples. In the absence of a careful validation process, the predictive value of the test is likely to be over-estimated.
Acknowledgements
This research was supported by EU Commission (Project no. 0022665), Norwegian Research Council (Projects no. 172152 and 173490) and AKVAFORSK. Thanks to Phil Bowman and Klara Verbyla who assisted with UNIX and R troubleshooting. Thanks also to Sander de Roos who provided helpful advice and criticism on the manuscript.