1 Introduction
Since the financial crisis of 2007–2008, occupational pensions in the Netherlands have been cut in real and often also in nominal terms and, on average, retirees have experienced a drop in their standard of living of about 6% over the period 2009–2013 (DNB, 2013; Vermeulen et al., Reference Vermeulen, Woudstra, van Wersch and Lammers2015).Footnote 1 This latter conclusion is based on a single inflation rate. People may, however, have different inflation experiences and this might have mitigated or amplified the impact of income changes on their standards of living. The inflation experiences of people depend on their expenditure patterns and the price developments of goods (and services) they spend their money one. A person has an above average inflation experience if his or her budget share allocated to goods that have relatively high price increases is larger than that of an average person. Likewise, a person has a below average inflation experience if his or her budget share allocated to goods that have relatively low price increases is larger than that of an average person. Empirical evidence on differential inflation experience is scarce and, to our knowledge, only available for the UK. Flower and Wales (Reference Flower and Wales2014) showed for the 2003–2013 period, for instance, that in the UK retired households had experienced higher inflation than non-retired households in almost all of the years. Their most striking result, in line with findings of an earlier UK study by Levell and Oldfield (Reference Levell and Oldfield2011) for the years 2000–2010, is that a household in the lowest total expenditures decile experienced an average yearly inflation of 3.7%, while a household in the highest total expenditures decile experienced an average yearly inflation of just 2.3%. One important consequence of differential inflation experience is that it may be misleading to use a single inflation rate to calculate changes over time in standards of livings for different types of households. The standard of living of a household with a relatively high inflation experience changes more over time than that of a household with a relatively low inflation experience (ceteris paribus).
The main aim of this paper is to investigate the extent to which differential inflation experience exists in the Netherlands and, in particular, among retirees. There are two reasons for considering retirees. First, as discussed above, many retirees have experienced income drops in recent years and differential inflation experience may have amplified this drop in income in terms of standards of living for retirees with relatively high inflation experiences. One reason retirees and non-retirees might have different inflation experiences is that they have different expenditure patterns (see Banks et al., Reference Banks, Blundell and Tanner1998 for the U.K.; Börsch-Supan and Stahl, Reference Börsch-Supan and Stahl1991 for Germany; Knoef et al., Reference Knoef, Hussem, Soede and de Bresser2014 for the Netherlands; and Miniaci et al., Reference Miniaci, Monfardini and Weber2003 for Italy). For instance, retirees in the Netherlands spend relatively less on transportation and clothing and more on rent and utilities than workers. In addition, as explained above, changes in relative prices produce different inflation experiences for groups of people with different expenditure patterns. If, for instance, there is a relatively large increase in the price of a good that retirees spend relatively more on than people of working age, the former group will experience higher inflation. There are other reasons, as well, for expecting different expenditure patterns across age groups, besides the spending restrictions associated with a potential drop in income upon retirement (De Ree and Alessie, Reference De Ree and Alessie2009). Budget shares are also affected by the role that health plays in spending decisions, which is referred to as age-restricted consumption by Börsch-Supan and Stahl (Reference Börsch-Supan and Stahl1991). As people age, their health deteriorates and their overall expenditures decrease, resulting in an increase in the budget share spent on goods for which demand is inelastic. Second, the empirical studies from the UK discussed above show that there is reason for concern about high inflation experiences of retirees. Flower and Wales (Reference Flower and Wales2014) reported for the UK that retired households had experienced higher annual inflation (2.8%) than non-retired households (2.5%) in the years between 2003 and 2013. One explanation for their finding is that retired UK households have relatively low expenditures and spend therefore relatively more on inelastic goods such as food and energy which became relatively more expensive during the observation period. This paper examines if this concern is also justified for the Netherlands.
The contribution to the literature of this paper is twofold. First, it examines if retirees in the Netherlands have inflation experiences that differ significantly from the official inflation rate and if there is differential inflation experience among retirees. Second, it provides an empirical framework based on the theory of consumer demand that explicitly makes the link between expenditure patterns and inflation experiences. Predicted expenditure patterns based on the estimation results of a consumer demand system are used to calculate inflation experiences for given household types. Such an approach based on economic theory has not yet been explored in previous studies. An advantage of this approach is that it explicitly takes into account that it is the differences in spending patterns that cause heterogeneity in inflation experience. Moreover, it makes it possible to examine differences in household inflation experiences between homogenous groups of people based on age, household composition and total expenditures. Such a decomposition has not been done for the UK in the abovementioned studies and that makes it difficult to conclude if it is higher age or lower expenditures that is associated with higher inflation experiences. Another advantage of our approach is that such predictions can be done for any period as long as price information is available. This is important as budget surveys are not always available while price information often is. For instance, from 2015 onward household budget surveys are conducted in the Netherlands only every 5 years and price information is available for every year. Also this paper will make predictions of inflation experiences for years not covered by household budget surveys. Our empirical framework can of course be used to calculate inflation experiences of any population and not only of the retired population.
The outline of this paper is as follows. Section 2 presents the data. We used data from the national Dutch Budget Surveys from 1978 to 2004 and price information for the years 1978–2012 provided by Statistics Netherlands. Section 3 provides a descriptive analysis of households’ inflation experiences in the Netherlands. Section 4 presents the empirical model and predicted accumulated inflation experiences for the period from 1978 to 2012 for specific types of households, based on marital status, number of children, age and level of total expenditures. Section 5 presents our conclusions and discusses the limitations of our paper.
2 The data
Data are drawn from the 1978–2000, 2003 and 2004 Dutch Consumer Budget Surveys (Budgetonderzoek, CBS, 2012).Footnote 2 The Budget Survey provides detailed information on household expenditures on certain groups of commodities. It also contains information related to household characteristics, such as family size and composition, age of all household members, income and socioeconomic status. For one entire year, households keep a daily record of all expenses above a certain threshold amount per item.Footnote 3 Expenditures below the threshold amount per item are recorded for a short period of time and that information is used to construct yearly expenses.Footnote 4 Vacation expenditures are recorded in a separate diary. In addition, and following the official guidelines of Statistics Netherlands, mandatory health insurance premiums are not considered expenditures and are also deducted from net income.Footnote 5
We constructed household-specific inflation experiences in accordance with the official inflation rate for the Netherlands published by Statistics Netherlands (the consumer price index (CPI)). The CPI is a Laspeyres index and does not take substitution effects between goods into account. The CPI includes the items rent for renters and rental value of a home for homeowners. In the Budget Surveys, the rental value is based on, for instance, appraisals by real estate experts of what the rent would be if the premises were rented out. In line with the calculation of the CPI by Statistics Netherlands, we consider the rental value of a house to be an expenditure and add it as well to net income. As an alternative, since 2002 Statistics Netherlands has also reported the OECD Harmonized Index of Consumer Prices (HICP), which, among other things, excludes rental value but includes mortgage interest payments (CBS, 2014). As shown in Kalwij et al. (Reference Kalwij, Alessie, Gardner and Ali2015), the HICP and CPI virtually coincide in the years for which both are available (2002–2012), which provides some confidence that definitional differences between these two indices are not a major issue in terms of investigating the inflation experiences of households.Footnote 6
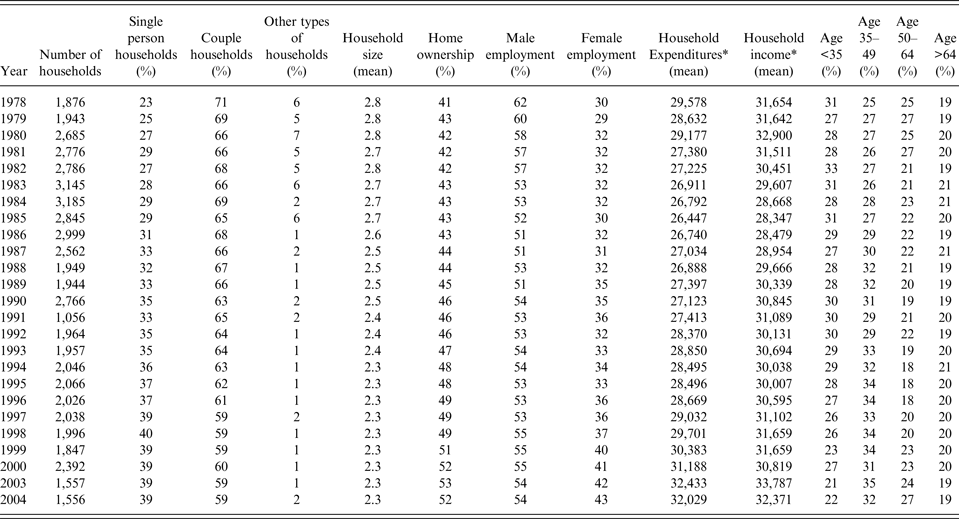
The Budget Survey population is not a representative sample of the Dutch population, so the available sampling weights are used to approximate a representative sample. The descriptive statistics throughout this paper are weighted sample statistics. In addition, people living in nursing homes are not covered by the survey. Although households may participate in the survey for at most 3 years, panel identifiers are not made available, and the survey is used as a series of cross-sections. The average annual sample size over the years was 2,260 households (56,571 observations over 25 years). There was only about a 1% reduction due to missing values on the variables used in the analysis, so that our final sample consisted of 55,962 household-year observations over the 1978–2004 period. Appendix Table A1 reports the sample sizes and weighted sample averages of household characteristics.
Our selection of the composite commodity groups − hereafter referred to as goods – was influenced primarily by the availability of price information (see below). We defined the following 13 goods categories: food and non-alcoholic beverages, food out (cafes and restaurants), alcoholic beverages, tobacco, clothing and footwear, leisure activities (education and recreation, including vacations), housewares and appliances (furniture, cooking utensils, dishwasher, gardening tools, etc.), rent for renters and rental value for homeowners, utilities (heating and electricity), transportation (including fuel), personal care, medical care (not covered by health insurance) and miscellaneous (mainly financial goods and services).
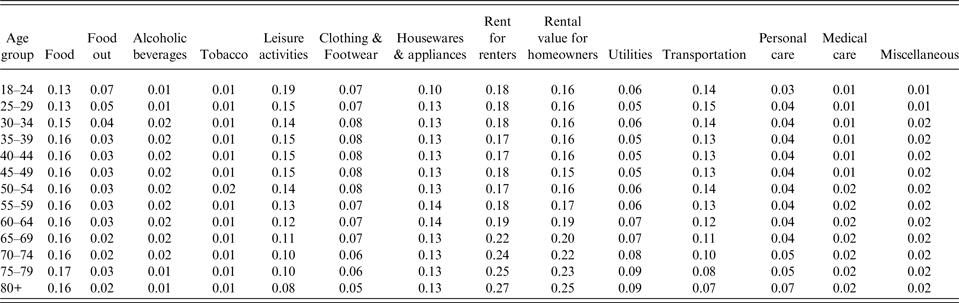
Table 1 shows the average budget shares for each of these goods by age. The budget share is defined as the expenditure on a good divided by total expenditures. This table shows, for instance, that the average budget shares of food and of food out decrease with age. One good typically associated with retirees is vacations (a component of leisure activities). However, its average budget share decreases rather sharply with age. The table shows a strong increase in the rent budget share for renters and rental value budget share for homeowners with increasing age. Another good frequently associated with aging is personal and medical care, and indeed the table shows a doubling of these budget shares over the lifecycle. These budget shares are, however, relatively small, since virtually all medical expenditures during the survey period would have been covered by universal health insurance.
Average budget shares by age

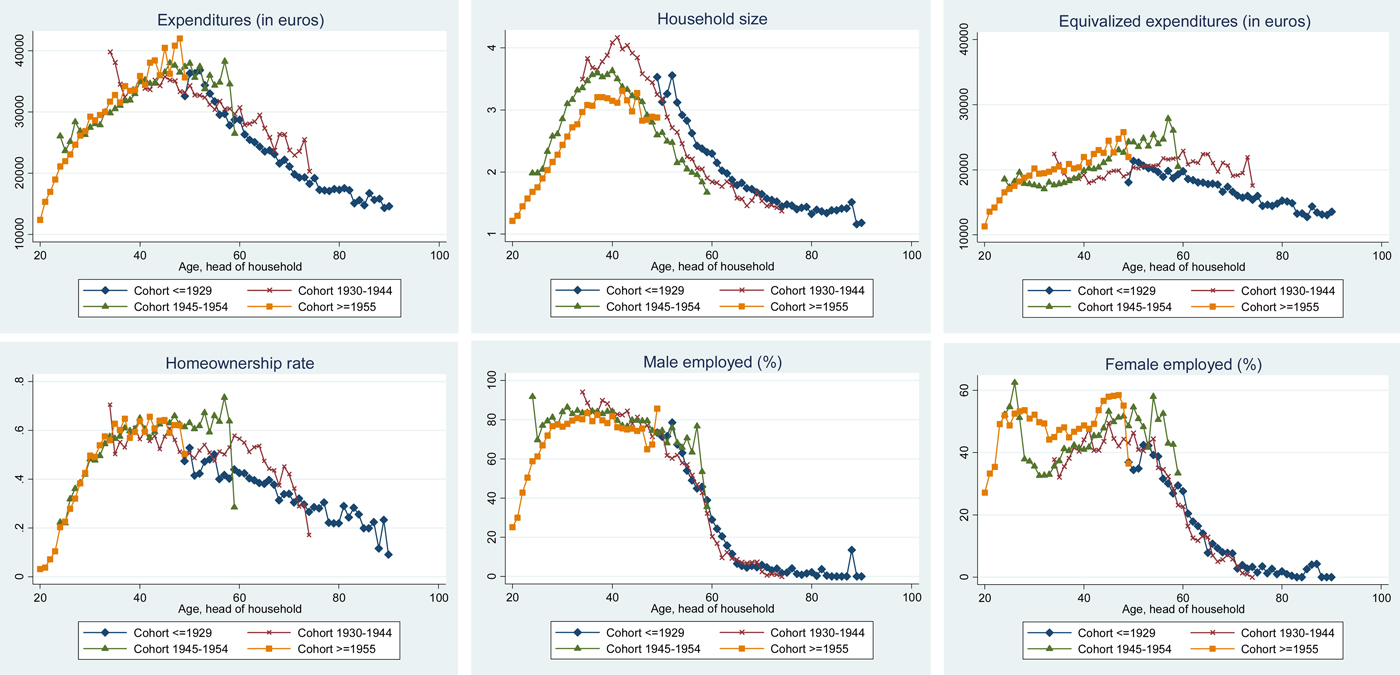
The patterns in budget shares can partially be explained by differences in household characteristics. Figure 1 shows the familiar hump-shape for expenditures over the life cycle. The period in which children are in the household is typically a period of high expenditures and, for instance, a relatively large share of the budget is allocated to food and clothing and footwear (Table 1). The top right graph of Figure 1 shows that once controlled for household composition most of the hump-shape in total household expenditures has disappeared. Nevertheless, a continuous decrease in equivalized expenditures with increasing age is present and several studies have tried to explain this (e.g., De Ree and Alessie, Reference De Ree and Alessie2009). It might, for instance, be related to older people spending relatively more on necessity goods, such as food and utilities, and less on luxury goods, such as food out and leisure activities (Table 1). In addition, Figure 1 shows that women in the more recent cohorts are more likely to work, which may explain the somewhat higher budget share of transportation for young women in Table 1. It is, furthermore, noteworthy that homeownership rates decline with age, presumably due to widowing and that the more recent cohorts are more likely to be homeowners.
(Colour online) Household characteristics by age and year of birth (cohort).

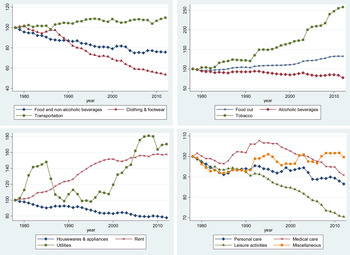
We obtained price information on the goods categories from the price statistics published by Statistics Netherlands from 1978 to 2012. These price indices are based on retail prices of the goods and services on which the aggregate good is based and do not take into account that the quality of goods may have changed. In addition, the baskets of goods may change over time as some products or no longer available, while other have been introduced. Figure 2 shows the price changes over this period relative to the CPI for all 13 goods. This figure shows relatively strong price increases for, in order of magnitude, food out, utilities and rent. Relatively strong price decreases are observed for clothing & footwear and leisure activities.
(Colour online) Price indices relative to CPI (1978 = 100).

3 Household inflation experiences
The logarithm of a Stone price index for household i in year t is given by
 $$\log (P_{it} ) = \sum\limits_{\,j = 1}^J {w_{it}^{\,j} \log (\,p_t^{\,j} )}, $$
where
 $w_{it}^{\,j} $
is the share of total expenditures that household i spends on good j, J is the number of goods and
 $p_t^{\,j} $
is the price index of good j in year t. Likewise, we approximate the inflation rate that a household i in year t experiences using the following weighted inflation index:
 $$\sum\limits_{\,j = 1}^J {w_{it}^{\,j} \Delta \log (\,p_t^{\,j} )}. $$
The inflation rate of the price of good j is approximated by
 $$\Delta \log (\,p_t^{\,j} ) = \log (\,p_t^{\,j} ) - \log (\,p_{t - 1}^{\,j} ).$$
The log operator is the natural logarithm.
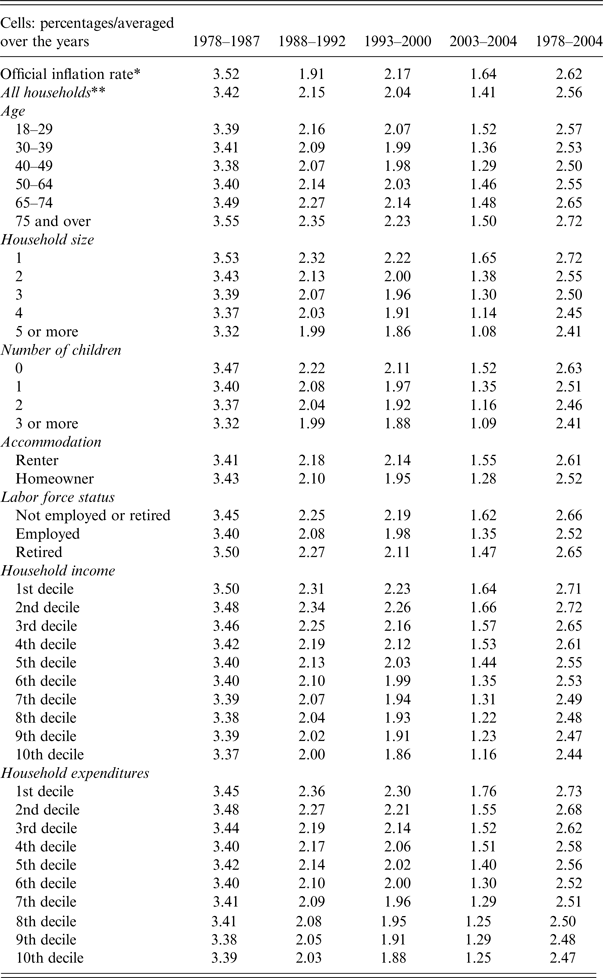
Table 2 reports inflation experiences for different groups of households by year based on equation (2). The top row of the table shows the official (population) inflation rate reported by Statistics Netherlands (CPI based).Footnote 7 The first period in this table is from 1978 to 1987, a period of decreasing inflation that eventually culminated in a period of deflation in 1987. The following period, 1988–1992, is one of increasing inflation through 1991, averaging 2% as a whole, with a slight decrease at the end. From 1993 to 2000 there was relatively stable inflation of about 2%. The 2003–2004 period is just after the dotcom crash; these were years with low inflation.
The official inflation rate by year and household inflation experiences by household characteristic and year

* Statistics Netherlands (statline.cbs.nl); based on the CPI.
** The average over the years is taken after having computed average inflation rates within a group per year.
The overall picture that emerges from this table is as follows. With respect to age, households with a head of the household aged between 40 and 49 years have experienced the lowest inflation. For all periods, household's inflation experience is inversely related with household size and the number of children. The difference in inflation experience between renters and homeowners has increased over time; their inflation experiences were about equal in the years from 1978 to 1987, but after that, homeowners started to experience lower inflation than renters, with the discrepancy steadily increasing to 0.27 percentage points per year as of 2003–2004 (1.55% versus 1.28%). Retirees have 0.13 percentage points higher inflation than employed households in all periods (on average 2.65% versus 2.52% from 1978 to 2004). In line with evidence from other countries, such as the UK (Flower and Wales, Reference Flower and Wales2014), this table shows that the most notable differences in inflation experiences between households are related to levels of income and total expenditures. The patterns are about the same for household income and total expenditures. Compared with households in the highest total expenditures decile, households in the lowest total expenditures decile have experienced, on average, a 0.26 percentage point higher yearly inflation rate (2.73% versus 2.47% from 1978 to 2004). Over the years, this difference has sharply increased from 0.06 percentage points for the 1978–1987 period to 0.51 percentage points for the 2003–2004 period. This latter number is in line with UK evidence.
4 Empirical model and results
Our statistical model consists of two components. The first component is the household inflation experience as presented in Section 3, equation (2); it is a weighted inflation index, where the price inflation rates of the 13 goods are weighted against each household's budget shares. An often necessary assumption made when calculating price inflation is the common price assumption, which is that all consumers face the same prices for sets of goods. One consequence of this assumption is that, given a set of prices (or price indices), differences in inflation experiences between households based on composite goods are solely determined by differences in their relative expenditures on those goods. The second component, therefore, is a consumer demand model. This model relates households’ budget shares for the 13 goods defined in Section 2 to household characteristics, prices and standardized total household expenditures. Hence, differences in inflation experience across households are the result of household characteristics affecting the budget shares. In addition, having the estimation results of the consumer demand model provides insights into which goods cause the differences in inflation experiences. We will return to that issue at the end of this section.
The consumer demand model we estimated has been developed by Lewbel and Pendakur (Reference Lewbel and Pendakur2009). The budget share of commodity j depends on household characteristics (X it ), prices (p t ) and standardized total household expenditures (r it ). Standardized (or equivalized) total household expenditures are equal to total household expenditures divided by the equivalence scale provided by Statistics Netherlands (Siermann et al., Reference Siermann, van Teeffelen and Urlings2004). We estimate the following demand system that allows for the budget shares to be quadratic in log expenditures:
 $$\eqalign{& w_{it}^{j} = \alpha ^{j} + {\bf X}_{it} {\bf \delta} ^{j} + \beta ^{j} \log \left( {\displaystyle{{r_{it}} \over {P_{it}}}} \right) + \lambda ^j \left( {\log \left( {\displaystyle{{r_{it}} \over {P_{it}}}} \right)} \right)^2 + \sum\limits_{k = 1}^J {\gamma ^{\,jk} \log (\,p_t^k )} + \varepsilon _{it}^{\,j}, \cr & \quad j = 1, \ldots, J,}$$
with price index
 $$\log (P_{it} ) = \alpha _0 + \sum\limits_{k = 1}^J {\left( {\left( {\alpha ^k + X_{it} \delta _{}^k} \right)\log (\,p_t^k )} \right)} + \displaystyle{1 \over 2}\sum\limits_{k = 1}^J {\sum\limits_{l = 1}^J {\gamma ^{kl} \log (\,p_t^k )\log (\,p_t^l )}}. $$
The adding up restrictions
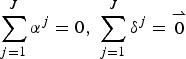 $\sum\limits_{j = 1}^J \alpha ^{j} = 0,\,\,\sum\limits_{j = 1}^J {\bf \delta} ^{j} = {{\mathop 0^{\rightharpoonup}}}$
,
 $\sum\limits_{j = 1}^J {\beta ^{\,j}} = 0$
,
 $\sum\limits_{j = 1}^J {\lambda ^{\,j}} = 0$
and
 $\sum\limits_{j = 1}^J {\gamma ^{{\,j}k}} = 0$
are satisfied by leaving out the 13th good (miscellaneous) when estimating the system of demand equations (Barten, Reference Barten1969), and the homogeneity restrictions
 $\sum\limits_{k = 1}^J {\gamma ^{{\,j}k}} = 0$
and symmetry restrictions γ
jk
= γ
jk
(for all j and k) are imposed to ensure our model is in line with consumer demand theory. The budget share equations for each of the goods were estimated as a system of demand equations. Again, leaving out the 13th good. Equation (4) is similar to the one proposed by Blundell et al. (Reference Blundell, Pashardes and Weber1993) as an extended version of the Almost Ideal Demand System of Deaton and Muellbauer (Reference Deaton and Muellbauer1980) and is nested in the (approximate) Exact Affine Stone Index demand system of Lewbel and Pendakur (Reference Lewbel and Pendakur2009). The price index P
it
(equation (5)) is replaced by the following approximation (P
t
) that uses average budget shares:
 $$\log (P_t ) = \sum\limits_{\,j = 1}^J {\bar w_t^{\,j} \log (\,p_t^{\,j} )}. $$
Equation (6) is a Stone price index. Lewbel and Pendakur (Reference Lewbel and Pendakur2009) show that the estimates of the parameters of the demand system of equation (4) are rather insensitive to using the approximation of equation (6). The main advantage of using this approximation is that equation (4) becomes linear in the parameters.
The explanatory variables included in the analysis are age of head of household in the categories 17–19, 20–24, 25–29, 30–34, 35–39, 40–44, 45–49, 50–54, 55–59, 60–64, 65–69, 70–74, 75–79, and 80+, the number of other household members in the age categories 0–3, 4–16, 17–19, 20–24, 25–29, 30–34, 35–39, 40–44, 45–49, 50–54, 55–59, 60–64, 65–69, 70–74, 75–79, 80+, a dummy variable for a couple household, a dummy variable for other types of households (the reference group is singles), a dummy variable for whether or not the head of household was employed, the number of other employed household members, a dummy variable for homeownership, the logarithm of household size, the logarithm of standardized total expenditures and relative prices.
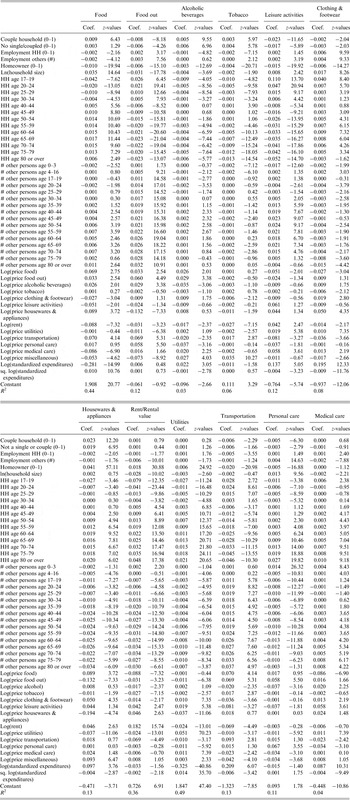
The parameter estimates of equation (4) are used for predictive purposes only and we therefore estimated our system of demand equations by ordinary least squares. As shown by Hayashi (Reference Hayashi2000; Section 2.9), an ordinary least squares estimator provides unbiased estimates of the best way linearly to combine the explanatory variables to predict the budget shares.Footnote 8 The full set of estimation results are presented in Appendix Table A2.
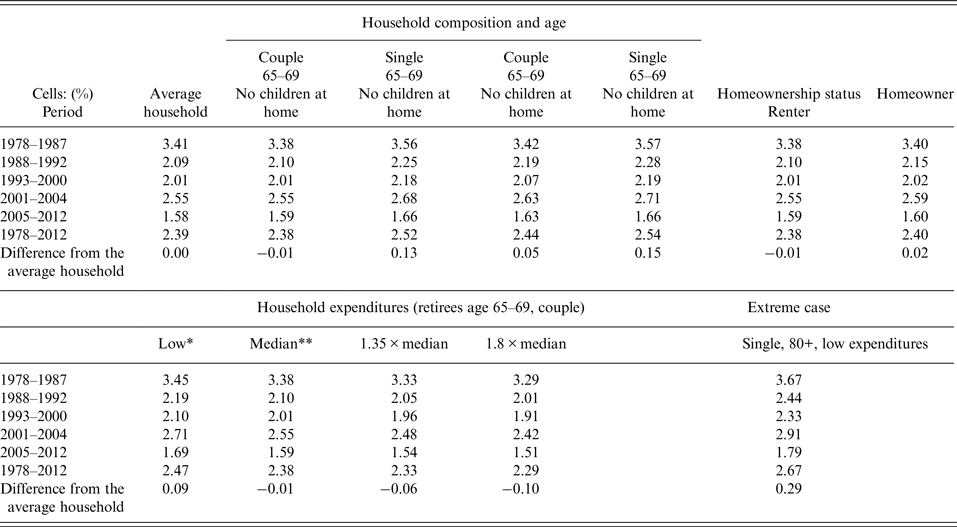
We predict budget shares for various types of households. That is, we have fixed the set of household characteristics and distinguish various types of households based on age, household composition and total expenditures. The baseline case is a retired couple household, both the man and woman are aged 65–69, with no children living in their household, living in a rented accommodation, and with total expenditures equal to €20,000. This latter amount is about mean and median (standardized) total household expenditures. Next, for the prediction, we change one of the characteristics of this baseline household at the time. We consider a single versus a couple, a renter versus a homeowner, a household with members aged 65–69 versus a household with members aged 75–79, and households with expenditures that are equal to the public pension benefit in 2012 (referred to as low expenditures, about €12,500), 1.35 times median and 1.8 times median expenditures versus a household with median expenditures. A retired household with 1.8 times the median level of standardized expenditures is in the 95th percentile of the distribution in 2012 and this level is referred to as high expenditures. For each type of household and given relative price changes over time, we can predict their budget shares over the years for which we have price information. Hereby we keep the households’ characteristics unchanged over time. Next, we substituted these predictions in equation (2) and, together with price information, forecast yearly inflation experiences for these various types of households for the years 1978–2012. These forecasts are reported in Table 3.
Predicted yearly household inflation experience by household composition, age, expenditures and homeownership status

* €12,500.
** €20,000.
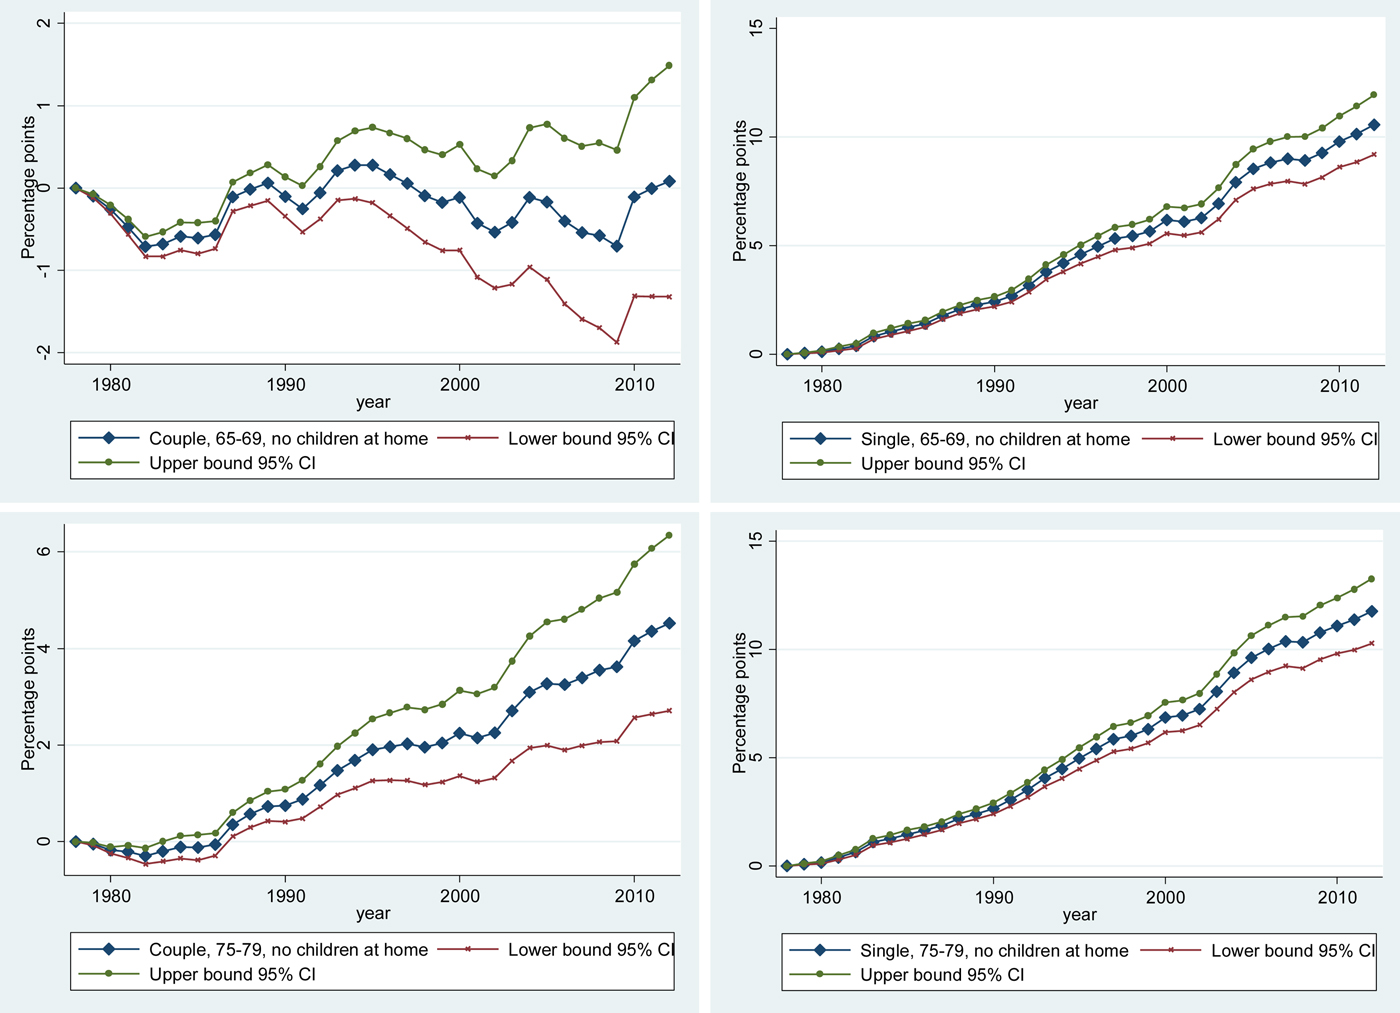
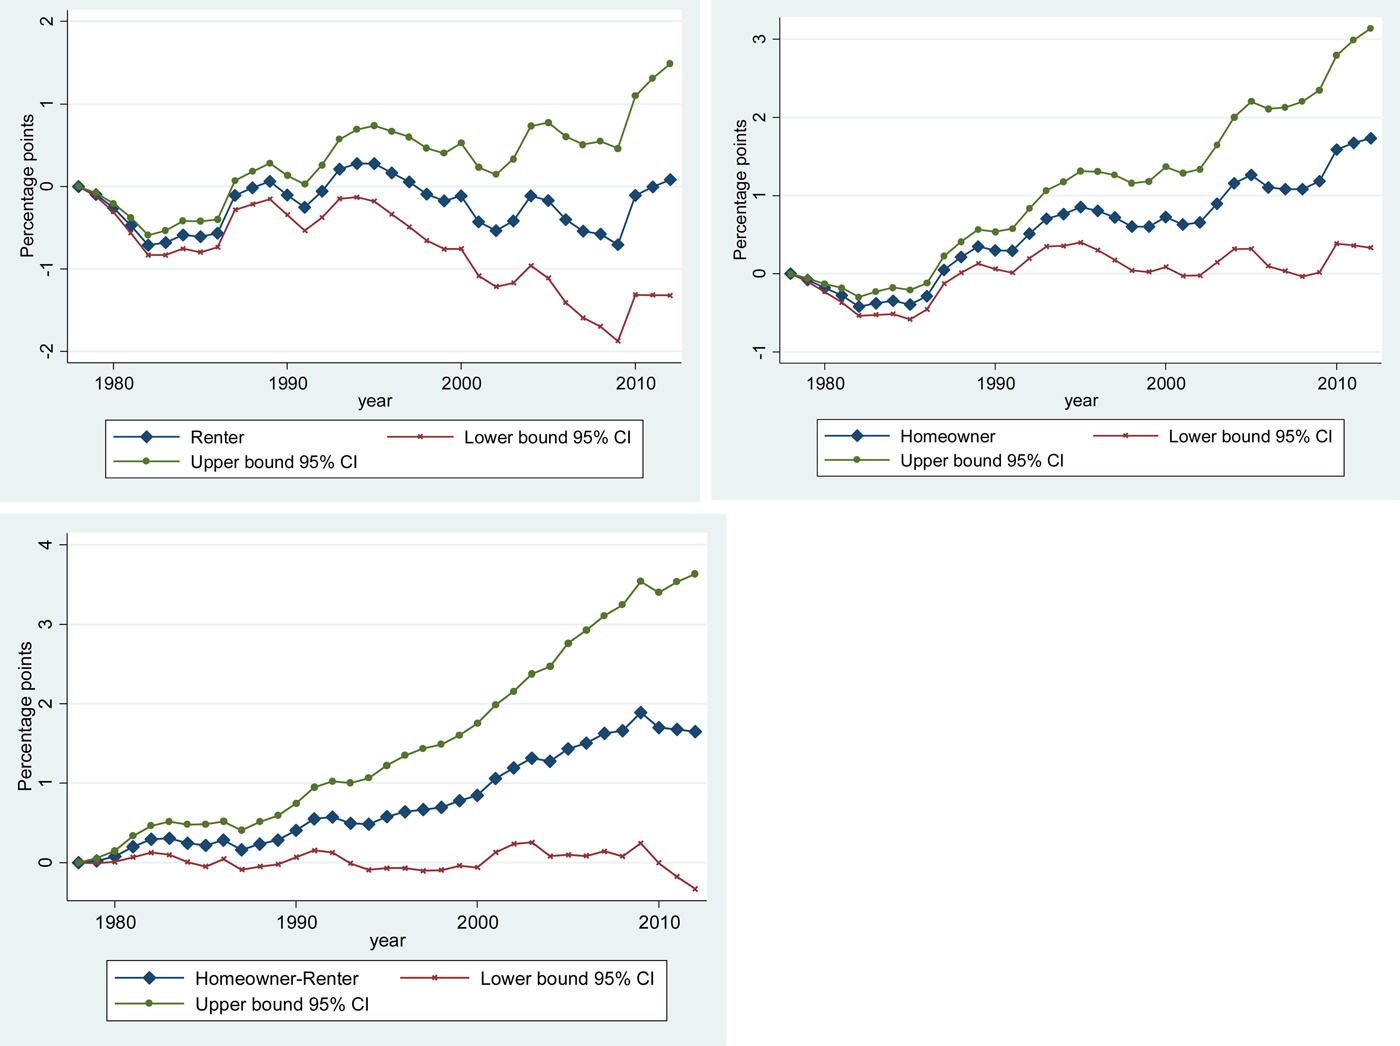
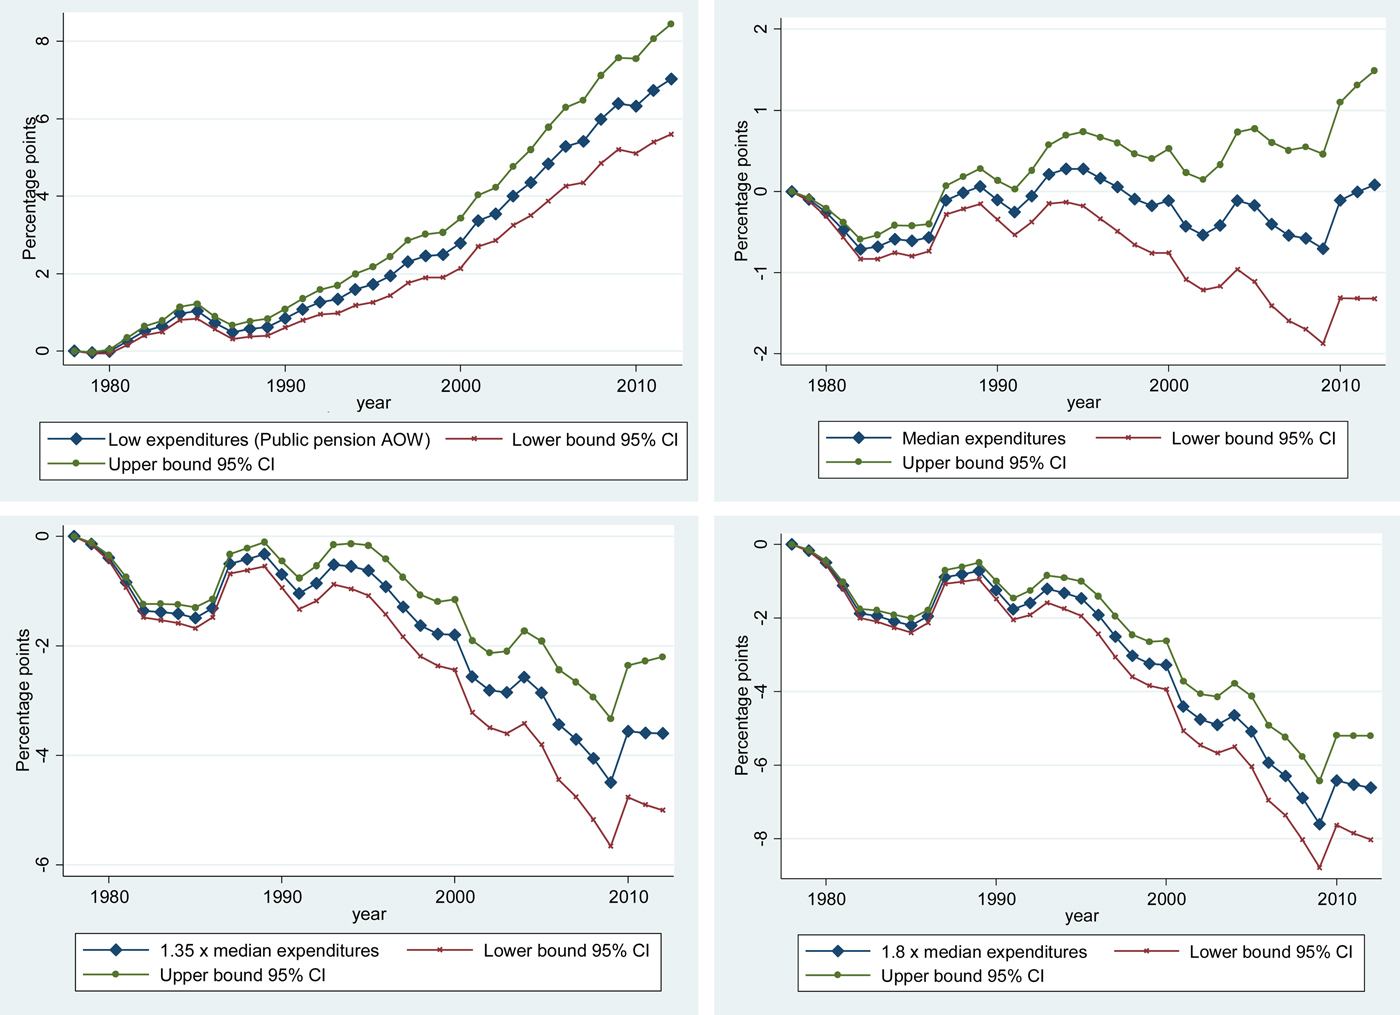
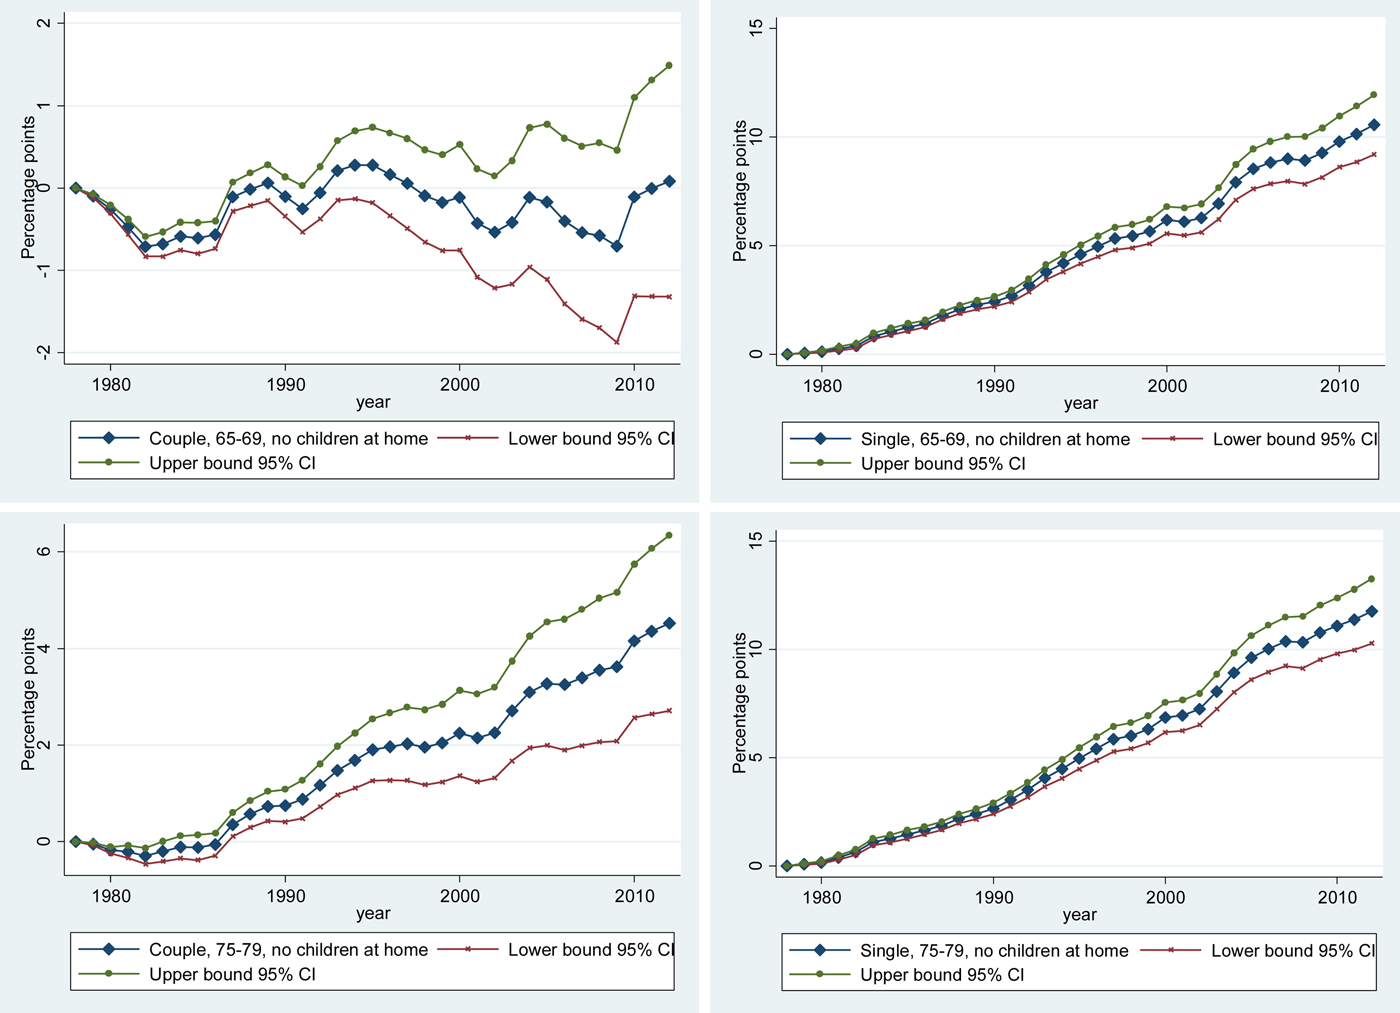
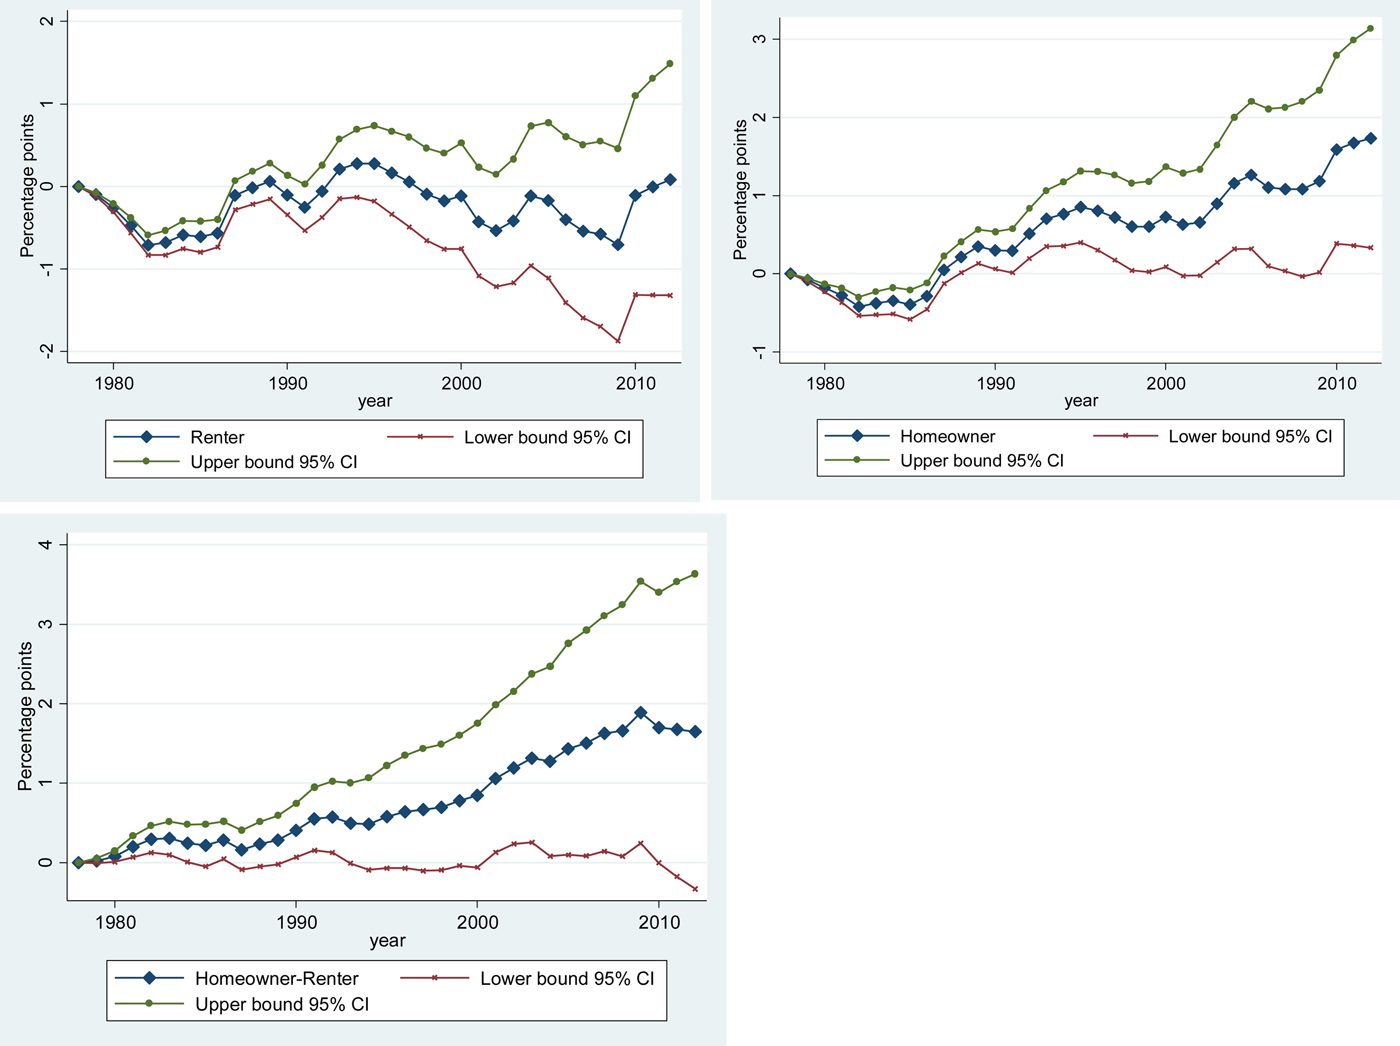
In the discussion of the results, we also present in Figures 3–5 accumulated inflation experiences for the years 1978–2012 based on equation (1). This makes it possible to extrapolate from short-term differences in inflation experiences between households that may average out over time and to have a long-term view of differences in inflation experiences between types of households that have been persistent over a 35-year period (1978–2012). For this purpose, we also present confidence intervals to provide insight into the statistical significance of our findings. Finally, in Figures 3–5, all results are presented relative to the official CPI and show whether a specific type of household has experienced an accumulated inflation over the long term that has been above or below what an average household experienced.
(Colour online) Price indices by age and household composition for retirees, compared to the CPI development.
(Colour online) Price indices for a 65–69 year-old couple that either rents or owns, compared to the CPI development.
4.1 Main empirical results
In the discussion of our results, we have applied a 5% level of confidence for statistical tests. The top left graph in Figure 3 shows that retired couples age 65–69 experience about average inflation. The most dominant picture of the other three graphs in this figure is that single persons experience a higher inflation than couples and that inflation experiences increase with age. To break it down, Table 3 shows that retired single persons age 65–69 have experienced a yearly inflation rate that is 0.13 percentage points higher than for an average household. Retired couples age 75–79 have experienced a yearly inflation rate that is 0.05 percentage points higher than for an average household. Taking into account the confidence intervals, the inflation experiences of retirees who rent and those who own are not significantly different from the inflation experience of an average household (Figure 4). Figure 5 shows that inflation experience decreases with the level of total household expenditures. Compared with an average household, retirees with low expenditures (about €12,500) have an accumulated inflation experience that is about 7 percentage points higher than that of an average household (top left graph). This amounts to about 0.09 percentage points higher yearly inflation (Table 3). Likewise, the two bottom graphs in Figure 5 are for retirees with levels of total expenditures equal to, respectively, 1.35 and 1.8 times the median level of standardized total expenditures and show that these retirees have experienced lower inflation compared with average households. For retirees with 1.8 times median expenditures this amounts to an average of 0.10 percentage points lower yearly inflation (Table 3). For an extreme case, a single person aged 80 or over and with low expenditures has an 0.29 percentage points higher yearly inflation experience than an average household (Table 3).
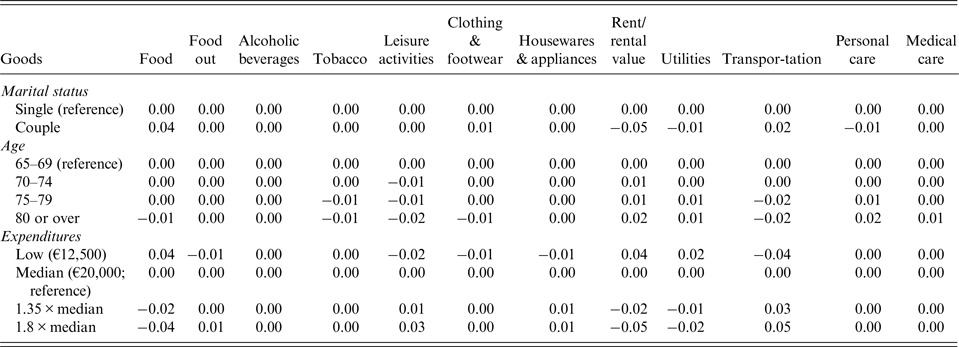
Table 4 provides insights into what causes the significant differences in household inflation experience by age, marital status and level of expenditures. As mentioned above, the assumption that all consumers face the same prices implies that our predicted differences in inflation experience between households are solely determined by differences in predicted expenditure patterns. The table shows that couples, compared with singles, spend a relatively small share of their budget on rent, for instance, and a relatively large share on food. This, together with the fact that rents have increased relative to CPI and the price of food has decreased relative to CPI (Figure 2), results in couple households experiencing lower inflation than single person households. Table 4 also shows that, compared with 65–69 years old households, older households spend less of their budget on food and leisure activities and more on rent. These differences in spending patterns, together with increasing rents and decreasing prices for leisure activities and food (Figure 2), result in a higher inflation experience for older retirees. The table together with the relative price changes in Figure 2 furthermore show that the significant differences in inflation experience between groups of retirees with different levels of total expenditures can be attributed to relatively strong rent increases and increases in the prices for goods, such as utilities, on which retirees with low total expenditures spend more, along with decreases in the prices for goods, such as leisure activities (including vacations), on which they spend less than retirees with higher total expenditures.
(Colour online) Price indices for a 65–69-year-old couple by level of total household expenditures, compared with the CPI development.

Difference in the predicted budget shares by household type, age of head of household and household expenditures, compared with, respectively, a single person household, age 65–69, with median standardized total household expenditures during retirement (€20,000)

5 Conclusions and discussion
This paper set out to analyze differential inflation experience among retirees. In particular, the aim was to identify groups of retirees that have experienced above-average price inflation and could be considered vulnerable when confronted with a drop in income, as has been the case in recent years in the Netherlands in the aftermath of the recent financial crisis. We analyzed expenditure patterns using data from the 1978–2004 Dutch Budget Surveys and, by combining this with price information for the years 1978–2012 provided by Statistics Netherlands, computed inflation experiences for different types of retired households based on price developments, household composition, age and level of total expenditures. For this we used an empirical framework based on the theory of consumer demand that explicitly makes the link between expenditure patterns and inflation experiences of households.
We found that over a 35-year period (1978–2012), single person households have had higher inflation experiences than couple households and that inflation experiences are higher for older households than for younger ones and for low-expenditures households than for high-expenditures ones. These differences are statistically significant at the 5% level and are the result of relative price increases in goods, such as rent and utilities, on which single, low-expenditures and older people spend relatively more of their budget, coupled with relative price decreases in goods, such as leisure activities (including vacations), on which these groups spend relatively less of their budget than the average household. Nevertheless, the differences we found in inflation experiences across the various types of households were rather small and might be considered too small to be of economic significance. Differences in expenditure patterns across people of different ages and levels of total expenditures have therefore not led to substantial or persistent differences in their inflation experiences in the past few decades.
Our findings together with those for the UK discussed in the introduction, suggest that the relatively high inflation for UK retirees is likely to be related to total expenditures rather than to the fact they are retired. Further research for the UK can provide more insights into this possible explanation and our study provides the statistical framework to do so.
Our paper has several limitations, some of which can be addressed in future work. An important limitation that is likely to also be present in future studies is the common price assumption, that is that all households face the same prices. It is a reasonable expectation that relatively poor people shop in stores with lower prices than those to which relatively affluent people go. This may produce an overestimation of the differences in inflation experiences between low- and high-expenditures households. If one could find a way to take this issue into account, it could further mitigate the differences in inflation experiences. Another limitation concerns the fact that, in accordance with the official inflation rate calculations, we assume that the price corresponding to rental value is the same as that for rent. Since the rent price index mostly covers accommodations in a highly regulated rental market, one might question the validity of this assumption, and more research is needed.
Our main findings imply that it is quite reasonable to use the CPI when calculating the impact of a policy reform on the standards of living for different groups of people, without taking into account possible changes in their expenditure patterns. We believe that there has been little impact of reforms on spending patterns of retirees up until 2012. However, future research should assess this conclusion in more detail and use more disaggregated price information and more recent budget data to capture the consequences of the reforms that have taken in the last few years, since they may have a strong impact on household spending patterns over the years to come.Footnote 9 , Footnote 10 For instance, only very recently the reforms in the health insurance and long-term care systems have resulted in fewer health services being covered by health insurance, a minimum compulsory own-risk cover (which can be optionally increased) and copayments for long-term care that depend on both income and assets. Inherent to health care services is that demand is rather inelastic and increases with age. If the price developments in health care services exceed that of the population CPI, it will yield higher inflation experiences for people who are relatively more unhealthy, a group that is likely to include more retirees than, for instance, workers. Another reform that may have an impact on inflation experiences is the very recent reform of the housing market, which stipulates, for instance, that rent increases be tied to the quality of the accommodation. As with health services, housing services are rather inelastic, and if rents rise relatively fast it may especially affect the inflation experience of renters. Under the assumptions that increases in rents and the prices of health services are exceeding the CPI and that demand for such services is inelastic, one could infer that renters and people with a high demand for health services will experience relatively higher inflation. Many of the reforms, however, have a strong income component, which makes it rather speculative to draw strong conclusions about how such reforms might relate to the inflation experiences of households with low- and high expenditures.
What is apparent is that given the pension, housing and health care reforms of last few years, it seems highly advisable to monitor over the years to come household spending patterns closely and determine if there are any substantial or persistent changes in the differences in inflation experiences across households. The statistical framework presented in this paper could be used for this. Taken together with more detailed price information and up-to-date information on the spending patterns of households, such a framework would provide the necessary insights into the consequences of reforms on the differences in inflation experiences across households and, through this, on their standards of living.
Acknowledgements
This paper is the result of work commissioned by the Partner Research Council of Netspar and the first findings have been reported in Kalwij et al. (Reference Kalwij, Alessie, Gardner and Ali2015) (Topicality project ‘Consumption needs of pensioners and the inflation measure for pension indexation’). We would like to thank the seminar participants at the various Netspar workshops, the Editorial Board of Netspar, and the anonymous reviewers for their valuable comments and suggestions.
Disclaimer
The opinions expressed in this paper are those of the authors and not necessarily those of Willis Towers Watson and European Actuarial Services.
APPENDIX
Sample size and weighted sample averages of the main background variables by survey year

Ordinary least squares estimation results of equation (4)