


Introduction
A major cause of flooding in Norway is the combination of intense snowmelt and precipitation. In order to be able to forecast these flooding events, we need a reliable forecast of precipitation and temperature, and a good estimate of the snow reservoir and its coverage in the catchment at the time of the forecast. The Swedish rainfall–runoff model, HBV (Reference BergströmBergström, 1992; Reference SælthunSælthun, 1995), is used operationally for flood forecasting at the Norwegian Water Resources and Energy Directorate (NVE) and has been supplemented with a snow routine developed for use in Norway which accounts for the development of the snow reservoir and the snow coverage at different altitude levels (Killingtveit and Sælthun, 1995).This routine is developed under the assumptions that precipitation as snow is log-normally distributed in space with a fixed coefficient of variation and perfectly correlated in space. These assumptions imply that, at all times, the maximum of a new snowfall event will appear in exactly the location where the maximum snowfall from previous snowfall events is already found. In addition, the distribution of accumulated snow will have a fixed coefficient of skew and therefore not comply with the principle of the central limit theorem (Reference FellerFeller, 1971, p. 258) which implies that the distribution of accumulated events is less skewed than single events. The ablation process is modelled as uniform over the snow-covered fraction of the catchment.
From studies of the spatial distribution of daily precipitation, a positively skewed distribution has been favoured. The exponential distribution has been a popular choice (Reference Gao and SorooshlanGao and Sorooshian, 1994; Reference SkaugenSkaugen, 2002), and other studies have indicated that a gamma distribution is suitable (Reference Onof, Mackay, Oh and WeatherOnof and others, 1998; Mackay and others, 2001). However, studies of the spatial distribution of accumulated snow water equivalent (SWE) in forested areas, often measured at the peak of the accumulation period, show that a normal distribution is often a good model (Reference Marchand and KillingtveitMarchand and Killingtveit, 1999; Reference Alfnes, Andreassen, Engeset, Skaugen and UdnæsAlfnes and others, 2004). In alpine areas, more skewed distributions are usually found (Reference Marchand and KillingtveitMarchand and Killingtveit, 2002; Reference Alfnes, Andreassen, Engeset, Skaugen and UdnæsAlfnes and others, 2004). In developing an accumulation model for snow, we should thus take into account that single events are positively skewed, whereas the distribution of the accumulated events should converge towards a less skewed or, in some cases, even a normal distribution. In line with the principles of the central limit theorem, the rate of convergence towards a less skewed distribution should depend on the number of accumulations, the shape of the distribution and the spatial correlation of single events.
In Reference SkaugenSkaugen (1999), the distribution of accumulated snow was modelled as a summation of independent, identically distributed gamma variables. This modelling framework allows positively skewed gamma-distributed single events, whereas the distribution of the accumulated events will also be gamma-distributed but with parameters determined by the original gamma distribution and the number of accumulations. The distribution of the accumulated events will converge to a normal distribution with a rate depending on the parameters of the gamma distribution and the number of events. This approach is continued in this study and we introduce a gamma-distributed unit SWE. An accumulation or ablation event, which may comprise a number of units, will, under an assumption of independence, also be gamma-distributed.
The approach adopted in this study is to analyze the dynamical properties of the spatial distribution of snow (or SWE), and to represent these in a stochastic model suitable for implementation in a rainfall–runoff model. We will further study the features of the conditioned (not including zeros) and non-conditioned (including zeros) spatial statistics of snow, and develop expressions that explicitly assess the fraction of snow-covered area.
Modelling the Accumulation and Ablation of Snow Using Sums of Gamma-Distributed Variables
The understanding of snow depth and snow cover, measured at a certain time t, as a function of the history of accumulation and ablation of preceding events, is fundamental to the proposed methodology. The modelling approach here is assumed suitable for a scale denoted as mesoscale defined as 50 mto a few kilometres (see Reference SandSand, 1990).
Let us consider y(x = xj; t = ti) to be the SWE for a snowfall event measured at time ti at position xj in the catchment. The variable y constitutes a stochastic process in time and space, and initially we assume the stochastic process y to be stationary in time, homogeneous in space, and independent in both time and space. Then the temporal distribution of y at any point x must coincide with the spatial distribution of y at any time t. Under these assumptions we have the rather unrealistic implication that the mean areal SWE is equal for every snowfall event and that the individual snowfall events are uncorrelated in space. In a further discussion of the model we have to take into account temporal and spatial deviations from the assumptions of independence, homogeneity and stationarity of the process. Let us fix the point (x = xj) and assume that the temporal distribution of y is a two-parameter gamma distribution, y(x = xj; t) = G(ν; α), with probability density function (PDF):

where α and ν are parameters. The mean equals E(y) = ν/α, and the variance equals Var(y) = ν/α2. By introducing the gamma variable u, with mean E(u) = 1, and variance Var(u) = 1/ν the temporal fluctuations of y around its mean, E(y) = ν/α, are taken into account. We can rewrite the process y as:

Now, to include the spatial fluctuations, let us assume that the spatial distribution of y at a fixed time ti also is gamma, with mean equal to E[y(x; t = ti)] = uiν/α and variance equal to Var[y(x; t = ti)] = uν/α2. Thus, by introducing a gamma variable w with mean E(u) =1, and variance Var(u) =1/ν, the spatial process of y can be written as:

If we further let x and t vary, we see that the process y is not gamma-distributed, but distributed as the product of two gamma distributions scaled with ν/α:

It can further be seen that if we include the spatial fluctuations, Equation (2) should be written:

To approximate the temporal and the spatial distributions as gamma distributions, we thus have to keep one of the variables, u or w respectively, constant. In the temporal domain, this is achieved by setting w constant in time and equal to 1, which implies that the measured snowfall at each event is the mean areal snowfall, which is exactly the procedure when using rainfall–runoff models driven with precipitation measurements. In the spatial domain, u is kept constant and we want to consider the spatial distribution of the accumulation of y(x; t = ti) for i = 1; . . . ; n events, which we denote z′(x; tn):

According to Reference FellerFeller (1971, p. 47), the variable z′(x; tn) is gamma-distributed with parameters α and nν if z′ is the sum of identically and independent gamma-distributed variables,

where ū is the average value of ui at time tn. We see that when n grows large, ū converges to the expectation of u which is equal to 1. The spatial distribution of z′(x; t = tn) is thus approximated as a gamma distribution. z′(x; t = tn) = G(nν; α), with mean:

and variance:

The above derivation is basically thought appropriate for accumulation of a stationary variable for a certain amount of time, i.e. precipitation as snow. The melting process is more complicated, as the melting is more intense as the temperature increases during the spring, introducing a temporal non-stationarity of the process. However, we approximate ablation also with the presented approach and keep account of the variable n by letting accumulated or melted amounts of snow be, at any time, gamma-distributed with parameters uν and α. The accounting is done by keeping track of u and n and update n as nt+1 = nt + ut, for accumulation, and nt+1 = nt - ut, when a melting event has occurred. In this way the spatial distribution of SWE is approximated as a gamma distribution where the shape parameter nν changes in time according to accumulation or melting events.
Intermittent Snow Reservoir in a Catchment
We need to incorporate the presence of snow-free areas in the catchment into the methodology presented above. We let z and z′ denote accumulated snow including and not including zeros respectively. For the sake of simplicity the z and z′ represent the spatially distributed values of SWE at the time t of interest, z(x; t = tn). For a catchment suitably subdivided into r pixels, a number, s, of these pixels contain snow. The relationship between the conditional and unconditional mean is then:

where p = s/r is the fraction of the drainage basin of positive accumulated snow, often termed the snow-covered area (SCA). For the second-order moment, we have:

The non-conditional variance can then be computed as:

We can substitute Equations (10) and (11) into Equation (12) and obtain:

We can further replace E(z′2) by Var(z′) + E(z′)2 and we obtain an expression for the unconditional variance as a function of the conditional mean, variance and the snow coverage p as:

By inserting the gamma parameters for the unconditional moments, Equation (14) becomes:

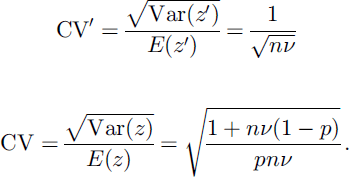
Consequently the conditional and unconditional coefficients of variation CVare computed as:
and

The skew can be determined for the conditional gamma distribution as:
We know, by the model proposed above, the conditional mean and variance of the SWE, and we can in principle use the fraction of coverage, p, obtained by remote sensing to determine the unconditional moments of the distribution of SWE by Equations (10) and (13). However, remotely sensed information is rare and cannot be counted on as an input for operational use. This necessitates a methodology to estimate the SCA, or p, from an assessment of melting and accumulation events. We have insufficient information to estimate p as a melting event occurs by using Equation (10) or (13), because p can take on any value corresponding to any value of the unconditional moments for fixed values of the conditional moments. This implies that we have to guess how p relates to a melting event, and decide on a functional description of this relationship. What we seek to establish is a relation between melted amount, utν/α, the updated conditional mean of SWE, (nt - ut)ν/α, and SCA. For a given spatial distribution of SWE, where we have initially full coverage (p = 1), there exists a set of p-values corresponding to different melting events. Typically, for a certain amount to be melted, we would expect significant reduction in p if the distribution was very skewed, and not if the distribution was more normal. This implies that different spatial distributions of SWE would provide different sets of corresponding p-values and melting amounts. In Figure 1, we have drawn two such sets which correspond to how we intuitively perceive the melting process. For a fixed melting amount, say 10% of the mean areal SWE, we would expect significant changes in the SCA with a skewed distribution, whereas for a less skewed distribution (i.e. a normal distribution) the effect on the SCA from a melting event would be small. The upper curve is estimated from a forested area, whereas the lower curve is estimated from an alpine area. The sets of corresponding p-values and melting amounts can thus be seen as scaled versions of the gamma distribution of conditional SWE. The new scaling parameter is estimated so that the probability of melting less than or equal to the entire present mean areal SWE is equal to 1, i.e. if the entire present snow reservoir was to melt, the corresponding SCA would naturally be zero. We thus estimate the new scale parameter α′ so that:

Corresponding sets of possible melting amounts and changes in SCA. Upper curve is for forested area and lower curve is for alpine area.

where f() is the PDF of the gamma distribution, ntν/α is the mean areal SWE at the time t and Δ is some small chosen measure (e.g. Δ =0.001). The choice of Δ represents the level of truncation of the distribution and should not be arbitrary in that it will define the minimum spatial resolution of our estimates of SCA. The skew of the distribution is not affected by the new scale parameter. With this approach the evolution of the SCA is directly linked to the dynamical shape parameter, nν, of the spatial distribution of SWE.
For ablation:
The updated SCA at time t after melting ut equivalents is:

where α′ is the new scale parameter and estimated with Equation (18).
For accumulation:
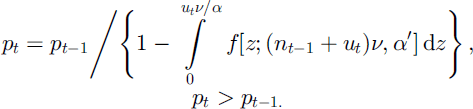
To update the SCA after accumulation, we apply the same reasoning as for ablation. The snowfall at time t of ut equivalents gives us a new scaled version of the gamma distribution f[z; (nt-1 + ut)υ; α′], where α′ is estimated according to Equation (18). The previous pt-1 (before the new snowfall, ut), which is known, is seen as if a similar amount, ut, were melted from the new pt. The updated SCA at time t, after accumulating ut equivalents, will be:
Case Study
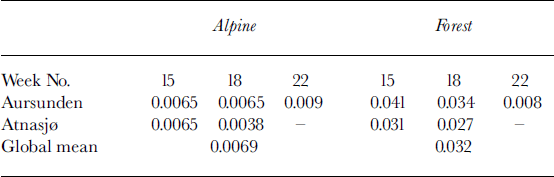
The methodology put forward has been implemented in the HBV model (Reference BergströmBergström, 1992) or, more specifically, the “Nordic” HBV model (Reference SælthunSælthun, 1995) and tested for two catchments, Aursunden (835 km2) and Atnasjø (465 km2), located in southern Norway (see Fig. 2). Both these catchments contain parts that can be considered alpine (no vegetation) and forested (6.7% lake, 43.3% forested and 50% alpine for Aursunden, and 1.9% lake, 13.1% forested and 85% alpine for Atnasjø). The general framework of the HBV model has been kept, and it is only the distribution aspects of the snow routine that are changed. The snow is melted according to a degree-day approach, which is considered to perform as well as an energy-balance approach at the temporal resolution of 1 day (Reference AndersonAnderson, 1976). It is assumed that the parameter α is class-specific for the two landscape classes alpine and forest. This parameter was estimated by solving Equations (8) and (9) for α, giving α = E(z′)/Var(z′), and we use the measured values of E(z′) and Var(z′) from a series of snow courses performed during the 2002 season (see Reference Alfnes, Andreassen, Engeset, Skaugen and UdnæsAlfnes and others, 2004). As Table 1 illustrates, the parameter α was significantly different with an order of magnitude for the two landscape classes forest and alpine. For weeks 15 and 18, α did not vary much in time or in space, whereas for week 22 the estimates became very uncertain due to advanced snowmelt and few measuring points. The measurements did, however, give confidence to an assumption of global values of α for alpine and forested areas.
Location map showing the catchments Aursunden and Atnasjø, south Norway.
Parameter α estimated for the two catchments for alpine and forested areas for weeks 15, 18 and 22
The hydrological model corrects the input values of precipitation for both catch deficiency and lapse rate. Taking this into account, it was considered most appropriate to estimate the ratio ν/α as the average daily precipitation (liquid or solid) of days with precipitation from the precipitation station associated with the catchment in question. With the ratio ν/α and α known, ν could be estimated.
Results and Discussion
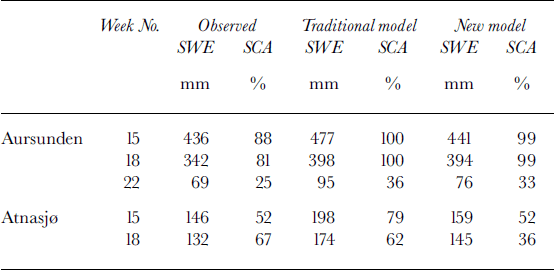
Figure 3 shows the temporal development of the snow reservoir and modelled and observed hydrograms for the traditional HBV model (Fig. 3a) and the HBV model with the proposed snow distribution (Fig. 3b), together with the temporal development of the SCA (Fig. 3c) for the two models for Aursunden for winter 2002. For this catchment, the model was recalibrated with the objective, automatic calibration procedure PEST (Reference Brebber, Doherty and WhyteBrebber and others, 1994) after the new model for snow distribution was implemented. This explains the precipitation differences observed between Figure 3a and b . Figure 4 shows the same for Atnasjø, but here the model was not recalibrated after implementation of the new model for snow distribution. In the figures, we also find the estimated mean areal SWE and SCA from snow courses performed during weeks 15, 18 and 22 for Aursunden and weeks 15 and 18 for Atnasjø (see Reference Alfnes, Andreassen, Engeset, Skaugen and UdnæsAlfnes and others, 2004). Table 2 shows a comparison between observed and estimated values of SWE and SCA. From Figures 3 and 4 and Table 2 we see that for both catchments the estimated snow reservoir (mean areal SWE) of the proposed model is in better agreement with observed values than that of the traditional model. We see that the spring 2002 runoff is not perfectly modelled by either model, although for Atnasjø the peak of the spring flood is better estimated by the traditional model. Comparing the modelled hydrograms, the traditional model seems slightly to overestimate the snow reservoir, and maintains a significant snow reservoir for a longer period than the proposed model. The prolonged contribution of meltwater in the traditional model overestimates the runoff in late spring. The temporal development of the SCA for the Aursunden catchment is slightly better modelled by the proposed model for all the dates when compared to SCA estimated from the snow courses (Fig. 3c; Table 2). For Atnasjø (Fig. 4c; Table 2) the SCA modelled by the proposed model agrees very well with observed values for week 15, but the proposed model fails to increase the SCA sufficiently as a response to the heavy snowfall of 30 April. The traditional model, however, clearly overestimates the SCA for week 15 and is approximately correct for week 18, though, one must suspect, for the wrong reason.
Snow reservoir and runoff modelled by traditional snow distribution (a) and with the new snow distribution (b) for Aursunden. Black line represents observed runoff, and grey line represents simulated runoff. In (c), the temporal development of the SCAfor the traditional model (black line) and the new model (grey line) is shown. Asterisks represent observed values of SCA and SWE.
Same as Figure 3, but for Atnasjø.
Comparison of observed and estimated SWE and SCA with traditional and new snow-distribution models for catchments Aursunden and Atnasjø, for weeks 15, 18 and 22
Updating the SCA from remotely sensed data
In principle, we would like to update the rainfall–runoff model with SCA estimates from remotely sensed data. Let us say that we obtain an SCA estimate from remotely sensed data that differs from that of the model. We then have two alternatives. One is that the SWE distribution is wrong but the water balance (the conditional moments) is assumed correct, and we simply update the unconditional moments according to Equations (10) and (15) with the observed SCA. The other option is that the water balance (conditional moments) is incorrect due to wrong input (precipitation and temperature) or that the melting procedure is wrongly calibrated so that more or less water has left the catchment. The latter case is more complicated in that we have to update the conditional moments conditioned on an observed SCA. A possible way forward is to assume that the general statistical model is correct and increase or decrease the n, and thus the conditional moments, according to Equations (18–20) (with iterated α') until we have an SCA that corresponds with the observed one. This is a topic for further development of the model.
Assumptions of independence of the statistical model
The procedure described in this study is of an approximate nature in that the assumptions of independence in time and space may be compromised to an unknown degree. Regarding the assumption of independence in space of y, we know from studies of precipitation events that single events usually exhibit significant correlation in space (Reference SkaugenSkaugen, 1997). For snowfall events, very little literature on the subject exists. If precipitation as snow were considered spatially dependent, one would expect to find the measurements of accumulated snow (z′) to be correlated in space. However, several investigations report low spatial correlation for a range of distances (Reference Gottschalk and JutmanGottschalk and Jutman, 1979; Reference Elder, Dozier and MichaelsenElder and others, 1989; Reference Faanes and KolbergFaanes and Kolberg, 1996). The studies of the first and last of these references were carried out for Swedish and Norwegian data respectively and are thus representative for the present study. A possible reason for the observed low spatial correlation is that falling snow is more susceptible than rain to wind redistribution when falling, which might disturb the original spatial structure of the precipitation field, and redistribution also occurs after snow has settled on the ground (Reference Essery, Li and PomeroyEssery and others, 1999).
In order to investigate possible temporal dependencies, data from a snow pillow, Vauldalen (820ma.s.l.), located in the Aursunden catchment, was tested for autocorrelations. Out of 16 sequences with 413 days with snowfall, only 5 showed significant autocorrelation for lag 1 day and none showed significant autocorrelation for longer time lags. Temporal independence can thus be assumed
Conclusions
Modelling the snow reservoir as sums of gamma-distributed variables takes into account in a realistic way the dynamic properties of the spatial distribution of SWE, in that it allows for a dynamical change in the shape of the distribution in accordance with observations.
The new spatial snow distribution compares favourably to the traditional one with respect to completing the melting of the snow reservoir and to the temporal development of SWE and SCA.
The development of snow-free areas is, with the pro-posed methodology, explicitly linked to the shape of the spatial distribution of SWE in the catchment.
A topic for further development is to incorporate the observed SCA from remotely sensed data to update the conditional moments of SWE.
Acknowledgements
This study is part of the SnowMan project supported by the Norwegian Research Council and the EnviSnow project supported by the European Commission under the fifth framework programme. The help of the anonymous referees who helped to improve the clarity of the paper is gratefully acknowledged.



