1 Introduction
Turbulent flows near smooth walls are characterised by flow structures of different size and intensity that have been observed and described by very impressive flow visualisations by Kline et al. (Reference Kline, Reynolds, Schraub and Rundstadler1967). In laboratory experiments it is rather difficult to measure any quantity, therefore some issue of the flow complexity cannot be investigated. The evolution of the hardware and software necessary for the solution of the nonlinear Navier–Stokes equations has allowed us to evaluate any flow variable and to increase our knowledge of the physics of turbulent flows. The simulations were performed for a large number of turbulent flows and in particular for wall-bounded flows such as boundary layers, circular pipes and two-dimensional channels. In this paper the study is focused on flows in two-dimensional channels past smooth and corrugated walls. The first direct numerical simulation (DNS) of a two-dimensional channel by Moin & Kim (Reference Moin and Kim1982) can be considered a scientific revolution, in fact, after this publication, a large number of scholars directed their research work towards the use of numerical methods to produce and analyse turbulent data. The complex physics of wall bounded turbulent flows therefore was studied through the evaluation of any kind of statistic. The direct comparison between numerical and laboratory flow visualisations in Moin & Kim (Reference Moin and Kim1997) can be considered a first evidence that the Navier–Stokes equations are the valid model to describe the evolution of turbulent flows. After simulation at low Reynolds number (
 $R_{\unicode[STIX]{x1D70F}}=u_{\unicode[STIX]{x1D70F}}h/\unicode[STIX]{x1D708}=180$
with
 $u_{\unicode[STIX]{x1D70F}}$
the friction velocity
 $h$
half channel height and
 $\unicode[STIX]{x1D708}$
the kinematic viscosity) there was a large effort to increase the Reynolds number. The relevant contributions, among several groups, were done by Jiménez & Hoyas (Reference Jiménez and Hoyas2008) up to
 $R_{\unicode[STIX]{x1D70F}}=2000$
by Bernardini, Pirozzoli & Orland (Reference Bernardini, Pirozzoli and Orland2014) up to
 $R_{\unicode[STIX]{x1D70F}}=4000$
, by Lee & Moser (Reference Lee and Moser2015) up to
 $R_{\unicode[STIX]{x1D70F}}=5200$
and recently by Yamamoto & Tsuji (Reference Yamamoto and Tsuji2018) up to
 $R_{\unicode[STIX]{x1D70F}}=8000$
. Some of the statistics in these papers together with others at low Reynolds number in Orlandi, Bernardini & Pirozzoli (Reference Orlandi, Bernardini and Pirozzoli2015) are used in this study to calculate quantities linked to the flow structures, and to investigate their dependence on the Reynolds number. Namely these are the shear rate parameter
 $S^{\ast }=Sq^{2}/\unicode[STIX]{x1D716}$
defined as the ratio between the eddy turnover time
 $q^{2}/\unicode[STIX]{x1D716}$
(
 $q^{2}$
is twice the turbulent kinetic energy and
 $\unicode[STIX]{x1D716}=2\unicode[STIX]{x1D708}(s_{ij}s_{ij})$
is the isotropic dissipation rate) and the time scale of the mean deformation
 $1/S=2/(\text{d}U/\text{d}x_{2})$
(
 $U$
stands for
 $\langle u_{1}\rangle$
). The shear parameter was used by Lee, Kim & Moin (Reference Lee, Kim and Moin1990) to provide evidence that the elongated wall structures, observed by Kline et al. (Reference Kline, Reynolds, Schraub and Rundstadler1967), were not generated by the presence of the solid wall. The mean shear rate
 $S$
generates them if
 $S^{\ast }$
is greater than a threshold value. As was shown by Orlandi et al. (Reference Orlandi, Bernardini and Pirozzoli2015), the profiles of the shear parameter do not greatly vary with the Reynolds number in the presence of smooth walls. These observations can be considered a first evidence that, in real experiments, limitations of the measurement techniques means that we cannot explain certain aspects of the complex physics of turbulent flows, in particular those strongly linked to the rate of dissipation
 $\unicode[STIX]{x1D716}$
. Some approximations allow us to get a good estimate of
 $\unicode[STIX]{x1D716}$
in the central region of the channel. These approximations are not valid near the wall. The profiles of
 $\unicode[STIX]{x1D716}^{+}$
as well as those of
 $q^{2+}$
(the superscript
 $+$
indicates wall units) are Reynolds dependent. In this paper it is shown that, near the walls, the eddy turnover time as well as the mean shear, in wall units, do not depend on the Reynolds number, therefore the shear parameters
 $S^{\ast }$
can be considered a quantity characterising the energetic scales near smooth walls.
The production of turbulent energy
 $P_{k}=-\langle u_{1}u_{2}\rangle (\text{d}U/\text{d}x_{2})$
(small letters indicate fluctuations) is strictly linked to
 $S$
. When the near-wall and the outer turbulent structures are separated, the production does not depend on the Reynolds number. At low
 $Re$
, on the other hand, the maximum of
 $P_{k}^{+}$
, from zero for the laminar regime jumps to a value
 $0.15$
at the transitional Reynolds number. Hence it gradually grows with
 $R_{\unicode[STIX]{x1D70F}}$
to saturate at
 $500<R_{\unicode[STIX]{x1D70F}}$
at a value equal to
 $0.25$
. Due to the key role of
 $S$
the one-dimensional statistics profiles can be projected onto the eigenvectors of the tensor
 $\unicode[STIX]{x1D61A}_{ij}$
. In this frame there is a negative compressive
 $S_{\unicode[STIX]{x1D6FC}}$
and a positive extensional
 $S_{\unicode[STIX]{x1D6FE}}$
strain. The turbulent kinetic production in this local frame is
 $P_{k}=-(P_{\unicode[STIX]{x1D6FC}}+P_{\unicode[STIX]{x1D6FE}})$
with the terms
 $P_{\unicode[STIX]{x1D6FC}}=R_{\unicode[STIX]{x1D6FC}\unicode[STIX]{x1D6FC}}S_{\unicode[STIX]{x1D6FC}}$
and
 $P_{\unicode[STIX]{x1D6FE}}=R_{\unicode[STIX]{x1D6FE}\unicode[STIX]{x1D6FE}}S_{\unicode[STIX]{x1D6FE}}$
greater than
 $P_{k}$
. Their profiles show that the compressive strain generates more kinetic energy than that destroyed by the extensional one. The projection of the statistics along the eigenvectors of the tensor
 $\unicode[STIX]{x1D61A}_{ij}$
shows a decrease on the anisotropy of the velocity and vorticity correlation and can give insights into turbulence closures. The stresses in the spanwise direction do not change in this new reference frame with
 $S_{\unicode[STIX]{x1D6FD}}=0$
.
The production of turbulent kinetic energy can also be expressed in a different way (Orlandi (Reference Orlandi2000) at p. 211) with
 $P_{k}=P_{T}+P_{C}$
. This expression is derived by the Navier–Stokes equation in rotational form, where
 $P_{C}=\unicode[STIX]{x2202}U\langle u_{1}u_{2}\rangle /\unicode[STIX]{x2202}x_{2}$
is related to the action of the large eddies advecting the turbulence across the channel and
 $P_{T}=U(\langle u_{3}\unicode[STIX]{x1D714}_{2}\rangle -\langle u_{2}\unicode[STIX]{x1D714}_{3}\rangle )$
is linked to the energy transfer from large to small eddies (
 $\unicode[STIX]{x1D714}_{i}$
indicates the vorticity fluctuating components).
Orlandi (Reference Orlandi2013) in turbulent wall-bounded flows emphasised that the role of the wall-normal Reynolds stress, and therefore the statistics linked to the
 $u_{2}$
velocity fluctuations and in particular those connected to the flow structures, should be analysed. The
 $\langle u_{2}^{2}\rangle$
stress received little attention, in particular because of the difficulty in measuring
 $u_{2}$
near the walls. It is worth to recall that only this stress appears in the mean momentum equation and it is balanced by the mean pressure
 $\langle p\rangle$
. As was discussed in that paper as well as by Tsinober (Reference Tsinober2009) on p. 162, the topology of flow structures can be described by
 $-Q=s_{ij}s_{ji}-\unicode[STIX]{x1D714}_{i}\unicode[STIX]{x1D714}_{i}/2$
, where regions with
 $Q<0$
are sheet dominated and regions with
 $Q>0$
are associated with tube-like structures. In homogeneous turbulence
 $\langle Q\rangle =0$
. In non-homogeneous turbulent flows
 $\text{d}^{2}\langle u_{2}^{2}\rangle /\text{d}x_{2}^{2}=-\langle Q\rangle =\langle s_{ij}s_{ji}\rangle -\langle \unicode[STIX]{x1D714}_{i}\unicode[STIX]{x1D714}_{i}/2\rangle$
accounts for the disequilibrium between
 $\langle s_{ij}s_{ji}\rangle$
and
 $\langle \unicode[STIX]{x1D714}_{i}\unicode[STIX]{x1D714}_{i}/2\rangle$
. Hence the term
 $\text{d}^{2}\langle u_{2}^{2}\rangle /\text{d}x_{2}^{2}$
determines whether in a region there is a prevalence of sheet-like or rod-like structures. The former are inherently unsteady and roll-up, producing turbulent kinetic energy. A detailed study of the difference between the shapes of ribbon- and rod-like structures requires appropriate eduction schemes, such as those described by Pirozzoli, Bernardini & Grasso (Reference Pirozzoli, Bernardini and Grasso2010). The profiles of the turbulent kinetic energy production, in their different forms, together with the profiles of
 $\text{d}^{2}\langle u_{2}^{2}\rangle /\text{d}x_{2}^{2}$
show that the maximum production occurs in the layer separating sheet- and tubular-dominated regions. One of the goals in performing DNS of two-dimensional turbulent channels at high Reynolds numbers was and still is to investigate the Reynolds number dependence on the statistics. The aim of the present study is to see whether the above mentioned statistics, in wall units, related to the flow structures present a minor or almost a complete Reynolds number independence in the viscous and buffer layers.
A rediscovered and improved version of the old immersed boundary technique used by Peskin (Reference Peskin1972) for bio-inspired flows was developed by Orlandi & Leonardi (Reference Orlandi and Leonardi2006) to perform DNS of turbulent flows past rough walls. The method was validated in several papers and the convincing evidence of its accuracy was reported by Burattini et al. (Reference Burattini, Leonardi, Orlandi and Antonia2008) by comparing the statistics derived by the numerical experiments with those measured in the laboratory. The experiments were designed with the aim of showing that true DNS can be accomplished by the immersed boundary technique inserted into a second-order finite difference method. In this paper the corrugations are located at both walls and the solutions are obtained at intermediate values of the
 $Re$
number, namely approximately at
 $R_{\unicode[STIX]{x1D70F}}=200$
in the presence of smooth walls. Longitudinal transverse and three-dimensional elements are considered, producing a drag increase, with the exception of a geometry similar to that investigated by Choi, Moin & Kim (Reference Choi, Moin and Kim1993) which produces drag reduction. Near rough walls the flow structures change, leading to profiles of the turbulent statistics affected by the shape of the surface.
The paper is organised as follows. In § 2.1 the two-dimensional channel is analysed through the DNS data in a wide range of Reynolds numbers. It is shown that, for certain quantities, the Reynolds independence for
 $y^{+}<200$
holds. Namely
 $(q^{2}/\unicode[STIX]{x1D716})^{+}$
and even better
 $(q^{2}/D_{k})^{+}$
show a good scaling. It has been also observed that the latter grows linearly for
 $y^{+}<2$
, and that, at
 $R_{\unicode[STIX]{x1D70F}}=5200$
, there is a clear tendency to a linear growth in the outer region. The transition between one and the other linear growth occurs in a narrow layer dominated by sheet-like structures highlighted by the profiles of
 $(\text{d}\langle u_{2}^{2}\rangle /\text{d}x_{2}^{2})^{+}$
. The total rate of dissipation
 $D_{k}$
leads to a simple turbulent kinetic energy budget, that could help with the improvement of low Reynolds number Reynolds average Navier–Stokes (RANS) closures. The Reynolds number independence has been also observed in several expressions of the turbulent kinetic energy production.
To show that modifications of the velocity boundary conditions destroy the wall similarity, in § 2.2 flows past rough walls have been simulated. The numerical methods has been resumed in § 2.2.1, the global results are discussed in § 2.2.2 and the profiles of the statistics related to the friction increase or reduction in § 2.2.3. The shear parameter in § 2.2.4 and
 $(\text{d}\langle u_{2}^{2}\rangle /\text{d}x_{2}^{2})^{+}$
in § 2.2.5 show that different types of roughness promote the formation of a variety of flow structures. These structures are visualised through surface contours of
 $\unicode[STIX]{x1D714}_{2}$
in § 2.2.6. For any rough surface, in § 2.2.7, through the projection of the Reynolds stress tensor along the eigenvectors of the rate of strain tensor, it is shown that the turbulent kinetic energy produced by the compressive strain overcomes that dissipated by the extensional strain. The total rate of turbulent kinetic dissipation in § 2.2.8, as for smooth channels, leads to simplified budgets. This observation together with the proportionality between turbulent eddy viscosity, roughness function and
 $\langle u_{2}^{2}\rangle |_{W}$
at the plane of the crest, in § 2.2.9, may give new insight into RANS closures for practical simulations at high Reynolds numbers. Visualisations of instantaneous stresses in the Cartesian reference and in the strain rate reference frame show a reduction of the anisotropy near the wall in § 2.2.11 that may be useful in RANS closures. Concluding remarks are given in § 3.
2 Results
2.1 Smooth wall
The data in the web of the DNS at high Reynolds numbers by Bernardini et al. (Reference Bernardini, Pirozzoli and Orland2014), by Lee & Moser (Reference Lee and Moser2015) and by Yamamoto & Tsuji (Reference Yamamoto and Tsuji2018) are used to investigate the eventual Reynolds independence of the shear parameter and its components. The data at low
 $Re$
are those used in Orlandi et al. (Reference Orlandi, Bernardini and Pirozzoli2015). In the transitional regime simulation, at
 $R_{\unicode[STIX]{x1D70F}}=78$
, there is no separation between wall and outer structures, these have sizes of the order of the half-channel, therefore the DNS can be affected by the box size. Two simulations have been performed, one in a box
 $L_{1}=6\unicode[STIX]{x03C0},L_{3}=2\unicode[STIX]{x03C0}$
and the other, with the same resolution, in a box
 $L_{1}=8\unicode[STIX]{x03C0},l_{3}=3\unicode[STIX]{x03C0}$
producing equal profiles of the statistics. The shear parameter
 $S^{\ast }$
is one of the statistics linked to the flow structures, in fact if
 $S^{\ast }$
is greater than a threshold value, approximately
 $5$
, very elongated anisotropic longitudinal structures form. It has been observed that for
 $y^{+}<20$
 $S^{\ast }$
is high and in the outer layer is small, consequently the flow structures near the wall are more intense than those in the outer region. The profiles of
 $q^{2+}$
in figure 1(a) and of
 $\unicode[STIX]{x1D716}^{+}$
in figure 1(b) show a large
 $Re$
dependence in the wall region, that has been emphasised by plotting the quantities only in the viscous and buffer layers. These two figures show that large variations appear at intermediate
 $Re$
and that both quantities tend to a limit at high
 $Re$
. Still, it has not been established whether a saturation or a logarithmic growth of the maximum of
 $q^{2+}$
occurs for
 $Re\rightarrow \infty$
. However, figure 1(a) seems to infer a saturation. The value of the maximum of
 $q^{2+}$
at
 $R_{\unicode[STIX]{x1D70F}}=8000$
is twice the value reached at the transitional Reynolds number. At this
 $Re$
there is no separation between outer and near-wall structures. The peak is located almost at the same distance, in wall units, as that at a
 $Re$
number hundred times greater.
Profiles in wall units of (a) turbulent kinetic energy, (b) rate of dissipation, (c) eddy turnover time evaluated with
 $\unicode[STIX]{x1D716}$
(solid line
 $2x^{2}$
dashed
 $10x$
), (d) shear parameter, (e,f) eddy turnover time evaluated with
 $D_{k}$
(solid line
 $15x$
dashed
 $5x$
), for channel flows past smooth walls; the data are from the references given in the text. The Reynolds numbers are in the legend of panel (a); in panels (b–f) the profiles at
 $R_{\unicode[STIX]{x1D70F}}=8000$
could not be evaluated from the Yamamoto & Tsuji (Reference Yamamoto and Tsuji2018) data as evinced by the legend in panel (e).

The rate of isotropic energy dissipation
 $\unicode[STIX]{x1D716}^{+}$
in figure 1(b) shows a large Reynolds number dependence for
 $y^{+}<10$
. As discussed later on, for
 $y^{+}<10$
, the full rate of energy dissipation
 $D_{k}=(1/Re)\langle u_{i}\unicode[STIX]{x1D6FB}^{2}u_{i}\rangle$
, in wall units, shows a reduced dependence with the Reynolds number. Since
 $D_{k}=(1/Re)(\text{d}^{2}\langle q^{2}/2\rangle /\text{d}x_{2}^{2})-\unicode[STIX]{x1D716}$
it can be inferred that the Reynolds dependence of
 $\unicode[STIX]{x1D716}^{+}$
, for
 $y^{+}<20$
, is due to the viscous diffusion of
 $q^{2+}$
. The Reynolds dependence for
 $y^{+}<10$
, at high
 $Re$
, in the outer region disappears by looking at the profiles of the eddy turnover time, in wall units, in figure 1(c). In the region
 $y^{+}<8$
the eddy turnover time is proportional to
 $y^{2+}$
, instead, in the outer region, it is proportional to
 $y^{+}$
. Figure 1(c) shows a deviation from the linear behaviour that is higher the smaller
 $Re$
is. In order to appreciate better the variations in the region of transition, in the inset some of the profiles are plotted in linear scale. The eddy turnover time based on
 $D_{k}^{+}$
(figure 1
e) instead of on
 $\unicode[STIX]{x1D716}^{+}$
shows a linear increase with
 $y^{+}$
also near the wall. Therefore it can be stressed that this dimensionless eddy turnover time depicts a universal behaviour for the inner and outer structures. These have the same characteristics, being generated by the strain,
 $S$
, and are fast near the wall and slow in the outer region. The transition between the two similar structures occurs in the region with a high growth of turbulent kinetic energy production. To demonstrate the collapse of
 $(q^{2}/D_{k})^{+}$
, in the viscous region (
 $y^{+}<5$
), and the tendency towards saturation in the buffer region, linear scales have been used in figure 1(f) and the data at
 $R_{\unicode[STIX]{x1D70F}}=78$
were not plotted. At
 $Re$
numbers close to the transitional value (
 $R_{\unicode[STIX]{x1D70F}}\approx 80$
) the two kinds of structure, the inner and outer structures, coincide, and the flow physics is more complex. In the transitional regime the motion of these large structures plays a large role in mixing processes or in heat transfer. From the data in figure 2 in Orlandi et al. (Reference Orlandi, Bernardini and Pirozzoli2015) it has been evaluated that for
 $70<R_{\unicode[STIX]{x1D70F}}<200$
,
 $K/(hU_{b}^{2})$
(
 $K=\int q^{2}\,\text{d}y$
and
 $U_{b}$
the bulk velocity) decays with
 $R_{\unicode[STIX]{x1D70F}}^{1/3}$
and that for
 $500<R_{\unicode[STIX]{x1D70F}}<5200$
it decays with
 $R_{\unicode[STIX]{x1D70F}}^{1/6}$
. Therefore it can be inferred that the effects of Reynolds number are high when the wall and the outer structures of the same size are strongly interconnected. When the wall structures are much smaller and far apart from the outer ones the effect of the Reynolds number is reduced. The profiles of
 $S^{+}$
for
 $y^{+}<200$
are not given, being superimposed on each other. Therefore the Reynolds independence of the shear parameter
 $S^{\ast }$
in figure 1(d) is due to the universality of the eddy turnover time for
 $y^{+}<20$
. From these observations it can be asserted that, for wall-bounded turbulent flows past smooth walls, the well-defined boundary conditions lead to mean shear
 $S^{+}$
profiles independent of the Reynolds number for
 $y^{+}<200$
. The similarity of the large scales of the mean motion promotes the universality of the eddy turnover time of turbulent flows in the range of
 $y^{+}$
in which the energy containing scales (figure 1
a) and their rate of isotropic dissipation (figure 1
b) are Reynolds number dependent.
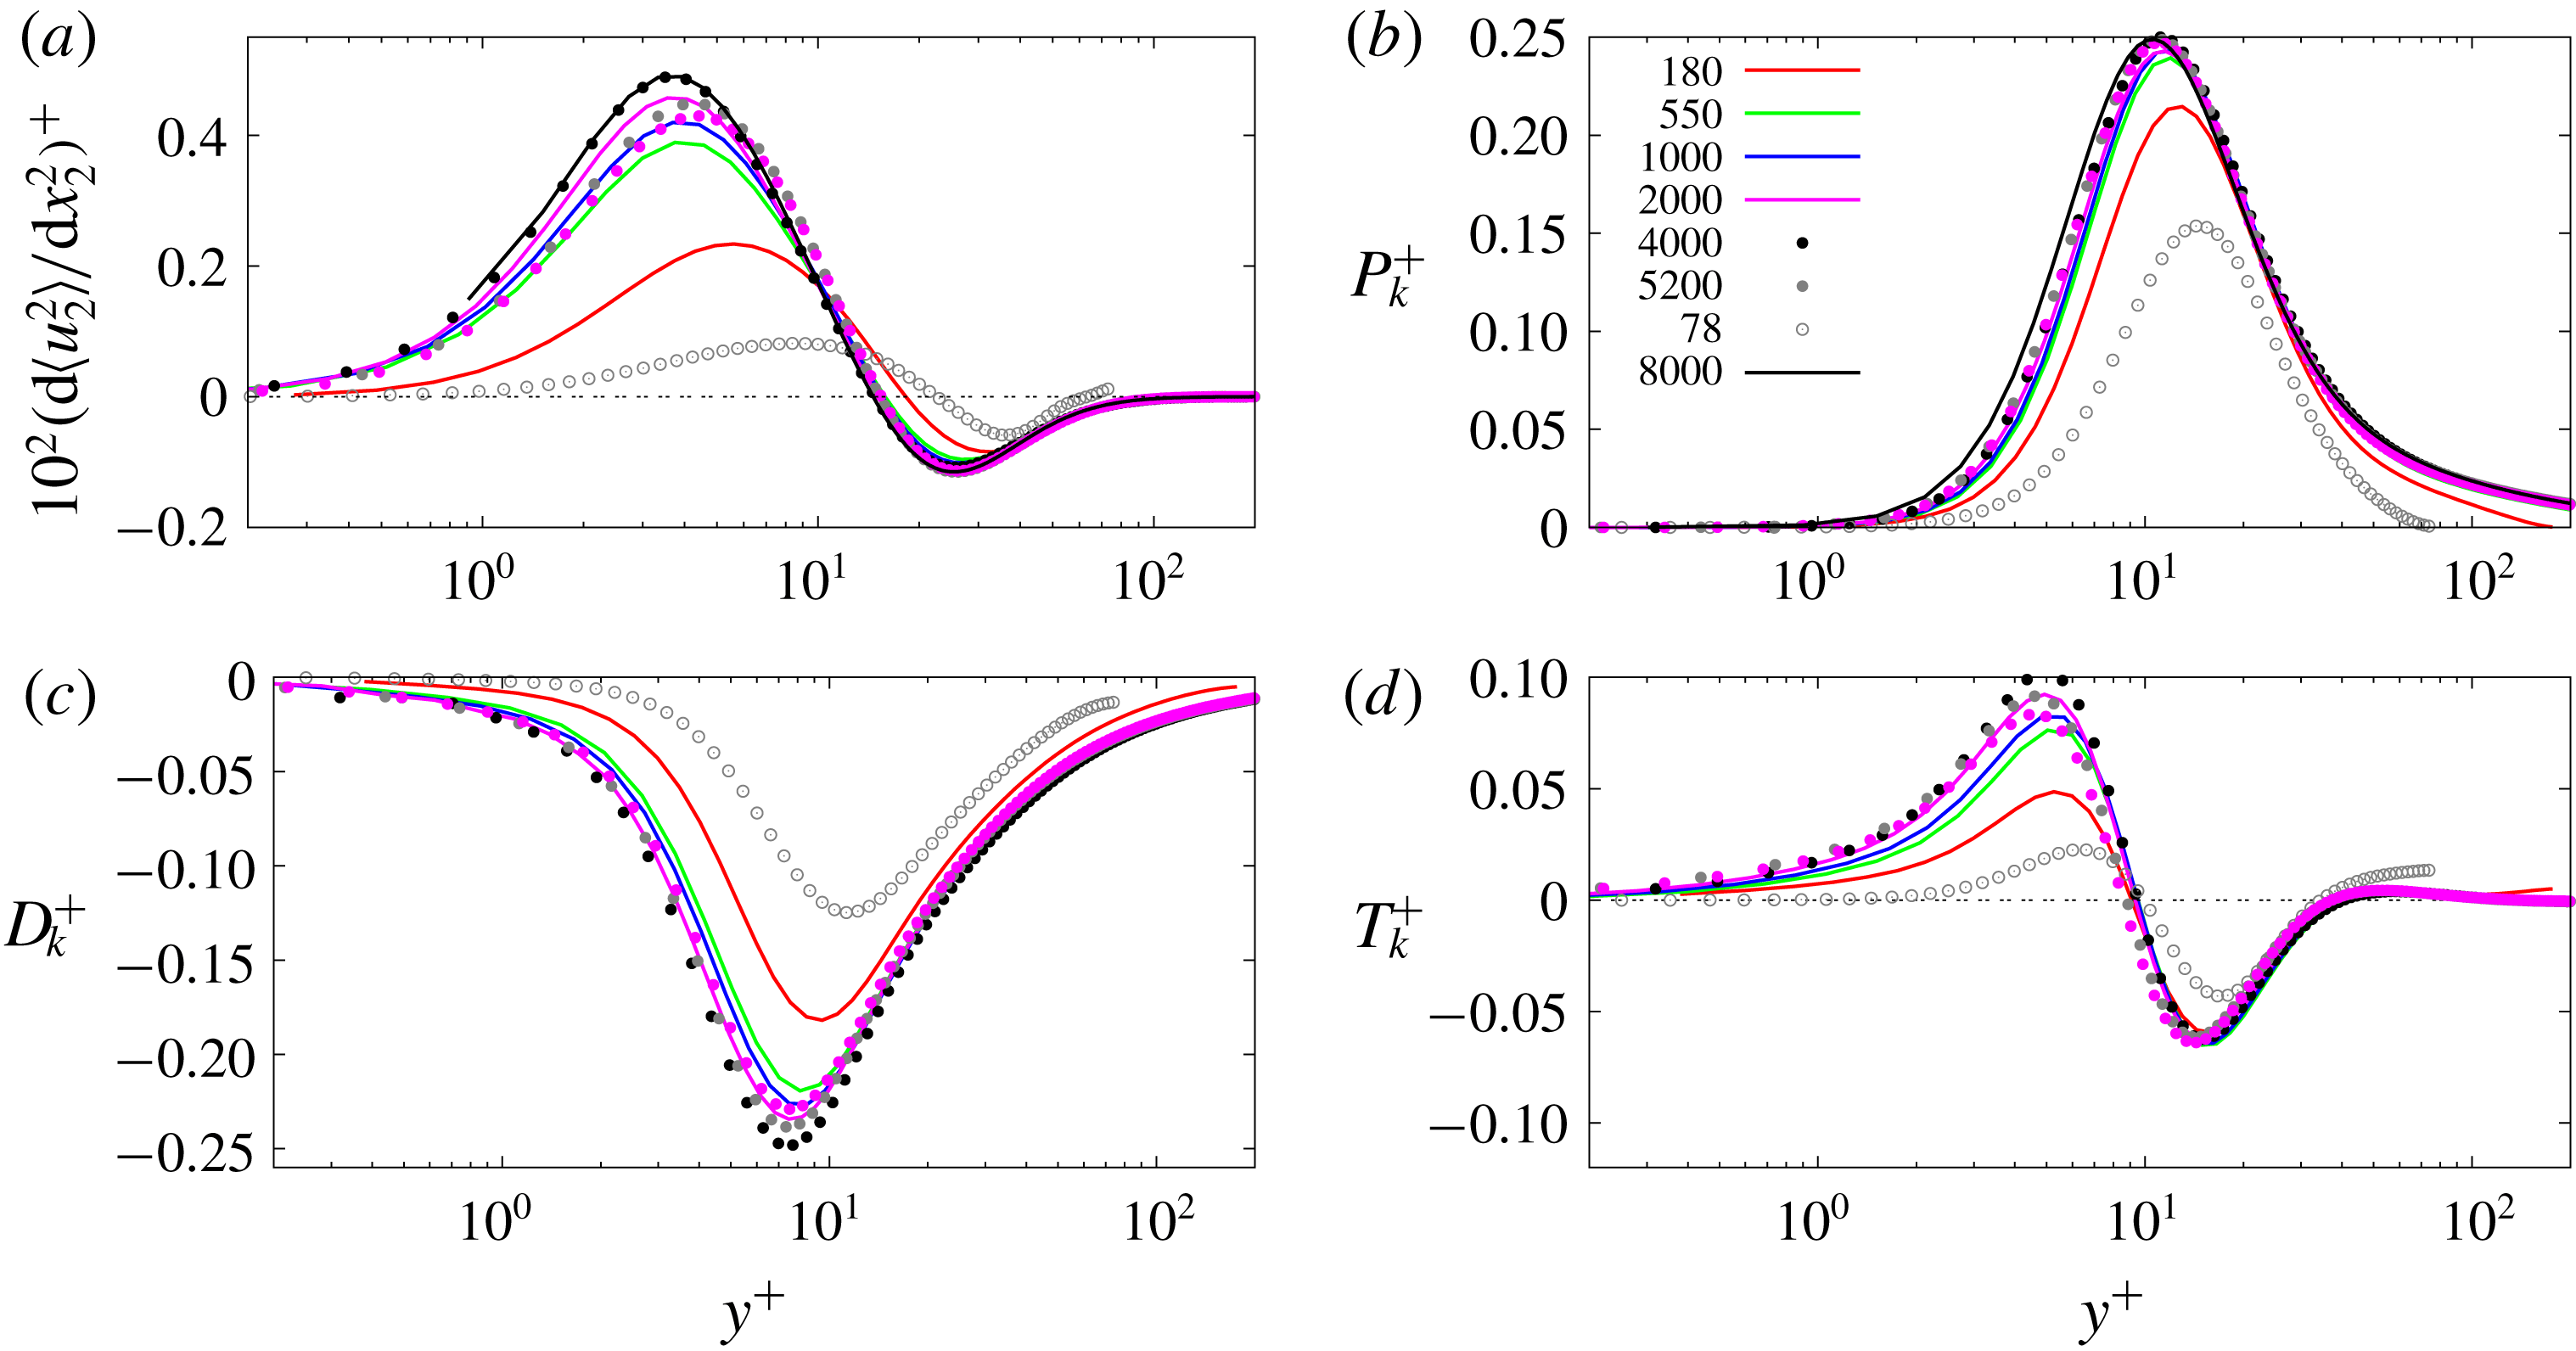
Profiles in wall units of: (a)
 $\text{d}^{2}\langle u_{2}^{2}\rangle /\text{d}x_{2}^{2}$
, (b) turbulent kinetic energy production, (c) full rate of dissipation, (d) turbulent diffusion by nonlinear terms; the data are from the references given in the text. The Reynolds numbers are in the legend of panel (b); in (c,d) the profiles at
 $R_{\unicode[STIX]{x1D70F}}=8000$
could not be evaluated from the Yamamoto & Tsuji (Reference Yamamoto and Tsuji2018) data.

To understand in more detail the influence of the Reynolds number on the flow structures in the wall region (viscous and buffer layers) it is worth looking at the profiles of
 $\text{d}^{2}\langle u_{2}^{2}\rangle /\text{d}x_{2}^{2}=-\langle Q\rangle$
. As previously mentioned, this quantity is null in homogeneous turbulent flows. For
 $-\langle Q\rangle >0$
, sheet-like structures prevail over tubular like structures and figure 2(a) shows that this occurs for
 $y^{+}<12$
. In this layer, the sheets produce and dissipate turbulent kinetic energy. The profiles in wall units of
 $(\text{d}^{2}\langle u_{2}^{2}\rangle /\text{d}x_{2}^{2})^{+}$
(figure 2
a),
 $P_{k}^{+}$
(figure 2
b) and
 $D_{k}^{+}$
(figure 2
c) show a similar dependence upon the Reynolds number. Namely large variations for
 $70<R_{\unicode[STIX]{x1D70F}}<200$
and small for
 $500<R_{\unicode[STIX]{x1D70F}}<5200$
. In figure 2(c) the data by Yamamoto & Tsuji (Reference Yamamoto and Tsuji2018) at
 $R_{\unicode[STIX]{x1D70F}}=8000$
are not reported, since the budgets were not accessible. Figure 2(a) for
 $500<R_{\unicode[STIX]{x1D70F}}<5200$
depicts a good scaling for the sheet-like structures near the wall and even better for the tubular structures in the buffer region. It can also been observed that the trend with
 $Re$
is not regular, in fact the peak at
 $R_{\unicode[STIX]{x1D70F}}=5200$
(Lee & Moser Reference Lee and Moser2015) is smaller than that at
 $R_{\unicode[STIX]{x1D70F}}=4000$
(Bernardini et al.
Reference Bernardini, Pirozzoli and Orland2014) and that at
 $R_{\unicode[STIX]{x1D70F}}=8000$
(Yamamoto & Tsuji Reference Yamamoto and Tsuji2018). The profiles for
 $70<R_{\unicode[STIX]{x1D70F}}<200$
of
 $-\langle Q\rangle$
largely depend on the Reynolds number with the magnitude decreasing with
 $Re$
in both regions. By reducing the Reynolds number the zero crossing point moves far from the wall. Figure 2(b) shows that the maximum energy production is located, at low and high Reynolds numbers, near the crossing point and it is slightly shifted in the region where the sheet-like structures prevail. In this location it may be inferred that the unstable ribbon-like structures tend to roll-up to become rod-like structures. When the Reynolds number increases the saturation of the maximum of
 $P_{k}^{+}$
, and for all of the profiles up to
 $y^{+}\approx 200$
, is evident, corroborating the saturation of the maximum of the turbulent kinetic energy in figure 1(a).
The total rate of dissipation in figure 1(c) behaves similarly to the production, with the maximum located in the region dominated by ribbon-like structures, therefore during the roll-up of the unstable structures the maxima of production and dissipation occur. Lee & Moser (Reference Lee and Moser2018) discussed in detail the interaction between near-wall and outer structures by the spectral decomposition of the terms in the Reynolds stress transport equations. In this way they observed an impact of the large scales on certain statistics in the wall region. Here the interest is to show that for certain quantities that should be modelled in the RANS closures, the influence of the outer structures is negligible. The scaling of
 $D_{k}^{+}$
in figure 2(c), at high
 $Re$
, is rather good but not as good as that of
 $P_{k}^{+}$
in figure 2(b). This occurrence can be explained by considering that the production is directly linked to the mean shear, having a perfect scaling with the Reynolds number. Since
 $P_{k}^{+}$
is balanced by
 $D_{k}^{+}$
and
 $T_{k}^{+}$
(turbulent kinetic energy diffusion
 $T_{k}=-((1/2)(\text{d}\langle u_{2}u_{i}^{2}\rangle /\text{d}x_{2})+\langle u_{i}(\unicode[STIX]{x2202}p/\unicode[STIX]{x2202}x_{i})\rangle )$
) and that the latter is smaller than
 $P_{k}^{+}$
and
 $D_{k}^{+}$
, the
 $Re$
dependence in
 $D_{k}^{+}$
should appear in the profiles of
 $T_{k}^{+}$
. Indeed the profiles of the turbulent diffusion, in figure 2(d), evaluated by including the small contribution of the pressure transport term, show a deterioration of the wall scaling in the sheet-dominated layer. The transfer of energy from the region dominated by the tubular structures into the region dominated by the sheets depends on the Reynolds number and this dependence should be expected because of the influence of the viscosity on the roll-up of the ribbon-like structures. In figure 2(d) the perfect collapse of
 $T_{k}^{+}<0$
, for the flows at
 $180<R_{\unicode[STIX]{x1D70F}}$
, suggests that the universal rod-like structures loose the same amount of energy independently of the value of
 $R_{\unicode[STIX]{x1D70F}}$
. The profiles in figure 2(b–d) could be of interest to those interested in building low Reynolds number RANS closures at high Reynolds number. In fact the model of the rate of full dissipation should be easier since
 $D_{K}$
, from zero at the wall, grows proportionally to
 $q^{2}$
in the viscous layer.
Profiles in wall units of the stress aligned with (a)
 $S_{\unicode[STIX]{x1D6FC}}$
, (b)
 $S_{\unicode[STIX]{x1D6FE}}$
; of the turbulent kinetic energy aligned with (c)
 $S_{\unicode[STIX]{x1D6FC}}$
, (d)
 $S_{\unicode[STIX]{x1D6FE}}$
, the data are from the references given in the text. The Reynolds number are in the legend of panel (a).

To get a different view of the contribution of the structures to the turbulent kinetic energy production it is worth looking at the distribution of the normal stresses aligned with the eigenvectors of the strain tensor
 $\unicode[STIX]{x1D61A}_{ij}$
. The reason, as previously mentioned, is that the good scaling of the production with the Reynolds number is due to its proportionality with the mean shear
 $Si=S_{12}$
. Therefore the statistics aligned with the eigenvectors of
 $\unicode[STIX]{x1D61A}_{ij}$
should be linked to flow structures, different from those visualised in the Cartesian reference frame. The new reference frame is aligned with a negative compressive
 $S_{\unicode[STIX]{x1D6FE}}$
and a positive extensional
 $S_{\unicode[STIX]{x1D6FC}}$
strain. In the Cartesian frame the near-wall inhomogeneity is manifested by large differences in the profiles of the normal stresses
 $R_{ii}=\langle u_{i}u_{i}\rangle$
with
 $R_{22}<R_{33}\ll R_{11}$
. Flow visualisations in planes
 $x_{1}-x_{3}$
parallel to the wall, show very elongated structures for
 $u_{1}$
, while the other two fluctuating velocity components are concentrated in patches of elliptical or circular shape. The contours of
 $u_{2}$
in several locations depict the presence of an intense negative patch surrounded by two positive patches of elliptical shape. In correspondence with the strong
 $u_{2}<0$
(sweeps events) the positive elongated streamwise structures form (Orlandi, Sassun & Leonardi Reference Orlandi, Sassun and Leonardi2016). Several papers have been addressed at investigating this cycle of events, for instance that by Jiménez & Pinelli (Reference Jiménez and Pinelli1999). The
 $u_{1}$
and
 $u_{2}$
are the fluctuations producing the active motion in turbulent flows since their combination interacts directly with the mean shear
 $S$
to produce new fluctuations. The fluctuations
 $u_{3}$
in the spanwise direction can be considered as an inactive motion, and these are concentrated in positive and negative patches. The structures therefore are not as well defined as those of the other two velocity components. These structures can be considered inactive also because the profiles of the relative stress
 $R_{33}$
coincide with
 $R_{\unicode[STIX]{x1D6FD}\unicode[STIX]{x1D6FD}}$
aligned with
 $S_{\unicode[STIX]{x1D6FD}}=0$
. The vertical profiles of
 $R_{\unicode[STIX]{x1D6FD}\unicode[STIX]{x1D6FD}}^{+}$
are not reported, on the other hand figure 3(a,b) shows that
 $R_{\unicode[STIX]{x1D6FC}\unicode[STIX]{x1D6FC}}^{+}$
and
 $R_{\unicode[STIX]{x1D6FE}\unicode[STIX]{x1D6FE}}^{+}$
do not differ in shape, and that those aligned with
 $S_{\unicode[STIX]{x1D6FE}}$
are greater than those aligned with
 $S_{\unicode[STIX]{x1D6FC}}$
. In each component a strong Reynolds dependence, similar to that depicted in figure 1(a) for
 $q^{2+}$
, emerges. The similarity of the profiles of
 $R_{\unicode[STIX]{x1D6FC}\unicode[STIX]{x1D6FC}}^{+}$
and of
 $R_{\unicode[STIX]{x1D6FE}\unicode[STIX]{x1D6FE}}^{+}$
suggests that the contours of
 $u_{\unicode[STIX]{x1D6FC}}u_{\unicode[STIX]{x1D6FC}}$
and
 $u_{\unicode[STIX]{x1D6FE}}u_{\unicode[STIX]{x1D6FE}}$
in a plane
 $x_{1}-x_{3}$
parallel to the wall should be similar, implying that the structures aligned with
 $S_{\unicode[STIX]{x1D6FC}}$
and
 $S_{\unicode[STIX]{x1D6FE}}$
do not largely differ. This is shown later on discussing the differences between flows past smooth and flows past corrugated walls. To investigate which of the two kinds of structures plays a large role in the near-wall turbulent kinetic production it is worth decomposing the production
 $P_{k}$
. In this local frame
 $P_{k}=-(P_{\unicode[STIX]{x1D6FC}}+P_{\unicode[STIX]{x1D6FE}})$
with
 $P_{\unicode[STIX]{x1D6FC}}=R_{\unicode[STIX]{x1D6FC}\unicode[STIX]{x1D6FC}}S_{\unicode[STIX]{x1D6FC}}$
and
 $P_{\unicode[STIX]{x1D6FE}}=R_{\unicode[STIX]{x1D6FE}\unicode[STIX]{x1D6FE}}S_{\unicode[STIX]{x1D6FE}}$
. The two terms are greater than
 $P_{k}$
and their profiles in figure 3(c) and in figure 3(d) show that the compressive strain generates more kinetic energy than that eliminated by the extensional one. In both terms there is a Reynolds dependence at high and low
 $Re$
numbers, while the sum of the two in figure 2(b) shows that it is almost absent at high
 $Re$
. It can be, therefore, concluded, that the universality of the wall structures is evident only in some of the statistics.
A different way to split
 $P_{k}$
was used by Orlandi (Reference Orlandi2000) at p. 211 to determine the energy transfer from large to small eddies in the near-wall region. The splitting was derived by the Navier–Stokes equation in rotational form where the Lamb vector
 $\unicode[STIX]{x1D740}=-\boldsymbol{u}\times \unicode[STIX]{x1D74E}$
appears. This term is
 $P_{T}=U(\langle u_{3}\unicode[STIX]{x1D714}_{2}\rangle -\langle u_{2}\unicode[STIX]{x1D714}_{3}\rangle )$
, and to get
 $P_{k}$
it should be subtracted from
 $P_{C}=\text{d}U\langle u_{1}u_{2}\rangle /\text{d}x_{2}$
, related to the action of the large eddies advecting the turbulence across the channel. The profiles of the vorticity velocity correlations were not directly evaluated in the simulations here used. However the identity
 $\langle u_{3}\unicode[STIX]{x1D714}_{2}\rangle -\langle u_{2}\unicode[STIX]{x1D714}_{3}\rangle =\text{d}\langle u_{2}u_{1}\rangle /\text{d}x_{2}$
allows us to evaluate
 $P_{T}$
. The two terms plotted in figure 4 are characterised by a universal behaviour for
 $y^{+}<100$
and for
 $500<R_{\unicode[STIX]{x1D70F}}<8000$
. The detailed analysis of the two terms gives insight into what occurs in the whole channel. The expression for
 $P_{C}$
demonstrates that what is produced near the wall is transferred to the outer region. In fact
 $P_{C}^{+}$
is negative in the outer region and in magnitude higher for smaller
 $Re$
; with
 $P_{C}^{+}$
smaller than
 $P_{T}^{+}$
it follows that
 $P_{k}^{+}>0$
. Tsinober (Reference Tsinober2009) at p. 120 analysed the physical aspects of the kinematic relationship previously mentioned, by asserting ‘the component of the Lamb vectors imply a statistical dependence by large scales (
 $\boldsymbol{u}$
) and small scales (
 $\unicode[STIX]{x1D74E}$
). Without this dependence the mean flow does not fill the turbulent part’. Indeed figure 4(a) shows that, for
 $100<y^{+}$
,
 $P_{T}^{+}$
is negligible at high
 $R_{\unicode[STIX]{x1D70F}}$
, however, the large contribution of
 $P_{T}^{+}$
implies the transfer of energy from large to small scale, which is redistributed by
 $P_{C}^{+}$
. The budget in Lee & Moser (Reference Lee and Moser2015) at
 $R_{\unicode[STIX]{x1D70F}}=5200$
, in the outer region, shown in the inset of figure 4(a) depicts the large contributions of the
 $P_{T}^{+}$
and
 $P_{C}^{+}$
terms with respect to the turbulent diffusion and to the full dissipation discussed respectively in figure 2(c) and in figure 2(d). Tsinober (Reference Tsinober2009) wrote ‘It is noteworthy that both correlation coefficients
 $C_{u_{3}\unicode[STIX]{x1D714}_{2}}=\langle u_{3}\unicode[STIX]{x1D714}_{2}\rangle /\langle u_{3}^{2}\rangle ^{1/2}\langle \unicode[STIX]{x1D714}_{2}^{2}\rangle ^{1/2}$
and
 $C_{u_{2}\unicode[STIX]{x1D714}_{3}}=\langle u_{2}\unicode[STIX]{x1D714}_{3}\rangle /\langle u_{2}^{2}\rangle ^{1/2}\langle \unicode[STIX]{x1D714}_{3}^{2}\rangle ^{1/2}$
(and many other statistical characteristics, e.g. some, but not all, measures of anisotropy) are of order
 $10^{-2}$
even at rather small Reynolds numbers. Nevertheless, as we have seen, in view of the dynamical importance of interaction between velocity and vorticity in turbulent shear flows such small correlations by no means imply absence of a dynamically important statistical dependence and a direct interaction between large and small scales’. This is indeed true in the outer region (
 $0.2<y<0.5$
) where
 $S$
is rather small, however large enough to give a
 $S^{\ast }\approx 8$
sufficient to create large elongated structures in the outer region. Near the wall the two velocity vorticity correlations are quite large, producing large negative values of
 $P_{T}^{+}$
.
Profiles in wall units of (a)
 $P_{T}$
; in the inset are plotted the terms
 $R_{\unicode[STIX]{x1D70F}}=5200$
, red
 $P_{k}$
, green
 $P_{T}$
, purple
 $P_{C}$
, black
 $D_{k}$
and blue
 $T_{k}$
; (b)
 $P_{C}$
as defined in the text. The data are from the references given in the text. The Reynolds numbers are in the legend for panel (b).

An easy way to change the velocity fluctuations at the boundary consists of the modification of the shape of the surface with the result of producing large differences among the statistics profiles in the near-wall region. Therefore there is a large probability that the universality with the Reynolds number, described in this section, is not any longer valid. In the next section the behaviours of the quantities, here considered, are discussed for flows past surfaces leading to an increase or to a reduction of the drag with respect to that in the presence of smooth walls. Having several realisations, the joint probability density function (p.d.f.) between the velocity components generating the turbulent stress together with flow visualisations allow us to understand in more detail the differences between smooth and rough walls.
2.2 Rough walls
2.2.1 Numerical procedure and validation
The numerical methodology was described in several previous papers, in particular Orlandi & Leonardi (Reference Orlandi and Leonardi2006), however it is worth briefly summarising the main features of the method, and recalling the validation based on the comparisons between the numerical results and the laboratory data available in the literature.
The non-dimensional Navier–Stokes and continuity equations for incompressible flows are
 $$\begin{eqnarray}\frac{\unicode[STIX]{x2202}u_{i}}{\unicode[STIX]{x2202}t}+\frac{\unicode[STIX]{x2202}u_{i}u_{j}}{\unicode[STIX]{x2202}x_{j}}=-\frac{\unicode[STIX]{x2202}p}{\unicode[STIX]{x2202}x_{i}}+\frac{1}{Re}\frac{\unicode[STIX]{x2202}^{2}u_{i}}{\unicode[STIX]{x2202}x_{j}^{2}}+\unicode[STIX]{x1D6F1}\unicode[STIX]{x1D6FF}_{1i},\quad \frac{\unicode[STIX]{x2202}u_{j}}{\unicode[STIX]{x2202}x_{j}}=0,\end{eqnarray}$$
where
 $\unicode[STIX]{x1D6F1}$
is the pressure gradient required to maintain a constant flow rate,
 $u_{i}$
is the component of the velocity vector in the
 $i$
direction and
 $p$
is the pressure. The reference velocity is the centreline laminar Poiseuille velocity profile
 $U_{P}$
, and the reference length is the half-channel height
 $h$
in the presence of smooth walls. The Navier–Stokes equations have been discretised in an orthogonal coordinate system through a staggered central second-order finite-difference approximation. The discretisation scheme of the equations is reported in chap. 9 of Orlandi (Reference Orlandi2000). To treat complex boundaries, Orlandi & Leonardi (Reference Orlandi and Leonardi2006) developed an immersed boundary technique, whereby the mean pressure gradient to maintain a constant flow rate in channels with rough surfaces of any shape is enforced. In the presence of rough walls, after the discrete integration of
 $RHS_{i}$
(right-hand side in the
 $i$
directions) in the whole computational domain, a correction is necessary to account for the variations of the metrics near the body. This procedure, requires a number of operations proportional to the number of boundary points, and the flow rate remains constant within round-off errors. In principle, there is no big difference in treating two- or three-dimensional geometries. However, in the latter case, a greater memory occupancy is necessary to define the nearest points to the wall surface.
In the present paper several types of corrugations have been considered in a computational domain with size
 $L_{1}=8$
in the streamwise and
 $L_{3}=2\unicode[STIX]{x03C0}$
in the spanwise direction. Differently than in previous simulations, where one wall was corrugated and the other was smooth, here both walls have the same corrugation. This set-up has the advantage of enabling investigating as to whether, at the steady state, a symmetrical solution is achieved. This condition should require a large number of realisations collected by simulations requiring a great CPU time. As for the flows past smooth walls, considered in the previous section, the symmetric boundaries, for flow past rough walls, require a reduced number of realisations to get converged statistics.
The validation of the immersed boundary technique was presented in Orlandi, Leonardi & Antonia (Reference Orlandi, Leonardi and Antonia2006) by a comparison of the pressure distribution on the rod-shaped elements with the measurements by Furuya, Miyata & Fujita (Reference Furuya, Miyata and Fujita1976). These authors studied the boundary layer over circular rods, fixed to the wall and transverse to the flow, for several values of
 $w/k$
(
 $w$
is the streamwise separation between two consecutive rods of height
 $k$
). The numerical validation was performed for values of
 $w/k=3,7$
and
 $15$
. It is important to point out that circular rods are appropriate for numerical validation of the immersed boundary method, owing to the variation of the metric along the circle. The numerical simulations were performed at
 $Re=U_{P}h/\unicode[STIX]{x1D708}=4200$
, and the pressure distributions around the circular rod were compared with those measured. The good agreement reported in Orlandi et al. (Reference Orlandi, Leonardi and Antonia2006) implies that the numerical method is accurate and can be used to reproduce the flow past any type of surface. From the physical point of view, the agreement between low
 $Re$
simulations and high
 $Re$
experiments (Furuya et al.
Reference Furuya, Miyata and Fujita1976) implies a similarity between the near-wall region of boundary layers and channel flows. In addition it can be asserted that, as in fully rough flows, (Nikuradse Reference Nikuradse1950) a Reynolds number independence for the friction factor does exist. The capability of the immersed boundary technique to treat rough surfaces was further demonstrated by a comparison with the experimental results of Burattini et al. (Reference Burattini, Leonardi, Orlandi and Antonia2008) for a flow past transverse square bars with
 $w/k=3$
.
2.2.2 Global results
Several corrugations of height
 $k=0.2$
have been located below the plane of the crest at
 $x_{2}\pm 1$
that coincides with the walls of channels with smooth walls (
 $SM$
). The shapes of the corrugation are given in figure 5 by plotting the contours of the
 $u_{2}$
velocity component in the planes most appropriate to see the walls of the corrugations. These images demonstrate that the immersed boundary technique accurately reproduces the flow around the corrugations. The normal to the wall velocity coincides with the fluctuating component
 $u_{2}$
being, for each realisation, its average in the homogeneous directions equal to zero. In several previous papers the importance of the
 $u_{2}$
fluctuations and the relative statistics was stressed. The relevant papers are reported in Orlandi (Reference Orlandi2013). For the smooth channel the
 $u_{2}$
contours, in a small region, in figure 5(a) depict the sweep and the ejection events one after the other. These are the events contributing to an increase in the drag of turbulent flows with respect to that of laminar flows, producing turbulent kinetic energy. The recirculating motion in figure 5(b) within the cavities of the transverse square bar configuration (
 $TS$
), for this spanwise section, connects the negative regions of
 $u_{2}$
inside with those of the same sign above. However, in a different spanwise section, a connection between positive values has been observed. The global results leads to a value of
 $\langle u_{2}^{2}\rangle _{W}$
, at the plane of the crests, different from zero. In the whole paper the subscript
 $W$
indicates quantities evaluated at the plane of the crests at
 $x_{2}\pm 1$
.
Contour plots of
 $u_{2}$
: (a)
 $SM$
, (b)
 $TS$
, (c)
 $TT$
in planes in
 $x_{1}{-}x_{2}$
, (d)
 $CS$
plane
 $x_{1}{-}x_{3}$
at
 $x_{2}=-1.03$
, (e)
 $LLS$
, (f)
 $LS$
, (g)
 $LT$
, (h)
 $LTS$
, planes in
 $x_{3}-x_{2}$
. Blue and green negative, red and magenta positive,
 $\unicode[STIX]{x1D6E5}=0.005$
for red and blue
 $\unicode[STIX]{x1D6E5}=0.0005$
for green and magenta.

Triangular transverse bars, one attached to the other (
 $TT$
), generate a more intense recirculating motion (figure 5
c), producing large effects on the overlying turbulent flows. A spanwise coherence of the recirculating motion inside the corrugations is observed, that disappears at a distance
 $y=0.2$
from the plane of the crests. The capability of the numerical method to describe the complex flow inside the three-dimensional staggered cubes (
 $CS$
) can be appreciated by the contours of
 $u_{2}$
in figure 5(d) in a
 $x_{1}{-}x_{3}$
plane at
 $x_{2}=-1.03$
. The velocity disturbances ejected from three-dimensional corrugations are large, and, therefore, large effects on the overlying turbulent flow are produced. The motion inside the longitudinal corrugation can be visualised by
 $u_{2}$
contours in
 $x_{3}{-}x_{2}$
planes; in these circumstances the motion is rather weak, therefore contours with
 $\unicode[STIX]{x1D6E5}=0.0005$
are depicted in figure 5(e–h) in green for negative and in magenta for positive
 $u_{2}$
. These images confirm that the immersed boundary technique reproduces the complexity of the secondary motion, namely for the corrugation
 $LLS$
(figure 5
e) with
 $w/k=3$
(
 $w$
is the distance between two square bars), and
 $LS$
with
 $w/k=1$
. Triangular bars (
 $LT$
) with
 $s/k=1$
(
 $s$
is the width of the base of the triangle) in figure 5(g) show disturbances similar to those in figure 5(f) for
 $LS$
. On the other hand, for the triangular bars with
 $s/k=0.5$
(
 $LTS$
), the recirculating motion in figure 5(h) is very weak, and, as a consequence, the activity of the overlying flow decreases, leading to a reduction of turbulent kinetic energy and of the drag.
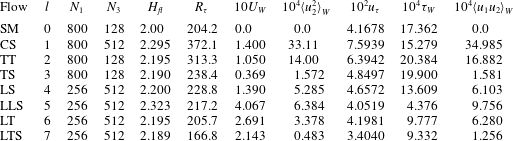
Some of the global results and the resolution for the cases depicted in in figure 5 are reported in the table 1. The resolutions in the streamwise and spanwise directions are different for transverse, longitudinal and three-dimensional corrugations. The resolution in
 $x_{1}$
for transverse corrugations is dictated in order to have
 $20$
grid points to describe the square and triangular cavities. For the longitudinal corrugations
 $16$
grid points are used for the solid bars for the
 $LS$
and
 $LLS$
cases. For all cases
 $20$
grid points are used to describe the layer with thickness
 $k$
below the plane of the crests. This resolution allows us to have a well resolved flow around the corrugation as is shown in figure 5. It is important to point out that in flow past rough surfaces the resistance may be evaluated at the plane of the crests. The contributions to it come from the viscous resistance at the solid walls, at the fluid interface and from the turbulent contribution given by
 $\langle u_{2}u_{1}\rangle$
generated by the velocity fluctuations inside the roughness. The balance of the streamwise momentum equation, inside the cavities below the plane of the crests, shows that
 $\langle u_{2}u_{1}\rangle$
is equal to the viscous and pressure forces along the solid walls of the cavities (Leonardi et al.
Reference Leonardi, Orlandi, Smalley, Djenidi and Antonia2003). The values of
 $U_{W}$
(the mean streamwise velocity at the plane of the crests) in the table shows that values of
 $U_{W}$
for the longitudinal bars are greater than those for the transverse corrugations, implying a decrease of
 $\unicode[STIX]{x1D70F}_{W}=(1/Re)(\text{d}U/\text{d}x_{2})|_{W}$
. Therefore a large drag reduction should be expected due to this slip condition. As has been demonstrated by Arenas et al. (Reference Arenas, García, Orlandi, Fu, Hultmark and Leonardi2018), if at the plane of the crests the
 $u_{2}$
can be, ideally, set equal to zero for any kind of corrugation, a strong drag reduction is achieved. For the surfaces, here considered, the largest reduction should be for the
 $LLS$
configuration. However, in the real flows, the
 $u_{2}$
fluctuations are large, as can be inferred by the values of
 $\langle u_{2}^{2}\rangle _{W}$
in table 1. The
 $u_{2}$
at the plane of the crests generates a turbulent stress
 $\langle u_{2}u_{1}\rangle _{W}$
which can be considered as a ‘form’ drag due to the corrugation of the surfaces, contributing to the total resistance
 $\unicode[STIX]{x1D70F}_{T}=\unicode[STIX]{x1D70F}_{W}-\langle u_{2}u_{1}\rangle _{W}$
. The friction velocities
 $u_{\unicode[STIX]{x1D70F}l}=\sqrt{\unicode[STIX]{x1D70F}_{Tl}R_{Vl}}$
(
 $l$
is an index of the geometry of the surface) show that for the surface
 $LTS$
there is a strong and for
 $LLS$
a negligible drag reduction with respect to that in the presence of smooth walls (
 $SM$
). In this expression
 $R_{Vl}$
is given by the ratio of
 $H_{fl}$
with respect to that of the channel with smooth walls (
 $H$
).
 $H_{fl}$
is the ratio between the volume occupied by the fluid and the area in the homogeneous directions (
 $L_{1}L_{3}$
).
Values of some of the global quantities for the simulations at
 $Re=4900$
, the non-uniform grid
 $x_{2}$
is the same in all cases with
 $N2=257$
points.

2.2.3 Viscous and turbulent stresses
From the global results it follows that the statistics of great interest are the viscous
 $\unicode[STIX]{x1D70F}=(1/Re)(\text{d}U/\text{d}x_{2})$
in figure 6(a) and the turbulent
 $-\langle u_{2}u_{1}\rangle$
in figure 6(b) stresses. The figures are in semi-log form to emphasise the different behaviour in the region near the plane of the crests and therefore to illustrate the difference with the well-known profiles in the presence of smooth walls. Figure 6(a) shows a viscous stress, at the plane of the crests, for transverse grooves (
 $TS$
) higher than that of smooth walls (
 $SM$
). This occurs despite the presence of a
 $\widehat{u_{1}}|_{W}\neq 0$
in the regions of the cavities. The over-script
 $\widehat{\cdot }$
indicates an average in time, in
 $x_{3}$
for the transverse, in
 $x_{1}$
for the longitudinal corrugations of the generic quantity
 $q(x_{1},x_{2},x_{3},t)$
. A further phase average over several elements allows us to have the distribution of
 $\widehat{u_{1}}|_{W}$
along the cavity. The distributions of
 $\widehat{u_{1}}|_{W}$
and of
 $\widehat{u_{1}}$
above the cavities vary with the type of corrugations. In this way it is possible to understand which part of the cavity contributes more to the reduction of
 $(\unicode[STIX]{x2202}\widehat{u_{1}}/\unicode[STIX]{x2202}x_{2})|_{W}$
. Orlandi et al. (Reference Orlandi, Sassun and Leonardi2016), for the
 $TS$
and
 $TT$
surfaces, described in detail the reduction of the viscous stress above the cavity region. However, the increase of viscous stress in correspondence with the solid leads to a value of
 $\unicode[STIX]{x1D70F}$
in figure 6(a) higher than that of
 $SM$
. Similar distribution along each transverse cavity for
 $\widehat{u_{1}u_{2}}|_{W}$
demonstrates why, in figure 6(b), a small value for
 $TS$
and a large value for
 $TT$
are found. The latter is due to the strong ejections flowing along the slopes of the triangular cavities (figure 5
c). For
 $TT$
the profiles of the viscous and the turbulent stress largely differ from those in the presence of smooth walls. These profiles are those typical of ‘
 $k$
’ type roughness. Instead, for the
 $TS$
surface the profiles are those typical of ‘
 $d$
’-type roughness. The turbulent stress profile for the flow past staggered cubes (
 $CS$
) is the largest among all the cases here studied with a maximum four times greater than that of smooth walls. Even in this flow the causes of the increase are the flow ejections from the roughness layer, qualitatively depicted in figure 5(d). The viscous stress profiles of the longitudinal corrugations in figure 6(a) are largely reduced with respect to that of the smooth wall, with the smallest values for
 $LLS$
due to the high
 $\widehat{u_{1}}|_{W}$
generated at the wide interface of the cavity. Figure 5(e) shows a rather high
 $u_{2}$
inside the cavity leading to a turbulent stress three times greater than the viscous stress at the plane of the crests. The final result leads to a friction velocity for
 $LLS$
slightly smaller than that of smooth walls. The other two surfaces
 $LT$
and
 $LS$
, despite the different profiles of the two stresses, lead to similar values of
 $u_{\unicode[STIX]{x1D70F}}$
in table 1. The recirculating motion inside the
 $LS$
cavity (figure 5
f) is similar to that inside the
 $LT$
(figure 5
g), therefore the turbulent stress at the plane of the crest in figure 6(b) is the same. The wider solid surface of
 $LS$
is the reason why
 $\unicode[STIX]{x1D70F}_{W}$
in table 1 is greater than that for
 $LT$
. These two surfaces have almost the same
 $\widehat{u_{1}u_{2}}|_{W}$
therefore the greater
 $u_{\unicode[STIX]{x1D70F}}$
is caused by the differences in
 $\unicode[STIX]{x1D70F}_{W}$
. Thin triangular cavities, such as those in figure 5(h) (
 $LTS$
), give at the plane of the crests the same value of the viscous stress of
 $LT$
, on the other hand the values of turbulent stress, in figure 6(b), are drastically reduced in the whole channel leading to a sensible drag reduction. In fact for
 $LTS$
 $u_{\unicode[STIX]{x1D70F}}$
is
 $18\,\%$
smaller than for
 $SM$
.
Profiles of: (a) viscous stress; (b) turbulent stress versus the distance from the plane of the crests, in computational units; (c) the normal to the wall stress; (d) the mean velocity subtracted from the velocity at the plane of the crests
 $U_{W}$
. In (c,d) the statistics and the distance are in wall units. The flows listed in the legend for (a) corresponds to those in table 1, (lines Lee & Moser (Reference Lee and Moser2015) at
 $R_{\unicode[STIX]{x1D70F}}=180$
).

Our view is that the normal to the wall stress is the fundamental statistic to characterise wall-bounded flows. The values at the plane of the crests are linked to the shape of the surfaces. It should be a difficult task to relate it to the kind of surface, in fact a large number of geometrical parameters enter into the characterisation of a surface. For instance in figure 6(c) the profile of
 $\langle u_{2}^{2}\rangle ^{+}$
of
 $LTS$
do not differ from that of
 $TS$
, the surfaces being completely different. Despite the quantitative differences with the smooth wall it is interesting to notice that, in a thin layer of a few wall units, the growth is similar to that for smooth walls, with the exception of the surfaces with very strong ejections (
 $CS$
and
 $TT$
). Orlandi (Reference Orlandi2013), by investigating the importance of
 $\langle u_{2}^{2}\rangle |_{W}^{+}$
in wall-bounded flows, observed that the roughness function
 $\unicode[STIX]{x0394}U^{+}$
, evaluated by the profiles of
 $U^{+}-U_{W}^{+}$
, is proportional to
 $\langle u_{2}^{2}\rangle |_{W}^{+}$
. This behaviour can be qualitatively appreciated in figure 6(d) where the downward shift of the
 $\log$
law is greater for higher
 $\langle u_{2}^{2}\rangle |_{W}^{+}$
. In figure 6(d) the results by Lee & Moser (Reference Lee and Moser2015) are in perfect agreement with the present one corroborating the accuracy of the present numerics. The differences, in figure 6(c), between the present
 $SM$
and the Lee & Moser (Reference Lee and Moser2015) profiles should be, in part, attributed to the effect of the Reynolds number. In fact, in the previous section, large differences have been observed at low
 $Re$
, here
 $R_{\unicode[STIX]{x1D70F}}=204$
instead in Lee & Moser (Reference Lee and Moser2015)
 $R_{\unicode[STIX]{x1D70F}}=180$
.
Profiles in wall units of: (a) turbulent kinetic energy, (b) rate of isotropic dissipation, (c) eddy turnover time, (d) shear parameter for the flows with rough surfaces listed in the inset in (a), compared with those in the presence of smooth walls (open circle present at
 $R_{\unicode[STIX]{x1D70F}}=204$
, lines Lee & Moser (Reference Lee and Moser2015) at
 $R_{\unicode[STIX]{x1D70F}}=180$
).

2.2.4 Shear parameter
For flows past smooth walls, despite the
 $Re$
variations for
 $y^{+}<30$
of the turbulent kinetic energy and of the rate of energy dissipation in figure 1(c), there was a good scaling of the eddy turnover time. Figure 7(a) shows unexpected behaviour of
 $q^{2+}$
depending on the type of roughness. For instance it is rather difficult to predict the large increase of
 $q^{2+}$
for
 $LLS$
with respect to that for
 $CS$
, the differences between the
 $\langle u_{2}u_{2}\rangle ^{+}$
values in figure 6(c) being rather small. The profiles of each normal stress, which are not reported here, show that the growth of
 $q^{2+}$
is due to the large increase of
 $\langle u_{1}u_{1}\rangle ^{+}$
. The increase of
 $\langle u_{3}u_{3}\rangle ^{+}$
, instead, is moderate. The message of figure 7(a) is that in the region near the plane of the crests the longitudinal grooves generate values of
 $q^{2+}$
greater than those for transverse and three-dimensional corrugations, due to the large streamwise fluctuations inside the longitudinal cavities. In figure 7(b) large variations for
 $y^{+}<20$
of the profiles of the rate of dissipation do not have the same trend as those of
 $q^{2+}$
. The
 $LS$
and the
 $TS$
surfaces have a high rate of dissipation, due to large amount of solid at the plane of the crests, generating high
 $s_{12}^{2+}$
contributing more to
 $\unicode[STIX]{x1D716}^{+}$
than the other fluctuating shears. Only for the
 $LTS$
flow the small fluctuations near the plane of the crests and the small amount of solid give rise to a rate of dissipation smaller than that of the smooth wall. The profile of the eddy turnover time of the
 $TS$
surface, in figure 7(c), is the only one close to that of smooth walls and the difference is mainly due to the
 $\unicode[STIX]{x1D716}^{+}$
in figure 7(b). Interestingly figure 7(c) depicts a completely different behaviour for transverse and longitudinal corrugations. In the latter
 $q^{2+}/\unicode[STIX]{x1D716}^{+}$
remains constant while in the former it decays similarly to the smooth walls. The shear parameter
 $S^{\ast }$
corroborates the similarity between the smooth and the
 $TS$
surfaces, classified as ‘d’-type roughness, with a weak drag increase with respect to
 $SM$
. In both surfaces, as well as for
 $LTS$
with drag reduction, the maximum is located approximately at
 $y^{+}=10$
. Flow visualisations for
 $LTS$
depict the formation of streaky structures similar to those of the smooth channel. For the other longitudinal corrugations the maximum of
 $S^{\ast }$
, near the plane of the crests, depends on the type of surface, indicating that the shape of the surface dictates the structures formation. The values of
 $S^{\ast }$
suggest for
 $LS$
coherent longitudinal structures, these become more strong and coherent for
 $LLS$
. The low values
 $S^{\ast }$
indicate an isotropisation of the structures, that was investigated by Orlandi & Leonardi (Reference Orlandi and Leonardi2006) through the profiles of the normal stresses. In figure 7(d) the collapse of the
 $S^{\ast }$
profiles in the outer layer, despite the differences near the plane of the crests, may be a further indication of the validity of the Townsend local similarity hypothesis (Townsend Reference Townsend1976). To determine the behaviour of the statistics in the outer region these should be plotted versus the distance from the wall in computational units. Indeed, the same data plotted in this way show a collapse of
 $S^{\ast }$
for
 $y>0.3$
. The tendency to a better evidence of the local similarity hypothesis by increasing the Reynolds number was shown by Orlandi (Reference Orlandi2013), through the profiles of the three normal stresses.
2.2.5 Structural statistics
As for the smooth channel an analysis of the kind of structures near the surfaces can be made by the profiles of
 $(\text{d}^{2}\langle u_{2}^{2}\rangle /\text{d}x_{2}^{2})^{+}$
. It is worth recalling that positive values indicate a layer dominated by sheet-like and negative by rod-like structures. In figure 8 as well as in figure 7(b) differences can be noticed between the present
 $SM$
data and those at
 $R_{\unicode[STIX]{x1D70F}}=180$
in figure 2(a). The reason should be attributed in large measure to the different
 $R_{\unicode[STIX]{x1D70F}}$
and in reduced measure to the coarse grid near the plane of the crests, necessary to have a smooth transition of the resolution on the flow side to that in the roughness layer. The resolution and the Reynolds number affect more the profiles of
 $\langle \unicode[STIX]{x1D714}_{2}^{2}\rangle ^{+}$
in figure 8(b) and of
 $\unicode[STIX]{x1D716}^{+}$
in figure 7(b). Both figures 8(a) and 8(b) show drastic differences between smooth and rough walls near the plane of the crests, that tend to disappear far from the wall. For the longitudinal corrugations, near the plane of the crests, and, in particular, in contact with the solid, tubular-like structures form, as is qualitatively depicted by the
 $u_{2}$
contours in figure 5. Even for the transverse triangular bar (
 $TT$
) as well as for the cubes (
 $CS$
) there is a tendency to the formation of tubular-like structures. For the flow past the
 $TS$
surface the higher positive peak, in figure 8(a), than that for smooth walls (
 $SM$
) implies a large prevalence of the sheet-like structures. This occurrence is also confirmed by a comparison between figure 5(c,d). Only the
 $LLS$
surface shows small variations of
 $-\langle Q\rangle$
, and once more this occurrence is corroborated by the smooth contours in figure 5(e) of
 $u_{2}$
lying in large structures. The intensification of the contours of
 $u_{2}$
near the wedges in figure 5(f,g), relative to the longitudinal corrugations
 $LLS$
and
 $LT$
, explain the negative values of
 $-\langle Q\rangle$
near the plane of the crests in figure 8(a). The locations where
 $-\langle Q\rangle =0$
varies between
 $y^{+}=10$
and
 $y^{+}=18$
are where the maximum of turbulent kinetic energy production is located, as discussed later on.
Profiles in wall units of: (a)
 $\text{d}^{2}\langle u_{2}^{2}\rangle /\text{d}x_{2}^{2}$
for the flows with rough surfaces listed in the legend, compared with those in the presence of smooth walls (open circles for
 $R_{\unicode[STIX]{x1D70F}}=204$
, lines Lee & Moser (Reference Lee and Moser2015) at
 $R_{\unicode[STIX]{x1D70F}}=180$
). (b) Root mean square (r.m.s.) of normal to the wall vorticity component for the flows listed. (a,c) Comparison between the three vorticity components’ r.m.s. for the
 $SM$
(lines) and those for the
 $TT$
(open symbols) flows, (d) the same between
 $SM$
and
 $LLS$
, blue indicates
 $i=3$
, red
 $i=2$
and green
 $i=1$
.

Near smooth walls the elongated structures, the so called near-wall streaks, are usually characterised by regions of negative and positive
 $u_{1}$
. The same picture is obtained by contours of
 $\unicode[STIX]{x1D714}_{2}$
, therefore it is interesting to look at the effects of the shape of the surfaces on the profiles of
 $\langle \unicode[STIX]{x1D714}_{2}^{2}\rangle ^{+}$
. In presence of smooth walls the streaky structures are very intense at the distance where these are generated, accordingly the peak of
 $\langle \unicode[STIX]{x1D714}_{2}^{2}\rangle ^{+}$
is located at
 $y^{+}\approx 15$
. Figure 8(b) shows a different trend, near the plane of the crests, between the longitudinal and the transverse corrugations. For the
 $TT$
and the
 $CS$
surfaces the small and constants values of
 $\langle \unicode[STIX]{x1D714}_{2}^{2}\rangle ^{+}$
suggest a fast tendency to the isotropisation of the small scales moving from the plane of the crests towards the outer region. For the channel with smooth walls Kim, Moin & Moser (Reference Kim, Moin and Moser1987) reported large differences among the profiles of the three vorticity r.m.s. components. This behaviour is reproduced by the present simulation of the flow past smooth walls in figure 8(c), rather different from that obtained in the presence of the
 $TT$
surface. As for the
 $SM$
flow
 $\langle \unicode[STIX]{x1D714}_{3}^{2}\rangle ^{+}$
is the greatest component near the wall, but for the
 $TT$
decays very rapidly and becomes equal to the other two at a distance
 $y^{+}=10$
from the plane of the crests. At
 $y^{+}=50$
figure 8(c) depicts a rather good isotropisation of the small scales for both surfaces. On the other hand, for the longitudinal grooves the anisotropy of the structures may be recognised by the growth of
 $\langle \unicode[STIX]{x1D714}_{2}^{2}\rangle ^{+}$
moving towards the plane of the crests in figure 8(b). The strong planar motion at the top of the cavities, in particular for the
 $LS$
and
 $LT$
surfaces, causes this growth. This motion is due to the large
 $u_{2}$
fluctuations generated inside the longitudinal cavities depicted in figure 5(f,g). The large increase of the small scale anisotropy near the plane of the crests is shown in figure 8(d) by comparing the vorticity r.m.s. profiles for the
 $LLS$
surface with those for the
 $SM$
. In this surface an intense
 $\unicode[STIX]{x1D714}_{2}$
is generated at the edge of the longitudinal square bars and the planar motion mentioned above leads to a high
 $\langle \unicode[STIX]{x1D714}_{2}^{2}\rangle ^{+}$
at the plane of the crests. The other two components do not largely differ from those of
 $SM$
near the plane of the crests. These do not show any increase moving far from the wall, as with that for
 $SM$
, at
 $y^{+}\approx 12$
, the location of maximum
 $q^{2}$
production. Despite the different trend near the plane of the crests a good isotropy of the small scales is achieved at
 $y^{+}\approx 40$
. For the drag reducing surface (
 $LTS$
) these fluctuations reduce in the region near the plane of the crests (figure 5
h), therefore the strength of small and large scales reduce in accordance with the decrease of
 $q^{2+}$
and
 $\unicode[STIX]{x1D716}^{+}$
in figure 7. In figure 8(b)
 $\langle \unicode[STIX]{x1D714}_{2}^{2}\rangle ^{+}$
for
 $LTS$
is smaller than that of the other longitudinal corrugations.
2.2.6 Flow visualisations and statistics
The surface contours of
 $\unicode[STIX]{x1D714}_{2}$
, in the region near the plane of the crests, for the different corrugations may help to explain what has been previously discussed. The visualisations are performed by taking only one realisation, from which the r.m.s. profiles of
 $\langle \unicode[STIX]{x1D714}_{2}^{2}\rangle$
are calculated. The comparison between these profiles, indicated by lines, and those calculated by taking several fields, indicated by symbols, demonstrates that the main features, previously described by converged statistics, are captured by one realisation. This is shown in figure 9(a) and in figure 9(b) through the profiles of
 $\langle u_{2}^{2}\rangle$
and of
 $\langle \unicode[STIX]{x1D714}_{2}^{2}\rangle$
in computational units. These profiles show, in figure 9(a), that,
 $\langle u_{2}^{2}\rangle$
is rather constant near the plane of the crests, and
 $\langle \unicode[STIX]{x1D714}_{2}^{2}\rangle$
depends on the type of corrugations. In some of the flows, and, in particular, for those with a large resistance or those with large longitudinal corrugations (
 $LLS$
)
 $\langle \unicode[STIX]{x1D714}_{2}^{2}\rangle$
decreases moving far from the plane of the crests. For transverse corrugations
 $\langle \unicode[STIX]{x1D714}_{2}^{2}\rangle$
increases as for smooth walls. It remains constant in a thick layer for the drag reducing flow (
 $LTS$
). The weak
 $u_{2}$
fluctuations created by the
 $TS$
corrugation do not produce large differences in the near-wall streaks, as it can be appreciated by comparing figure 10(a) for
 $SM$
and figure 10(b) for
 $TS$
. To illustrate the different shapes of
 $\unicode[STIX]{x1D714}_{2}$
generated near the corrugations, the surface contours in figure 10 are shown in one fourth of the computational domain. The strong
 $u_{2}$
fluctuations emerging from the
 $CS$
and the
 $TT$
surfaces break the streamwise coherence of the near-wall structures highlighted in figure 10(c) (
 $TT$
) and in figure 10(d) (
 $CS$
). The
 $\unicode[STIX]{x1D714}_{2}$
surface contours are therefore clustered in short regions. The tendency towards the isotropisation of the small scales is also corroborated by visualisations, not shown of
 $\unicode[STIX]{x1D714}_{1}$
and
 $\unicode[STIX]{x1D714}_{3}$
. The impact of the geometry surfaces on the
 $\unicode[STIX]{x1D714}_{2}$
vorticity is depicted in figure 10(e) by the positive and negative surface contours of
 $\unicode[STIX]{x1D714}_{2}$
attached to the corners of
 $LLS$
, spanning the entire length in the streamwise direction. These vorticity layers are generated by the strong
 $\unicode[STIX]{x2202}u_{1}/\unicode[STIX]{x2202}x_{3}$
forming near the vertical walls inside the cavities. A similar view is obtained in the
 $LS$
(figure 10
f) and
 $LT$
(figure 10
g) corrugations by the layers of
 $\unicode[STIX]{x1D714}_{2}$
generated near the cavities walls. For
 $LT$
the
 $\unicode[STIX]{x1D714}_{2}$
layers are less intense than those for
 $LS$
, accordingly to the profiles in figure 9(b). In the drag reducing
 $LTS$
configuration the weak motion near the plane of the crest creates a more uniform flow, and the vorticity structures in figure 10(h) are weak.
Profiles in computational units of the r.m.s. of the: (a) normal to the wall velocity, (b) normal to the wall vorticity components, for the flows with rough surfaces listed in the legend of (b), symbols show averages in time and in the homogeneous directions
 $x_{1}$
and
 $x_{3}$
, lines show the same quantities averaged in
 $x_{1}$
and
 $x_{3}$
of the fields used to get the visualisations of
 $\unicode[STIX]{x1D714}_{2}$
.

Surface contours of
 $\unicode[STIX]{x1D714}_{2}$
considering only half of the computational domain in
 $x_{1}$
and
 $x_{3}$
(red
 $\unicode[STIX]{x1D714}_{2}=+1$
, yellow
 $\unicode[STIX]{x1D714}_{2}=-1$
): (a)
 $SM$
, (b)
 $TS$
, (c)
 $TT$
, (d)
 $CS$
, (e)
 $LLS$
, (f)
 $LS$
, (g)
 $LT$
, (h)
 $LTS$
.

2.2.7 Turbulent kinetic energy production
Profiles in wall units of the stress aligned with: (a)
 $S_{\unicode[STIX]{x1D6FC}}$
, (b)
 $S_{\unicode[STIX]{x1D6FE}}$
, of the turbulent kinetic energy production aligned with (c)
 $S_{\unicode[STIX]{x1D6FC}}$
, (d)
 $S_{\unicode[STIX]{x1D6FE}}$
, (e) turbulent kinetic energy production, (f) full rate of dissipation
 $D_{k}^{+}$
, for the flows with rough surfaces listed in the legend of (a), compared with those in presence of smooth walls (open circle show present work at
 $R_{\unicode[STIX]{x1D70F}}=204$
, lines Lee & Moser (Reference Lee and Moser2015) at
 $R_{\unicode[STIX]{x1D70F}}=180$
).

The large dependence of the statistics on the shape of the corrugations should be also observed in the components of the normal stresses aligned with the eigenvectors of the strain tensor
 $\unicode[STIX]{x1D61A}_{ij}$
. As for smooth walls, in this reference system, the stress
 $R_{\unicode[STIX]{x1D6FE}\unicode[STIX]{x1D6FE}}$
aligned with the compressive
 $S_{\unicode[STIX]{x1D6FE}}$
and the
 $R_{\unicode[STIX]{x1D6FC}\unicode[STIX]{x1D6FC}}$
aligned with the extensional
 $S_{\unicode[STIX]{x1D6FC}}$
strain become of the same order. The stress in the spanwise direction (
 $R_{33}$
), does not change, and coincides with
 $R_{\unicode[STIX]{x1D6FD}\unicode[STIX]{x1D6FD}}$
aligned with
 $S_{\unicode[STIX]{x1D6FD}}=0$
. For any surface figure 11(a) and figure 11(b) show that the stresses aligned with
 $S_{\unicode[STIX]{x1D6FE}}$
are greater than those aligned with
 $S_{\unicode[STIX]{x1D6FC}}$
. For the longitudinal corrugations
 $R_{\unicode[STIX]{x1D6FC}\unicode[STIX]{x1D6FC}}$
and
 $R_{\unicode[STIX]{x1D6FE}\unicode[STIX]{x1D6FE}}$
become very large. This is mainly due to the growth of
 $R_{11}$
in particular for the
 $LLS$
surface. In this reference system no one component has a constant trend near the plane of the crests as that in figure 9(a). The
 $R_{\unicode[STIX]{x1D6FC}\unicode[STIX]{x1D6FC}}$
and the
 $R_{\unicode[STIX]{x1D6FE}\unicode[STIX]{x1D6FE}}$
grow or decrease with slopes that depend on the shape of the surface. The slope is zero for the
 $LT$
surface. This stress decomposition allows us to split the turbulent kinetic production
 $P_{k}=-(P_{\unicode[STIX]{x1D6FE}}+P\unicode[STIX]{x1D6FC})$
; in magnitude
 $P_{\unicode[STIX]{x1D6FE}}$
in figure 11(d), is greater than
 $P\unicode[STIX]{x1D6FC}$
in figure 11(c). Near the walls the two component have a similar trend with the highest values for the
 $LLS$
due to the strong fluctuations generated within the cavities. The increase of
 $R_{\unicode[STIX]{x1D6FC}\unicode[STIX]{x1D6FC}}$
and
 $R_{\unicode[STIX]{x1D6FE}\unicode[STIX]{x1D6FE}}$
despite the reduction of
 $S_{\unicode[STIX]{x1D6FC}}$
and
 $S_{\unicode[STIX]{x1D6FE}}$
leads to the increase of
 $P_{\unicode[STIX]{x1D6FC}}^{+}$
and of
 $P_{\unicode[STIX]{x1D6FE}}^{+}$
. For the drag reducing surface the components of
 $P_{k}$
decrease. These are rather small for the three-dimensional corrugations. The same trend should be expected for
 $P_{k}$
, on the other hand, figure 11(e) shows a different trend with maximum production for
 $TT$
and a sensible reduction for
 $LLS$
and
 $LS$
corrugations. In some of the flows the maximum production is located near the plane of the crests, with the exception of the
 $LTS$
and
 $TS$
surfaces, which do not differ much from the
 $P_{k}$
profile in the presence of smooth walls. The rate of isotropic dissipation
 $\unicode[STIX]{x1D716}^{+}$
in the region near the plane of the crests, in figure 7(b), is greater than the production
 $P_{k}^{+}$
. The trend of the maximum of
 $\unicode[STIX]{x1D716}^{+}$
is not similar to that of the production
 $P_{k}^{+}$
. Near smooth walls, in figure 2, the same trend for the profiles of
 $P_{k}^{+}$
and
 $D_{k}^{+}$
was observed and the difference between the two was balanced by the turbulent diffusion
 $T_{k}^{+}$
due to the nonlinear terms. In figure 11(f)
 $D_{k}^{+}$
has been plotted, showing a complex behaviour. For the
 $CS$
,
 $LT$
,
 $LTS$
and
 $LS$
corrugations a trend similar to that of
 $P_{k}^{+}$
is found while for the other flows large differences occur. Therefore very large differences should be expected in the profiles of
 $T_{k}^{+}$
.
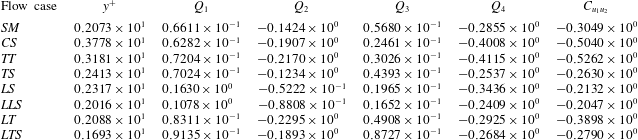
Profiles in wall units of the simplified budgets:
 $D_{k}=\unicode[STIX]{x1D708}\langle u_{i}\unicode[STIX]{x1D6FB}^{2}u_{i}\rangle$
,
 $P_{k}=-2\langle u_{2}u_{1}\rangle S$
,
 $T_{k}=-((1/2)\text{d}\langle u_{2}u_{i}^{2}\rangle /\text{d}x_{2}+\langle u_{i}(\unicode[STIX]{x2202}p/\unicode[STIX]{x2202}x_{i})\rangle )$
(a)
 $SM,4.90,-4.90,0.$
, (b)
 $TS,7.17,-6.94,-0.26$
, (c)
 $TT,15.96,-14.37,-1.54$
, (d)
 $CS,22.07,-18.48,-3.64$
, (e)
 $LLS,2.36,-2.07,-0.34$
, (f)
 $LS,6.43,-5.82,-0.80$
, (g)
 $LT,4.15,-4.10,-0.16$
, (h)
 $LTS,2.36,-2.45,+0.09$
, the values of the integrals, the first
 $I_{P}$
the second
 $I_{D}$
the third
 $I_{T}$
are multiplied by
 $10^{4}$
, in (a) line Lee & Moser (Reference Lee and Moser2015) at
 $R_{\unicode[STIX]{x1D70F}}=180$
symbols present
 $R_{\unicode[STIX]{x1D70F}}=204$
.

2.2.8 Budgets of turbulent kinetic energy
The simplified turbulent kinetic energy budgets allow us to demonstrate the different behaviour in the presence of smooth and that in the presence of rough surfaces. In these circumstances the production
 $P_{k}$
is balanced by total dissipation
 $D_{k}$
and by
 $T_{k}$
, accounting for the turbulent diffusion and for the correlation between the velocity and pressure gradient. For smooth walls the three terms are zero at the wall, and grow with different trends;
 $|D_{k}|$
and
 $T_{k}$
proportionally to
 $y^{2}$
and
 $P_{k}$
to
 $y^{3}$
. The
 $T_{k}$
is positive in the region with
 $-\langle Q\rangle >0$
meaning that the sheet-like structures loose energy towards the region with
 $-\langle Q\rangle <0$
where the tubular-like structures prevail. This is depicted in figure 12(a) with the present data compared with those of Lee & Moser (Reference Lee and Moser2015) at
 $R_{\unicode[STIX]{x1D70F}}=180$
. The agreement is rather good, with the small differences in
 $D_{k}^{+}$
and
 $T_{k}^{+}$
mainly due to the different Reynolds numbers. The transverse square bars
 $TS$
show a trend in figure 12(b) similar to that in figure 12(a). The
 $TS$
is characterised by
 $D_{k}^{+}$
and
 $P_{k}^{+}$
different from zero at the plane of the crests. This occurrence is due to the small velocity fluctuations generated inside the square cavities. In the presence of triangular bars (
 $TT$
) the strong fluctuations emerging from the cavities produce a high
 $\langle u_{1}u_{2}\rangle _{W}$
, therefore the maximum production, in figure 12(c), moves at the plane of the crests with the consequence of having there a high
 $D_{k}^{+}$
. In this flow the turbulent transfer is low and negative near the plane of the crests. This negative contribution is partially balanced by the positive contribution at the centre of the channel. It is worth recalling that for smooth walls the total contribution of the turbulent transfer is zero, for rough surfaces it is smaller than the total production and full rate of dissipation, but it could be different from zero. The values of the total contribution of each term are reported in the caption and are indicated with
 $I_{P}$
for production,
 $I_{D}$
for dissipation and
 $I_{T}$
for transfer. For the
 $CS$
surface figure 12(d) shows a reduction of
 $P_{k}^{+}$
and
 $D_{k}^{+}$
near the plane of the crests. The large disturbances emerging from the interior of the surfaces make
 $T_{k}^{+}$
a sink of energy comparable to the total rate of dissipation. This is corroborated by the large values
 $-\langle Q\rangle <0$
in figure 8(a) implying the prevalence of tubular-like structures in this layer. For the
 $LLS$
corrugation the wide cavity generates large
 $u_{2}$
fluctuations, therefore
 $T_{k}^{+}$
is a sink of turbulent kinetic energy greater than
 $D_{k}^{+}$
(figure 12
e), implying the formation of tubular-like structures near the plane of the crests, as was depicted in figure 8(a). Figure 9(a) shows that the
 $\langle u_{2}^{2}\rangle$
for
 $LS$
does not change too much with respect to that for
 $LLS$
and therefore the
 $T_{k}^{+}$
profile in figure 12(f) is similar to that in figure 12(e). For
 $LS$
the increase of solid at the plane of the crests leads to an increase of
 $S$
greater than the reduction of
 $\langle u_{2}u_{1}\rangle$
, as is shown in figure 6(a,b). This occurrence explains the increase of
 $P_{k}^{+}$
and
 $D_{k}^{+}$
in figure 12(f) with respect to the quantities calculated near the plane of the crests for
 $LLS$
. For the triangular (
 $LT$
) as well as for the square (
 $LS$
) longitudinal bars,
 $T_{k}^{+}$
is negative in a large part of the channel. In figure 12(g) the values of
 $T_{k}^{+}$
are small, therefore the energy produced is directly dissipated. For the
 $LTS$
the
 $u_{2}$
fluctuations reduce with respect to those generated in the
 $LT$
corrugations (figure 9
a), in addition the profiles of
 $-\langle Q\rangle$
for
 $LTS$
in figure 8(a) are similar to those for
 $TS$
and consequently the budgets in figure 12(h) do not differ too much from those in figure 12(b).
Profiles in wall units of: (a)
 $\unicode[STIX]{x1D708}_{T}^{+}$
for the flows with rough surfaces (symbols) listed in the legend, compared with those in presence of smooth walls (open circle show present work at
 $R_{\unicode[STIX]{x1D70F}}=204$
, lines Lee & Moser (Reference Lee and Moser2015) at
 $R_{\unicode[STIX]{x1D70F}}=180$
), (b)
 $\unicode[STIX]{x1D708}_{T}|_{W}^{+}$
with solid line
 $5.5/0.4v_{W}^{\prime +}$
, (c)
 $\unicode[STIX]{x0394}U^{+}$
with solid line
 $12.5(v_{W}^{\prime +})^{4}$
, (d)
 $K_{S}^{+}$
versus
 $v_{W}^{\prime +}$
, the black symbols from the simulations in Orlandi (Reference Orlandi2013) the red symbols present results.

2.2.9 Suggestions for RANS closures
The simplified budgets in figure 12 can help to direct the turbulence modellers to improve the low Reynolds number RANS closures for simulations of flows past rough surfaces at high Reynolds numbers. For instance the modification of the Spalart–Allmaras closure proposed by Aupoix & Spalart (Reference Aupoix and Spalart2003) requires the modification of the turbulent viscosity in the wall region, as they reported in their figure 10. The turbulent viscosity profiles obtained by the present simulations in figure 13(a) qualitatively agree with the experimental profiles in Aupoix & Spalart (Reference Aupoix and Spalart2003). The correction for the roughness could be achieved by assigning the value of
 $\unicode[STIX]{x1D708}_{T}|_{W}^{+}$
at the plane of the crests, that depends on the type of surfaces. However, figure 13(a) shows that the same profile of
 $\unicode[STIX]{x1D708}_{T}^{+}$
may be obtained by completely different surfaces. Therefore a parametrisation based on the geometrical properties of the rough surface should be rather difficult. As previously mentioned the parametrisation based on
 $v_{W}^{\prime +}=\sqrt{\langle u_{2}^{2+}\rangle _{W}}$
could be useful. The arguments in Orlandi (Reference Orlandi2013) on the importance of the normal to the wall stress have been qualitatively reported in commenting the proportionality between the roughness function
 $\unicode[STIX]{x0394}U^{+}$
and
 $v_{W}^{\prime +}$
.
The analytical expression
 $\unicode[STIX]{x0394}U^{+}=B(v_{W}^{\prime +}/\unicode[STIX]{x1D705})$
, (with
 $B=5.5$
the constant in the expression of the
 $\log$
law for smooth walls, and
 $\unicode[STIX]{x1D705}=0.4$
the von Kármán constant) fitted well the data obtained by several simulations of flows past rough surfaces. The data with the black solid symbols in figure 13(c) derived by simulations with one wall rough and the other smooth, and the present (red squares in figure 13
c) with two rough walls fit well the linear relationship. From the profiles of
 $\unicode[STIX]{x1D708}_{T}^{+}$
in figure 13(a) and from the profiles calculated by the simulation in Orlandi (Reference Orlandi2013) the values of
 $\unicode[STIX]{x1D708}_{T}|_{W}^{+}$
, in figure 13(b), fit rather well the expression
 $\unicode[STIX]{x1D708}_{T}|_{W}^{+}=12.5{v_{W}^{\prime +}}^{4}$
. Nikuradse (Reference Nikuradse1950) from a large number of measurements of flow past rough surfaces, made by sand grains of different size, in which the corrugation cannot be exactly characterised, derived the expression for the mean velocity in wall units
 $U^{+}=8.48+(1/\unicode[STIX]{x1D705})\log (y^{+}/K_{S}^{+})$
where
 $K_{S}^{+}$
is an equivalent roughness height. From the present results and from those in Orlandi (Reference Orlandi2013) the values of
 $K_{S}^{+}$
are plotted in figure 13(d) versus the corresponding value of
 $v_{W}^{\prime +}$
, showing a good collapse of the data, with the exception of the simulations having high values of
 $U_{W}$
at the plane of the crests. In Nikuradse (Reference Nikuradse1950) an equivalent roughness height was introduced and was not linked to the shape of the corrugations, the present results suggest the introduction of a value
 $v_{W}^{\prime +}$
equivalent to a roughness height. The passage from an equivalent roughness height to a normal to the wall stress should be useful in RANS simulation requiring boundary conditions at
 $y=0$
for turbulent statistics.
Values of the quadrant contribution to the
 $C_{u_{1}u_{2}}$
correlation coefficients at
 $y^{+}\approx 7$
for the cases indicated as in table 1.

2.2.10 Quadrant analysis
Profiles in computational units of: (a) correlation coefficient between
 $u_{1}$
and
 $u_{2}$
, for the flows with rough surfaces listed in the inset, (lines Lee & Moser (Reference Lee and Moser2015) at
 $R_{\unicode[STIX]{x1D70F}}=180$
); (b) quadrant contribution to
 $-C_{u_{1}u_{2}}$
for the
 $SM$
flow.

The statistics previously discussed depicted large variations near the plane of the crests that depend on the shape of the surface. The correlation affecting more the turbulent kinetic energy production is
 $\langle u_{1}u_{2}\rangle$
, therefore it is worth analysing the profiles of the correlation coefficient
 $C_{u_{1}u_{2}}=\langle \unicode[STIX]{x1D70E}_{1}\unicode[STIX]{x1D70E}_{2}\rangle$
in figure 14(a) (
 $\unicode[STIX]{x1D70E}_{i}=u_{i}/\langle u_{i}^{2}\rangle ^{1/2}$
). The interesting feature of this figure consists in a large influence of the type of surface on the values of
 $-C_{u_{1}u_{2}}$
near the plane of the crests. The satisfactory independence in the outer region, corroborating the Townsend similarity hypothesis, can be better appreciated by plotting
 $-C_{u_{1}u_{2}}$
versus
 $y$
. In the presence of smooth walls from the Lee & Moser (Reference Lee and Moser2015) data it can be observed that
 $-C_{u_{1}u_{2}}$
is almost independent on the Reynolds number for
 $R_{\unicode[STIX]{x1D70F}}>1000$
; it grows from a value equal to
 $0.2$
at the wall to
 $0.40$
at the location of maximum turbulent kinetic energy production. This correlation coefficient is linked to the flow structures, whose contribution can be gathered through the quadrant analysis described by Wallace (Reference Wallace2016). This contribution varies across the channel accordingly to the kind of flow structure. For instance by plotting the contribution of the four quadrants
 $Q_{1}(+\unicode[STIX]{x1D70E}_{1},+\unicode[STIX]{x1D70E}_{2})$
,
 $Q_{2}(-\unicode[STIX]{x1D70E}_{1},+\unicode[STIX]{x1D70E}_{2})$
,
 $Q_{3}(-\unicode[STIX]{x1D70E}_{1},-\unicode[STIX]{x1D70E}_{2})$
,
 $Q_{4}(+\unicode[STIX]{x1D70E}_{1},-\unicode[STIX]{x1D70E}_{2})$
to
 $C_{u_{1}u_{2}}$
across the channel it can be observed that the second and fourth quadrants prevail over the first and third. The ejection and sweeps events contribute to
 $Q_{2}$
and
 $Q_{4}$
, and for their relevance has been deeply investigated. Wallace (Reference Wallace2016) defined the events in the first and third quadrants as outward and inward interactions and their contributions are constant moving far from the wall, as is shown in figure 14(b). For
 $y^{+}<20$
 $Q_{4}$
prevails over
 $Q_{2}$
, and the location where the two are equal is close to the location of the first change of sign of
 $(\text{d}^{2}\langle u_{2}^{2}\rangle /\text{d}x_{2}^{2})^{+}$
separating the sheet-dominated from the tubular-dominated regions. For each roughness the profiles of
 $Q_{i}$
behave similarly to those in figure 14(b). More interestingly the change of sign between
 $Q_{4}$
and
 $Q_{2}$
varies accordingly to the variation of the zero crossing point in figure 8(a).
Figure 11(e) shows that the production of turbulent kinetic energy for smooth walls grows in the region dominated by the sweep events. The joint p.d.f.
 $P(q_{1},q_{2})$
, or more interestingly the covariance integrated
 $q_{1}q_{2}P(q_{1},q_{2})$
, has been calculated at
 $y^{+}\approx 2$
for any surface. This is the distance at which figure 14(a) shows large variations strictly linked to the different shape of the corrugation. The values of
 $C_{u_{1}u_{2}}$
together with the contribution of the four quadrants are given in table 2 and are indicated by the black open squares in figure 14(a). The greater values of
 $C_{u_{1}u_{2}}$
are obtained by the
 $CS$
and
 $TT$
flows for the large increase of the
 $Q_{4}$
contribution. The comparison between the covariance integrated plots for
 $SM$
(figure 15
a) and that for
 $CS$
(figure 15
d) depicts more minor changes for the quadrant with
 $\unicode[STIX]{x1D70E}_{1}<0$
than for those with
 $\unicode[STIX]{x1D70E}_{1}>0$
. The same behaviour is observed in figure 15(c) for the
 $TT$
surface. The contours in the first quadrant have a complex shape, due to the form of the surface affecting the ejections of high intensity in the
 $CS$
and
 $TT$
surfaces. From visualisations of
 $\unicode[STIX]{x1D70E}_{2}$
it can be appreciated that, for the corrugations with a large solid region, at the plane of the crests, the shape of the surfaces is visible up to distances
 $y^{+}\approx 10$
. On the other hand, from the
 $\unicode[STIX]{x1D70E}_{1}$
contours it is difficult to recognise the shape of the underlying surface, however it is clear that the elongation of the longitudinal structures is strongly reduced for the
 $CS$
and
 $TT$
surfaces. In the sheet-dominated region the p.d.f. profiles, evaluated by the joint p.d.f., for the
 $CS$
and
 $TT$
surfaces are symmetric for
 $\unicode[STIX]{x1D70E}_{2}$
and positive skewed for the
 $\unicode[STIX]{x1D70E}_{1}$
. Due to the weak
 $\unicode[STIX]{x1D70E}_{2}$
disturbance in the
 $TS$
flow the profiles of the quadrant contributions, the covariance integrated contours in figure 15(b) and the relative p.d.f. do not change much with respect to those of the
 $SM$
surface. The
 $-C_{u_{1}u_{2}}$
for the surfaces with longitudinal bars are smaller in particular for the
 $LLS$
and the
 $LS$
surfaces, due to the reduction of
 $Q_{4}$
and the increase of
 $Q_{1}$
. This is clearly depicted in figure 15(e) and figure 15(f). The corresponding visualisations, not shown, emphasise the formation of long streamwise structures with the positive streaks over the cavities and the negative over the solid. For
 $LLS$
the magnitude of the peaks in the layers with
 $\unicode[STIX]{x1D70E}_{1}>0$
is smaller than that for
 $LS$
. The symmetric p.d.f. of
 $\unicode[STIX]{x1D70E}_{2}$
do not change, instead the p.d.f. of
 $\unicode[STIX]{x1D70E}_{1}$
present, for both surfaces, a sharp decrease leading to negative values of the skewness coefficient. For the
 $LT$
and for the
 $LTS$
surfaces
 $-C_{u_{1}u_{2}}$
increases with respect to the flows past longitudinal square bars due to the increase of the
 $Q_{2}$
contribution. For
 $LT$
the highest value of
 $Q_{2}$
is given in table 2; it is confirmed by the contours in figure 15(g).
The covariance integrated
 $q_{1}q_{2}P(q_{1},q_{2})$
at
 $y^{+}\approx 5$
between
 $u_{1}$
and
 $u_{2}$
with contour increments
 $\unicode[STIX]{x1D6E5}=0.00001$
(a)
 $SM$
, (b)
 $TS$
, (c)
 $TT$
, (d)
 $CS$
, (e)
 $LLS$
, (f)
 $LS$
, (g)
 $LT$
, (h)
 $LTS$
, the minimum is
 $\unicode[STIX]{x1D70E}_{i}=-4$
and the maximum
 $\unicode[STIX]{x1D70E}_{i}=4$
.

Contours of (a1)
 $\unicode[STIX]{x1D70C}11$
, (b1)
 $\unicode[STIX]{x1D70C}22$
, (c1)
 $\unicode[STIX]{x1D70C}12$
, (d1)
 $\unicode[STIX]{x1D70C}\unicode[STIX]{x1D6FC}\unicode[STIX]{x1D6FC}$
, (e1)
 $\unicode[STIX]{x1D70C}\unicode[STIX]{x1D6FE}\unicode[STIX]{x1D6FE}$
at
 $y^{+}\approx 5$
considering only half of the computational domain in
 $x_{1}$
and
 $x_{3}$
with increments
 $\unicode[STIX]{x1D6E5}=0.25$
, yellow positive, blue negative for
 ${<}5$
magenta positive, for
 ${>}5$
green negative; left
 $SM$
, centre
 $LTS$
, right
 $CS$
.

2.2.11 Turbulent stress visualisations
For the flows past rough surfaces it is interesting to visualise the distribution of the stresses
 $u_{l}u_{m}$
in planes
 $x_{1}{-}x_{3}$
parallel to the plane of the crests. As was done for the three-dimensional visualisations of
 $\unicode[STIX]{x1D714}2$
in figure 10 the stresses are evaluated by one realisation and are shown only in a quarter of the computational domain. The subscripts
 $l$
and
 $m$
may indicate either the components in the Cartesian reference system or those in the frame aligned with the eigenvalues of the strain tensor
 $\unicode[STIX]{x1D61A}_{ij}$
. The contours in figure 16 are done for
 $\unicode[STIX]{x1D70C}_{lm}(x_{1},x_{3})=(u_{l}u_{m}(x_{1},x_{3})-R_{lm})/R_{lm}$
, with
 $R_{lm}=(1/N1N3)\unicode[STIX]{x1D6F4}_{N1}\unicode[STIX]{x1D6F4}_{N3}u_{l}u_{m}(x_{1},x_{3})$
, at the distance
 $y^{+}\approx 5$
from the plane of the crests. Usually the streaks are visualised through contours of
 $\unicode[STIX]{x1D70E}_{1}$
producing a picture with elongated positive and negative regions similar to those in figure 16(a1) for
 $\unicode[STIX]{x1D70C}_{11}$
. The yellow positive layers have few peaks with high values (magenta coloured) the less intense blue negative are located in wider elongated structures. The contours of
 $\unicode[STIX]{x1D70C}_{22}$
in figure 16(b1) depict regions of small size with a large number of intense positive values. This implies for
 $u_{2}$
a large flatness factor, and agrees with the covariance integrated distribution in figure 15(a). High values of negative
 $\unicode[STIX]{x1D70C}_{12}$
(green coloured) can be detected in figure 16(c1), in correspondence of the high values of
 $\unicode[STIX]{x1D70C}_{22}$
. The contours of the
 $\unicode[STIX]{x1D70C}_{\unicode[STIX]{x1D6FC}\unicode[STIX]{x1D6FC}}$
in figure 16(d1) and of
 $\unicode[STIX]{x1D70C}_{\unicode[STIX]{x1D6FE}\unicode[STIX]{x1D6FE}}$
in figure 16(e1) are similar, and close to those of
 $\unicode[STIX]{x1D70C}_{11}$
in figure 16(a1).
 $R_{\unicode[STIX]{x1D6FE}\unicode[STIX]{x1D6FE}}$
in figure 11(b) for
 $SM$
was greater than
 $R_{\unicode[STIX]{x1D6FC}\unicode[STIX]{x1D6FC}}$
in figure 11(a), this difference, in the visualisations, cannot be appreciated due to the normalisation of
 $\unicode[STIX]{x1D70C}_{lm}$
. The anisotropy at
 $y^{+}\approx 5$
, in the Cartesian reference frame, is clearly illustrated by comparing figure 16(a1) and figure 16(b1). In the strain rate reference system the anisotropy is visually appreciated by comparing the contours of
 $\unicode[STIX]{x1D70C}_{\unicode[STIX]{x1D6FD}\unicode[STIX]{x1D6FD}}$
, not shown and equal to those of
 $\unicode[STIX]{x1D70C}_{33}$
, with those in in figure 16(d1) and in figure 16(e1).
The figures in the central column for the
 $LTS$
flow of
 $\unicode[STIX]{x1D70C}_{11}$
(figure 16
a2),
 $\unicode[STIX]{x1D70C}_{\unicode[STIX]{x1D6FC}\unicode[STIX]{x1D6FC}}$
(figure 16
d2) and
 $\unicode[STIX]{x1D70C}_{\unicode[STIX]{x1D6FE}\unicode[STIX]{x1D6FE}}$
(figure 16
e2) are similar to those for
 $SM$
, with more elongated positive regions due to the effects of the underlying surface, barely visible. On the other hand, large differences can be appreciated between the contours of
 $\unicode[STIX]{x1D70C}_{22}$
(figure 16
b2) and
 $\unicode[STIX]{x1D70C}_{12}$
(figure 16
c2) and the corresponding figure for
 $SM$
in the left column. For
 $LTS$
the formation of spanwise coherent structures with intense positive peaks is clear, in correspondence with these, strong negative
 $\unicode[STIX]{x1D70C}_{12}$
values appear. The common features of the
 $LTS$
and
 $SM$
surfaces are the strong influence of the
 $u_{2}$
fluctuations on the turbulent stress
 $\langle u_{1}u_{2}\rangle$
and therefore on the production of turbulence. This is a further proof that the
 $u_{2}$
fluctuations are those characterising wall turbulence. In the presence of smooth walls the streaks do not form in particular locations. For the
 $LLS$
corrugations the streaks are linked to the underlying surfaces as can be observed in visualisations, not shown for sake of brevity. The influence of the underlying surface can be appreciated in the visualisations for the
 $CS$
flow in the right column of figure 16. In this case the disturbances generated within the roughness layer are strong enough to destroy the near-wall anisotropy. The contours of
 $\unicode[STIX]{x1D70C}_{11}$
(figure 16
a3),
 $\unicode[STIX]{x1D70C}_{\unicode[STIX]{x1D6FC}\unicode[STIX]{x1D6FC}}$
(figure 16
d3) and
 $\unicode[STIX]{x1D70C}_{\unicode[STIX]{x1D6FE}\unicode[STIX]{x1D6FE}}$
(figure 16
e3) show that the elongated streamwise structures are not any more visible, and that their size is approximately the same as that of
 $\unicode[STIX]{x1D70C}_{22}$
. Therefore the tendency towards the isotropy in the near-wall layer is clearly depicted. In the presence of strong
 $u_{2}$
and
 $u_{1}$
disturbances it is found that the intense negative values of
 $\unicode[STIX]{x1D70C}_{12}$
in figure 16(c3) are strongly correlated with those of
 $\unicode[STIX]{x1D70C}_{22}$
in figure 16(b3) and also with the
 $\unicode[STIX]{x1D70C}_{11}$
. To conclude, the stress distribution in the near-wall layer is strictly linked to the staggered distribution of the cubes inside the corrugation.
3 Concluding remarks
This paper is focused on the connection between turbulent structures and production of turbulent kinetic energy. Emphasis has been directed towards statistics seldom considered in the analysis of wall-bounded flows. Namely the full dissipation rate, the shear parameter and different expression for the production of turbulent kinetic energy. The canonical two-dimensional turbulent channel has been investigated by taking the data from DNS at high and low friction velocity Reynolds numbers. In a recent review paper Jiménez (Reference Jiménez2018) reported the debate about the eventual universality of wall-bounded flows by increasing the Reynolds number. He shortly discussed the shear parameter
 $S^{\ast }$
without discussing the universality of this parameter for
 $y^{+}<20$
. Since
 $S^{+}$
does not vary with the Reynolds number, in the present paper the eddy turnover time in wall units has been evaluated by DNS data, leading to the conclusion that it shows a good universality. The eddy turnover time can also be defined as the ratio between
 $q^{2+}$
and the full rate of dissipation
 $D_{k}^{+}$
, in this case it has been found that it grows linearly for
 $y^{+}<1$
, and that in the outer region, by increasing the Reynolds number, tends to a linear growth. The constants of proportionality in the two regions are different, therefore there is a small layer with constant
 $q^{2+}/D_{k}^{+}$
connecting the two regions with linear growth. This layer is located in the region where the ribbon-like structures overcome the tubular structures, and where the turbulent kinetic energy grows. The formation of regions with
 $q^{2+}/D_{k}^{+}\propto y^{+}$
can be a first indication that the flow structures near the wall and those in the outer region are of the same kind. Those near the wall move fast and those in the outer layer are slow. The constant of proportionality near the wall is greater than that in the outer region. From the data it can also be observed that, at
 $R_{\unicode[STIX]{x1D70F}}=5200$
, in the outer region the linear growth is not fully established but that there is a tendency to it. However, our view is that it will be indeed achieved by simulations at a slightly higher
 $Re$
. From the data it was also possible to conclude that the maximum turbulent kinetic energy production scales at high Reynolds numbers and that the maximum is located at a distance from the wall where there is the transition between sheet-dominated and rods-dominated layers. Namely in the region where the ribbon unstable structures roll-up to become tubular structures. Finally it was found that the rate of isotropic dissipation largely depends on the Reynolds number, and that the full rate dissipation does not.
Flows past smooth walls have well-defined boundary conditions for the velocity fields. These boundary conditions can be varied by changing the shape of the walls. Through the DNS of flows past several kind of corrugations it was observed that it is easy to increase the resistance, and rather difficult to reduce it. Drag reduction is obtained when the viscous stress at the plane of the crests reduces more than the increase of the turbulent stress
 $\langle u_{1}u_{2}\rangle$
. In this regard it is interesting to look at the results of Arenas et al. (Reference Arenas, García, Orlandi, Fu, Hultmark and Leonardi2018) with drag reduction, for any kind of corrugation, achieved by imposing
 $u_{2}=0$
at the plane of the crests. In real applications this is a very difficult task, but from a mathematical point of view is important. The simulations of flows past several types of corrugations allowed us to reach the conclusion that a universal behaviour cannot be found. However, the parametrisation of rough walls can be obtained through the normal to the wall stress at the plane of the crests. This result can give insight to improve turbulence RANS closures, for instance the Spalart–Almaras model. It was also observed that in RANS the reproduction of the turbulent kinetic energy budget is simpler by considering the full rate of dissipation instead of the isotropic rate of dissipation. The flow structures near the plane of the crests for corrugations generating intense
 $u_{2}$
fluctuations tend to become more isotropic. For the drag reducing corrugations spanwise coherent structures form which are easily detected by the
 $u_{2}$
contours and even better by pressure contours. These structures were observed at high Reynolds number by Raupach, Finningan & Brunet (Reference Raupach, Finningan and Brunet1996) in flows past canopies. They claimed that these structures were generated by inflectional velocity profiles similar to those occurring in mixing layers. In the experiment the drag was greater than that in presence of smooth walls. Similar conclusions were reached by García-Mayoral & Jiménez (Reference García-Mayoral and Jiménez2011) by simulations of flows past square bars in the case of breakdown of drag reduction and the spanwise structures were barely visualised. In the present simulations the spanwise structures were observed only in the drag reducing corrugations and it has been observed that a large role should be attributed to the pressure. More simulations are currently being performed to investigate how important these structures are.
Acknowledgements
First it is important to recognise the large effort made by several groups around the world to create and share the data base of turbulent flows at high Reynolds numbers. We acknowledge that some of the results reported in this paper have been achieved using the PRACE Research Infrastructure resource MARCONI based at CINECA, Casalecchio di Reno, Italy. A particular thank you to D. Sassun for helping me in the implementation of the immersed boundary method, and to S. Pirozzoli for a large number of discussions on wall turbulence and for the correction of the draft.