Introduction
Amblyopia is a developmental disorder of spatial vision usually associated with the presence of strabismus, anisometropia, or form deprivation early in life. Amblyopia affects eye movements, visual acuity, crowding contrast sensitivity, position acuity, stereopsis, and many other aspects of vision (see Kiorpes, Reference Kiorpes2006; Levi, Reference Levi2006 for reviews). Based largely on animal models, these losses in visual function have been hypothesized to reflect alterations in the properties of neurons in cortical area V1, with more recent work suggesting that the amblyopic deficits may cascade and be amplified downstream of V1 (Kiorpes, Reference Kiorpes2006; Levi, Reference Levi2006). Amblyopes suffer from deficits not simply explained by low-level considerations. These include deficits in second-order processing (Wong, Levi & McGraw, Reference Wong, Levi and McGraw2001; Simmers et al., Reference Simmers, Ledgeway, Hess and McGraw2003; Mansouri et al., Reference Mansouri, Allen and Hess2005; Wong & Levi, 2005; Chung et al., Reference Chung, Li and Levi2006; Simmers et al., Reference Simmers, Ledgeway, Mansouri, Hutchinson and Hess2006), crowding (Stuart & Burian, Reference Stuart and Burian1962; Flom et al., Reference Flom, Weymouth and Kahneman1963; Hess & Jacobs, Reference Hess and Jacobs1979; Levi & Klein, Reference Levi and Klein1985; Levi et al., Reference Levi, Hariharan and Klein2002; Hariharan et al., Reference Hariharan, Levi and Klein2005; Levi, Reference Levi2006; Bonneh et al., Reference Bonneh, Sagi and Polat2007), contour integration (Hess et al., Reference Hess, McIlhagga and Field1997b; Hess & Demanins, Reference Hess and Demanins1998; Mussap & Levi, Reference Mussap and Levi2000; Chandna et al., Reference Chandna, Pennefather, Kovacs and Norcia2001; Kozma & Kiorpes, Reference Kozma and Kiorpes2003; Levi et al., Reference Levi, Yu, Kuai and Rislove2007c), global form (Hess et al., Reference Hess, Wang, Demanins, Wilkinson and Wilson1999; Rislove et al., Reference Rislove, Hall, Stavros and Kiorpes2010) and motion (Hess et al., Reference Hess and Jacobs1997a; Ellemberg et al., Reference Ellemberg, Lewis, Maurer, Brar and Brent2002; Constantinescu et al., Reference Constantinescu, Schmidt, Watson and Hess2005; Ho & Giaschi, Reference Ho and Giaschi2006, Aaen-Stockdale et al., Reference Aaen-Stockdale, Ledgeway and Hess2007; Ho & Giaschi, Reference Ho and Giaschi2007; Wang et al., Reference Wang, Ho and Giaschi2007; Hou et al., Reference Hou, Pettet and Norcia2008; Hayward et al., Reference Hayward, Truong, Partanen and Giaschi2011; Mansouri & Hess, 2006) and temporal, spatial, and/or capacity limits of attention (Sharma et al., Reference Sharma, Levi and Klein2000; Popple & Levi, Reference Popple and Levi2008). Thus, amblyopia is detrimental to many aspects of visual performance.
Amblyopia is clinically important because, aside from refractive error, it is the most frequent cause of vision loss in infants and children. It is also of basic interest because it reflects the neural impairment that occurs when normal visual development is disrupted and is thus an ideal model for understanding when and how brain plasticity may be harnessed for recovery of function. In the last decade, there has been a massive rethinking about the pathophysiology and treatment of amblyopia fueled by new animal models (Bavelier et al., Reference Bavelier, Levi, Li, Dan and Hensch2010; Baroncelli et al., Reference Baroncelli, Maffei and Sale2011), clinical trials (Repka & Holmes, Reference Repka and Holmes2012), and by basic research on perceptual learning (for reviews see Levi & Li, Reference Levi and Li2009; Astle et al., Reference Astle, Webb and McGraw2011; Levi, Reference Levi2012).
Amblyopia is complex. The abnormalities depend on the timing and nature of early abnormal visual experience—differing in anisometropes and strabismics (McKee et al., Reference McKee, Levi and Movshon2003; Levi et al., Reference Levi, McKee and Movshon2011). Structural abnormalities appear as early as the lateral geniculate nucleus (Barnes et al., Reference Barnes, Li, Thompson, Singh, Dumoulin and Hess2010), and physiological changes are evident in cortical area V1 and cascade into higher visual areas (Imamura et al., Reference Imamura, Richter, Fischer, Lennerstrand, Franzen, Rydberg, Andersson, Schneider, Onoe, Watanabe and Langstrom1997; Goodyear et al., Reference Goodyear, Nicolle, Humphrey and Menon2000; Barnes et al., Reference Barnes, Hess, Dumoulin, Achtman and Pike2001; Lerner et al., 2006; Bonhomme et al., Reference Bonhomme, Liu, Miki, Francis, Dobre, Modestino, Aleman and Haselgrove2006; Muckli et al., Reference Muckli, Kiess, Tonhausen, Singer, Goebel and Sireteanu2006; Conner et al., Reference Conner, Odom, Schwartz and Mendola2007; Li et al., Reference Li, Dumoulin, Mansouri and Hess2007; Ho & Giaschi, Reference Ho and Giaschi2009; Secen et al., Reference Secen, Culham, Ho and Giaschi2011), possibly including areas involved in attention and decision making (Farzin & Norcia, Reference Farzin and Norcia2011), where they may be amplified.
Over the last 35 years or so, there has been substantial progress in revealing and characterizing the many interesting and sometimes mysterious sensory abnormalities that accompany amblyopia. A goal of many of the studies has been to try to make the link between the sensory losses and the underlying neural losses, resulting in several hypotheses about the site, nature, and cause of amblyopia. This article reviews some of these hypotheses, and the assumptions that link the sensory losses to specific physiological alterations in the brain.
Reduced resolution and sensitivity of neurons in the geniculo-striate pathway
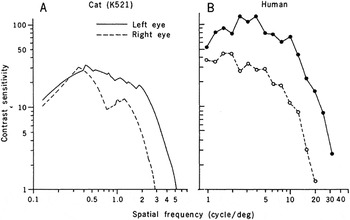
One of the defining features of amblyopic vision is reduced resolution and contrast sensitivity, particularly at high spatial frequencies (Hess & Howell, Reference Hess and Howell1977; Levi & Harwerth, Reference Levi and Harwerth1977; Bradley & Freeman, Reference Bradley and Freeman1981). A very attractive early hypothesis was that the sensory loss of contrast sensitivity simply reflects a loss of contrast sensitivity of neurons early in the geniculo-striate pathway. Indeed, in humans with amblyopia, cortical evoked potentials show reduced amplitudes and longer latencies to gratings at high spatial frequencies (Levi & Harwerth, Reference Levi and Harwerth1978). Importantly, Eggers and Blakemore (Reference Eggers and Blakemore1978) showed that in kittens reared with one eye defocused, neurons in striate cortex driven by the defocused eye have reduced resolution and contrast sensitivity. By plotting the envelope of the sensitivities of all the neurons, they derived “contrast sensitivity functions” for each eye. Like humans with anisometropic amblyopia (Hess & Howell, Reference Hess and Howell1977; Levi & Harwerth, Reference Levi and Harwerth1977; Bradley & Freeman, Reference Bradley and Freeman1981), kittens reared with monocular defocus during the sensitive period show reduced contrast sensitivity at high spatial frequencies and reduced resolution in their defocused eye (Fig. 1).
From Eggers and Blakemore (Reference Eggers and Blakemore1978). Left panel: Neural contrast sensitivity function (i.e., upper envelope of the contrast sensitivity of neurons in striate cortex) of each eye of a kitten reared with the right eye defocussed. Right panel, contrast sensitivity function of a human with anisometropic amblyopia.

Because the physiological data (in cats) and the sensory data (in humans) appear similar, Eggers and Blakemore suggested that “ . . . changes at or before the level of the visual cortex account at least in part for the loss of visual acuity in human anisometropic amblyopia” and by analogy, one early hypothesis was that the sensory loss is a result of the reduced resolution and contrast sensitivity of neurons in V1 (striate cortex) or even earlier (Ikeda & Wright, Reference Ikeda and Wright1976; Ikeda & Tremain, Reference Ikeda and Tremain1978).Footnote 1
The linking proposition (Teller, Reference Teller1984) is that human contrast sensitivity depends on the responses of cortical neurons, and that human contrast sensitivity, like the contrast sensitivity of neurons in the cortex of kittens, will be reduced when cortical (or earlier) neurons are deprived of clear retinal imagery early in life. Does the analogy hold up? To quote Teller “Leaving aside the standard problems of anesthesia and cross-species generalizations, such a proposition seems eminently testable.”
For the moment we will leave aside the question of whether cats are a good animal model for human amblyopia, whether the loss of contrast sensitivity actually fully explains all the many visual deficits associated with amblyopia (or even anisometropic amblyopia), or whether they reflect losses in suprathreshold contrast perception (see Hess & Bradley, Reference Hess and Bradley1980; Hess et al., Reference Hess, Bradley and Piotrowski1983; Loshin & Levi, Reference Loshin and Levi1983). Rather we will focus on the simpler question of whether this sort of linking by analogy can even provide a solid explanation for the loss of contrast sensitivity in anisometropic amblyopia.
Eggers and Blakemore measured the contrast sensitivity of neurons in kitten striate cortex by having gratings (optimized in orientation and speed) drifting across the neurons receptive field. For each spatial frequency, “the experimenter adjusted the contrast of the grating and pressed a button when he judged by ear that the cell was just responding with either a modulated firing pattern, in time with the bars of the grating, or with an unmodulated increase in activity.” The contrast sensitivity functions of the amblyopic kitten, shown in Fig. 1, represent the envelope of all the individual neurons’ contrast sensitivity functions. Eggers and Blakemore suggest that although these curves do not necessarily reflect the absolute level of neuronal sensitivity, they can be used to compare sensitivity in the two eyes.
As noted by Eggers and Blakemore, the exact sensitivities that they recorded may have been limited by the criteria used by the experimenters to judge the response threshold or even by the quality of their audio equipment. However, there are a number of other important issues in making the link between the responses of cortical neurons and the behavioral sensitivity. One issue is sampling biases. Eggers and Blakemore recorded from 228 neurons in or near the area centralis projection of primary visual cortex. However, there are estimated to be more than 80,000 neurons under each millimeter squared of cat striate cortex (Peters & Yilmaz, Reference Peters and Yilmaz1993). These reside in different layers, and constitute different cell types. Moreover, the microelectrodes used may not have been sensitive to neurons representing the smallest receptive fields or to those that respond only weakly. Additionally, it is far from clear that the most sensitive neuron (the upper envelope) determines behavioral sensitivity. More recent work relating behavioral and neural responses suggests that it is not only just the sensitivity of individual neurons but also the amount of noise correlation between sensory neurons, the amount of neural noise introduced at the pooling and decision stages, and the number of neurons that contribute to the decision pool (e.g., Shadlen et al., Reference Shadlen, Britten, Newsome and Movshon1996; Cohen & Newsome, Reference Cohen and Newsome2009).
Although there is a clear similarity between the loss of sensitivity and the resolution in cortical neurons of kittens reared with monocular blur and humans with anisometropic amblyopia, it is not clear that this provides an explanation for the behavioral losses in humans with amblyopia.
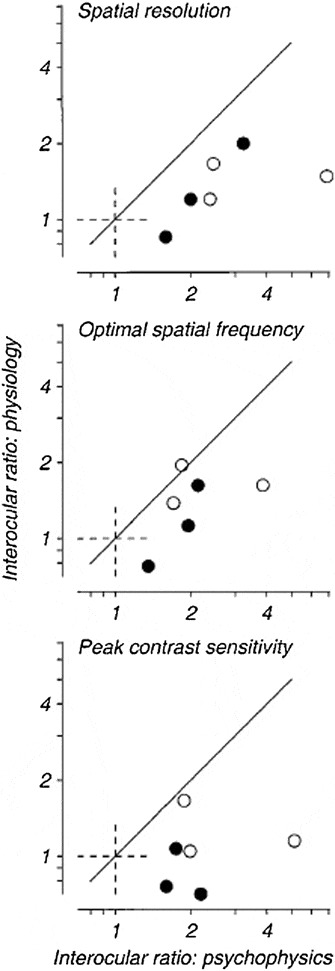
Cohen and Newsome (Reference Cohen and Newsome2009) suggest that the relationship between behavioral and neural sensitivities may depend on the task, and that a full account of the neural mechanisms underlying psychophysical performance will require “simultaneous recordings from multiple neurons and measurements of neural sensitivity on the timescale of behavior.” This has not yet been done in animal models of amblyopia. Moreover, given the absence of a fovea, and the poor spatial resolution of the cat, the macaque visual system is, in many respects, a better model for human vision (Harwerth & Smith, Reference Harwerth and Smith1985). In an attempt to understand the neural basis of the loss of contrast sensitivity in a primate model, Kiorpes et al. (Reference Kiorpes, Kiper, O’Keefe, Cavanaugh and Movshon1998) made behavioral measurements of contrast sensitivity and quantitative physiological measurements of the response properties of neurons in cortical area V1 of monkeys that were reared with experimentally induced strabismus or anisometropia. In order to side-step some of the difficulties noted above, they compared the interocular differences in spatial frequency tuning and contrast sensitivity determined physiologically with that measured behaviorally in the same animals. Fig. 2, from that study, shows that physiological estimates of the loss of spatial resolution, peak spatial frequency, and contrast sensitivity underestimate the behavioral losses in the same animals.
Interocular differences (ratios) in spatial resolution, optimal spatial frequency, and peak contrast sensitivity determined physiologically (ordinate) versus that measured behaviorally (abscissa) in the same animals. From Kiorpes et al. (Reference Kiorpes, Kiper, O’Keefe, Cavanaugh and Movshon1998).

These results shed some light on the cause of the amblyopic deficit in contrast sensitivity but do not provide the full explanation. They show that monkeys reared with “amblyogenic” factors (strabismus or monocular blur) indeed show neural deficits in V1. These deficits include reduced cortical binocularity, a reduced proportion of neurons that can be stimulated through the amblyopic eye, reduced neural contrast sensitivity, and lower spatial resolution. If the loss of spatial resolution and contrast sensitivity were solely determined by the responses of neurons in striate cortex, the physiological losses should be equal to the behavioral losses. Clearly, this is not the case. Indeed, Kiorpes et al. note that in several of the severely amblyopic animals, cortical neurons driven through the amblyopic eye responded to spatial frequencies that the animals could not see! Thus, the physiological changes in area V1 provide, at best, only a partial explanation for the behavioral loss of contrast sensitivity. A more recent study (Bi et al., Reference Bi, Zhang, Tao, Harwerth, Smith and Chino2011) found no difference in the spatial resolution or optimal spatial frequency of V1 neurons in monkeys with strabismic amblyopia. Below we explore several alternative explanations and their linking hypotheses.
Abnormalities in the tuning properties of receptive fields in V1
One possible explanation for the reduced behavioral performance is that the tuning properties of V1 neurons are altered by early strabismus or monocular image blur. As noted above, monkeys with strabismic amblyopia show similar population spatial resolution and optimal spatial frequencies in the two eyes (Bi et al., Reference Bi, Zhang, Tao, Harwerth, Smith and Chino2011), although there are clear examples where the tuning of individual neurons differs when tested through the two eyes (e.g., Kiorpes et al., Fig. 5B). Bi et al. also found no alterations in orientation tuning (bias or bandwidth) in V1 neurons through the amblyopic eye. These results are in accord with studies in humans using adaptation (Hess, Reference Hess1980; Rentschler et al., Reference Shadlen, Britten, Newsome and Movshon1980) or masking (Levi et al., Reference Levi, Harwerth and Smith1979; Levi & Harwerth, Reference Levi and Harwerth1982) to assess the tuning of channels thought to reflect the properties of neurons in V1 (Graham, Reference Graham1989).
One form of “tuning” that has not been explored in detail is contrast tuning. Fig. 5D of Kiorpes et al. shows an example of the contrast response of a neuron to a grating of optimal spatial frequency and orientation. The results show that the response through the amblyopic eye has a much lower gain than through the nonamblyopic eye. It is not clear whether this result is broadly representative; however, the reduced gain is consistent with evoked potential studies in humans (Levi & Harwerth, Reference Levi and Harwerth1978), and it introduces an interesting mystery. Psychophysical studies of contrast perception suggest that if anything, amblyopic eyes have a higher contrast gain, so that suprathreshold contrast perception is normal, or nearly so (Hess & Bradley, Reference Hess, Bradley and Piotrowski1980; Hess et al., Reference Hess, Bradley and Piotrowski1983; Loshin & Levi, Reference Loshin and Levi1983), and suprathreshold contrast discrimination is similar in the two eyes when scaled by the contrast detection threshold (Hess et al., Reference Hess, Bradley and Piotrowski1983; Levi et al., Reference Levi, Klein and Wang1994a). It is not clear that one could easily come up with simple a linking hypothesis to connect the reduced contrast gain in individual V1 neurons, with the increased gain in contrast perception. One possibility is that neurons in early cortex have reduced gain, and that the “catch up” occurs downstream in order to preserve veridical contrast perception.
Reduced number of responsive neurons in V1 (“undersampling”)
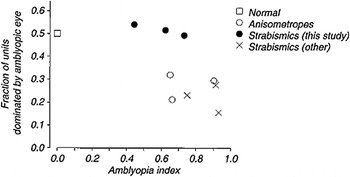
Another long-standing notion is that there is a reduced representation of the amblyopic eye in V1. For example, early studies by Hubel and Wiesel showed that following lid suture early in life, very few V1 neurons could be driven through the deprived eye (Hubel & Wiesel, Reference Hubel and Wiesel1965; Hubel et al., Reference Hubel, Wiesel and LeVay1977). A common linking proposition has been that the reduced behavioral performance of the amblyopia is due to the reduced neural representation—that is “undersampling” in V1. However, whether the loss of neural representation in V1 in the more common (and less severe) amblyopes associated with strabismus or anisometropia, is sufficient to explain the behavioral deficits, is not so clear. Kiorpes et al. (Reference Kiorpes, Kiper, O’Keefe, Cavanaugh and Movshon1998) reported that both strabismic and anisometropic monkeys showed fewer binocularly activated neurons and fewer neurons driven through the amblyopic eye. However, as seen in Fig. 3, the relationship between the fraction of V1 neurons driven by the amblyopic eye, and the behavioral loss of contrast sensitivity (as captured by the “amblyopia index”) is not straightforward. Although the most severely amblyopic monkeys show the greatest behavioral loss, in three moderately amblyopic strabismic monkeys the amblyopic eye dominated a “normal” fraction of V1 neurons.
The relationship between the fraction of V1 neurons, driven by the amblyopic eye, versus the behavioral loss of contrast sensitivity (as captured by the “amblyopia index”) in normal monkeys and those with anisometropic and strabismic amblyopia. From Kiorpes et al. (Reference Kiorpes, Kiper, O’Keefe, Cavanaugh and Movshon1998).

A variant of the undersampling explanation given above is that there is a selective loss of small (high spatial frequency) receptive fields, so that there is an underrepresentation of fine details in the central fovea. There is circumstantial evidence for undersampling in humans with strabismic amblyopia, based on spatial aliasing (Sharma et al., Reference Sharma, Levi and Coletta1999). Aliasing is a consequence of undersampling in which the sampled image contains spurious components that are not present in the original image. For example, when viewing interference fringes that are finer than the foveal cone mosaic, normal observers perceive moire patterns that look like wavy lines that are coarser than the stimulus and contain different orientations. Strabismic amblyopes can detect gratings at much higher spatial frequencies than they can resolve them. Importantly, they sometimes misperceive grating orientation well below the cone-sampling limit.
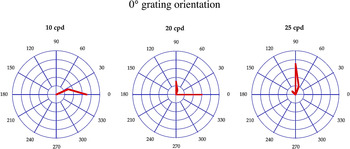
Fig. 4 (from the study by Sharma et al., Reference Sharma, Levi and Coletta1999) shows the misperception of orientation by a strabismic amblyope. The target was a very high-contrast grating horizontal imaged on the fovea using a laser interferometer. At low spatial frequencies (e.g., 10 c/°), the perceived orientation was veridical—that is, the horizontal grating appeared to be horizontal (shown by the red line in the left panel of Fig. 4). At 20 c/°, the grating appeared ambiguous, sometimes horizontal, other times vertical. Interestingly, at 25 c/°, it appeared consistently to be vertical—that is, orthogonal to the actual orientation. This nonveridical orientation perception is consistent with aliasing but occurs at spatial frequencies well below the cone-sampling limit (≈ 120 c/°), suggesting undersampling beyond the retina. However, there is no direct evidence to link this misperception to undersampling in V1.
Perceived orientation of horizontal interference fringes (red line) at different spatial frequencies in the central field of a strabismic amblyope. After Sharma et al. (Reference Sharma, Levi and Coletta1999).

Uncalibrated topographical disorder/wiring scatter in V1
An alternative explanation for misperceptions in amblyopic vision is uncalibrated topographical disorder or wiring scatter. In normal foveal vision, visual space is accurately mapped from retina to cortex. The precise topographical mapping provides a veridical representation of the world and enables the visual system to maintain very precise spatial order. Thus, in normal foveal vision, we are able to judge the locations of objects with great precision when a reference is nearby. However, both the normal periphery and the central field of strabismic amblyopes have elevated position discrimination thresholds. This poor positional discrimination has often been ascribed to increased “intrinsic” spatial disorder—that is, topographical disorder in the positions of cortical receptive fields, that is uncalibrated (Hess et al., Reference Hess, Campbell and Greenhalgh1978; Levi & Klein, Reference Levi and Klein1985; Watt & Hess, Reference Watt and Hess1987; Wilson, 1991; Hess & Field, Reference Hess and Field1994; Field & Hess, Reference Field and Hess1996; Wang et al., Reference Wang, Levi and Klein1998).
There are several lines of circumstantial evidence for raised intrinsic spatial disorder. One of the earliest was based on the distorted appearance of letters (Pugh, 1958), gratings (Hess et al., Reference Hess, Campbell and Greenhalgh1978; Barrett et al., Reference Barrett, Pacey, Bradley, Thibos and Morrill2003), and sampled shapes (Lagreze & Sireteanu, Reference Lagreze and Sireteanu1992; Sireteanu et al., Reference Sireteanu, Lagreze and Constantinescu1993; Levi et al., 2005b).
A second line of evidence comes from equivalent noise (or perturbation) studies (discussed more fully below) that suggest that amblyopic eyes have increased internal positional noise and hence increased topographical disorder (Wang et al., Reference Wang, Levi and Klein1998; Levi et al., Reference Levi, Klein, Sharma and Nguyen2000). Adding external position noise to the nonamblyopic eye mimics the amblyopic eye’s performance on a task involving path detection (i.e., finding a path defined by Gabor orientation among distracters). Hess and colleagues argued that the amblyopic eye’s performance is limited by the intrinsic topographical disorder of cortical receptive fields, which is not calibrated, and that this disorder can be so extreme that it can actually exceed the receptive field size (Hess & Field, Reference Hess and Field1994; Field & Hess, Reference Field and Hess1996; but see also Levi & Klein, Reference Levi and Klein1996). Further, Hess and his colleagues (Hess & Holliday, Reference Hess and Holliday1992; Demanins & Hess, Reference Demanins and Hess1998; Hess et al., Reference Hess, Wang, Demanins, Wilkinson and Wilson1999) have argued that the positional deficit is “scale invariant,” suggesting that the cortical topology is disrupted similarly over a wide range of spatially scaled neural maps.
This model predicts no difference between discrimination and conjunction thresholds because it only perturbs the spatial location of objects within a single feature map; however, Neri and Levi (Reference Neri and Levi2006) found that spatial resolution for discriminating targets that differed from nearby distractors in the conjunction of two features (color and orientation) is much poorer than resolution for discriminating targets that differed from nearby distractors in their features (colors or orientation) alone. To explain this result, Neri and Levi suggested a different form of topographical jitter. Specifically, they suggested that color and orientation are unbound in separate maps and their spatial binding is perturbed by misregistration of the two maps.
Thus, although there is behavioral evidence consistent with uncalibrated topographical disorder, it is not clear that it can simply explain the behavioral abnormalities in amblyopic vision, and there is little if any anatomical/physiological evidence to support it (Levi & Klein, Reference Levi and Klein1996). Indeed, as discussed below, neither undersampling nor uncalibrated topographical disorder alone can explain the losses in Levi et al. (Reference Levi, Klein and Wang1994b).
Noisy neurons in V1
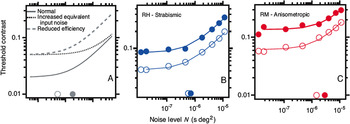
Another long-standing notion is that amblyopic contrast sensitivity might be limited by neural noise (variability), possibly in V1 neurons. One behavioral approach to estimating neural noise is by measuring detection thresholds on a noisy background. This allows one to parse the elevation in thresholds in the amblyopic visual system into two components: increased internal noise (discussed above) and reduced sampling efficiency, that is, less efficient use of the stimulus information. This approach is illustrated schematically in Fig. 5 (left panel–from Pelli et al., Reference Pelli, Levi and Chung2004), which shows how threshold contrast for letter identification depends on the amount of added luminance noise. The solid gray line represents a nonamblyopic eye. When the background noise is less than the observer’s internal noise level, it has no effect on threshold (which is limited by the observer’s internal noise). However, once the background noise level is higher than the observer’s internal noise, threshold contrast increases in proportion to the square root of the background noise. By applying the linear amplifier model, one can estimate the observer’s equivalent internal noise—that is, the amount of noise on the screen that would account for the observer’s threshold on a blank screen (Barlow, Reference Barlow1957; Pelli & Farell, Reference Pelli and Farell1999; Pelli et al., Reference Pelli, Levi and Chung2004). The dotted line illustrates the effect of increased equivalent noise, which results in a shift to the right of the kink in the curve. The dashed curve illustrates reduced efficiency—the entire curve is simply shifted up. The other panels of Fig. 5 show data of two amblyopes. Both show reduced efficiency, with either a small (right panel) or no (center panel) increase in equivalent input noise. Applying five levels of analysis, Pelli et al. concluded that cortical noise is roughly 1.4 times normal, as though only 1/1.4 the normal number of cortical spikes are devoted to the amblyopic eye. This would only account for a negligible (≈ 20%) elevation in contrast thresholds.
Effects of noise and amblyopia. Threshold contrast for letter identification as a function of noise level. (A) The solid gray line represents normal threshold. When the noise level is less than (to the left of) the equivalent noise (open gray circle), it has little effect on threshold; when the noise exceeds the equivalent noise, threshold contrast increases in proportion to the square root of noise level. The dashed line has reduced efficiency, and the dotted line has increased equivalent noise (solid circle on the horizontal axis). Threshold versus noise for a strabismic (B) and an anisometropic (C) amblyope. Open symbols are the nonamblyopic eyes and solid symbols are the amblyopic eyes. Both amblyopes show a marked loss of efficiency (vertical shift), accompanied by little (C) or no (B) increase in equivalent noise (diagonal shift). From Pelli et al. (Reference Pelli, Levi and Chung2004).

One limitation of the equivalent noise approach is that increased multiplicative noise cannot be easily distinguished from reduced efficiency. A direct estimate of internal noise can be obtained using an “N-pass” approach in which the observer takes several passes through the identical stimuli and noise (Green, Reference Green1964; Burgess & Colborne, Reference Burgess and Colborne1988; Gold et al., Reference Gold, Bennett and Sekuler1999; Levi & Klein, Reference Levi and Klein2003; Levi et al., Reference Levi, Klein and Chen2005a, Reference Levi, Klein and Chen2007a, Reference Levi, Klein and Chen2008; Li et al., Reference Li, Klein and Levi2008). This enables one to measure response consistency, and since the stimuli and noise samples are identical in each pass, one can determine the ratio of random to total noise (sometimes referred to as the ratio of internal to external noise). We will return to the question of noise below.
Abnormalities beyond the contrast sensitivity function (CSF) and perhaps beyond V1
Humans with amblyopia have a broad range of well-documented abnormalities that go beyond contrast sensitivity and are often said to reflect “higher level” deficits. These include deficits in positional acuity (Levi & Klein, Reference Levi and Klein1982a,Reference Levi and Kleinb, Reference Levi and Klein1983, Reference Levi and Klein1985; Hess & Holliday, Reference Hess and Holliday1992); detection of second-order texture (Wong et al., Reference Wong, Levi and McGraw2001) and motion (Simmers et al., Reference Simmers, Ledgeway, Hess and McGraw2003); deficits in optic flow (Mansouri et al., Reference Mansouri, Allen and Hess2005; Aaen-Stockdale et al., Reference Aaen-Stockdale, Ledgeway and Hess2007), and feature integration (Mussap & Levi, Reference Mussap and Levi2000; Popple & Levi, Reference Popple and Levi2000; Chandna et al., Reference Chandna, Pennefather, Kovacs and Norcia2001; Simmers & Bex, Reference Simmers and Bex2004). They show abnormalities in global shape (Hess et al., Reference Hess, Wang, Demanins, Wilkinson and Wilson1999; Dallala et al., Reference Dallala, Wang and Hess2010), global motion perception (Simmers et al., Reference Simmers, Ledgeway, Hess and McGraw2003; Aaen-Stockdale & Hess, Reference Aaen-Stockdale and Hess2008), and in multiple object tracking deficits (Ho et al., Reference Ho, Paul, Asirvatham, Cavanagh, Cline and Giaschi2006; Levi & Tripathy, Reference Levi and Tripathy2006; Tripathy & Levi, Reference Tripathy and Levi2008). Strabismic amblyopes undercount features and missing features (Sharma et al., Reference Sharma, Levi and Klein2000), and they show abnormalities in attentional (Popple & Levi, Reference Popple and Levi2008) and decision processes (Farzin & Norcia, Reference Farzin and Norcia2011). Many of these deficits have been attributed to cortical areas downstream of V1, including parietal and frontal areas (Sharma et al., Reference Sharma, Levi and Klein2000; Farzin & Norcia, Reference Farzin and Norcia2011). In addition, using the N-pass methods described above, amblyopes manifest increased cortical noise (Levi & Klein, Reference Levi and Klein2003; Levi et al., Reference Levi, Klein and Chen2008; Li et al., Reference Li, Klein and Levi2008), possibly beyond V1.
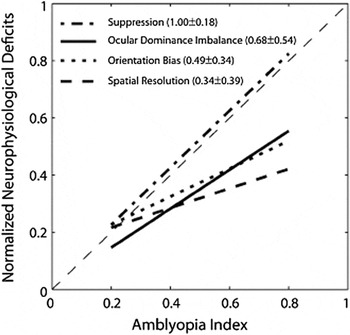
There is also evidence for neural abnormalities beyond V1. For example, Bi et al. (Reference Bi, Zhang, Tao, Harwerth, Smith and Chino2011) showed that the spatial resolution and the orientation bias of V2, but not V1, neurons was abnormal, and that binocular suppression was robust in both cortical areas. As shown in Fig. 6, they found that the magnitude of suppression in V2 neurons was highly correlated with the depth of amblyopia, as measured behaviorally. Similarly, El-Shamayleh et al. (Reference El-Shamayleh, Kiorpes, Kohn and Movshon2010) have shown that most neurons in Middle Temporal (MT) cortex of amblyopic monkeys strongly preferred stimulation of the nonamblyopic (fellow) eye, and that the pooled responses of neurons driven by the amblyopic eye showed reduced sensitivity to coherent motion and preferred higher speeds, in agreement with behavioral measurements. Interestingly, this is perhaps the only published study that has reported the variability of cortical neurons by computing the Fano factor (the ratio of the variance to the mean firing rate) for neurons in MT. Their results show that amblyopic MT neurons were, on average, more variable (for both eyes) than those of normal animals. It would be interesting to compare this physiological measure of neural noise with behavioral measures.
Comparisons of the relative magnitude of V2 deficits with the depth of amblyopia (AI). The proportions of binocularly suppressive unit, the ocular dominance imbalance (ROII), the average spatial resolution, and the average orientation bias of V2 neurons in individual monkeys were first normalized to the respective maximum value and then were fit to obtain a regression line for each V2 deficit. From Bi et al. (Reference Bi, Zhang, Tao, Harwerth, Smith and Chino2011).

Imaging studies in humans with amblyopia are consistent with the deficits at many stages, from Lateral Geniculate Nucleus (LGN) (Hess et al., Reference Hess, Thompson, Gole and Mullen2009) to high-order cortical regions (Imamura et al., Reference Imamura, Richter, Fischer, Lennerstrand, Franzen, Rydberg, Andersson, Schneider, Onoe, Watanabe and Langstrom1997; Goodyear et al., Reference Goodyear, Nicolle, Humphrey and Menon2000; Barnes et al., Reference Barnes, Hess, Dumoulin, Achtman and Pike2001; Lerner et al., 2003; Muckli et al., Reference Muckli, Kiess, Tonhausen, Singer, Goebel and Sireteanu2006; Lerner et al., 2006). A still not fully answered question is whether the higher-level deficits evident in fMRI, are simply a reflection of earlier losses, or whether the early deficits are amplified beyond V1.
Computational approaches
The equivalent noise model (described above) treats the visual system as a black box. To open up the black box and look inside, we need a more detailed model that assumes multiple sources of noise that degrade human performance–an imperfect decision template, consistent noise (due to higher order nonlinearities) that results in consistent errors (identical responses on repeated trials), and random noise—and sensitive methods to measure the observer’s template and internal noise. For both contrast detection (Levi et al., Reference Levi, Klein and Chen2008) and position discrimination (Li et al., Reference Li, Klein and Levi2008), humans with amblyopia show a poorly matched decision template and increased random internal noise with their amblyopic eyes.
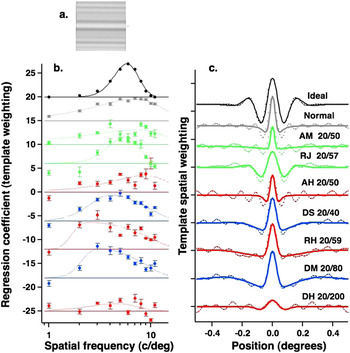
Classification images provide an estimate of an observer’s decision template (Gold et al., Reference Gold, Murray, Bennett and Sekuler2000; Neri & Levi, Reference Neri and Levi2006). To the extent that performance in noise is similar to performance without noise, classification images can provide important insights into the mechanisms and strategies that an observer uses to detect or discriminate a target. Fig. 7 (from Levi et al.,) shows the templates, derived from classification images for detecting a Discrete Frequency Pattern (DFP—a windowed sum of sinusoids) in noise (Fig. 7a). By reverse correlating the observer’s response on each trial with the noise, one can measure an observer’s template for the task (i.e., how they weighted each of the components of the target). The top curves show the template of the “ideal” observer, which are perfectly matched to the stimulus (Fig. 7b, in frequency, Fig. 7c in space). The second row shows the mean template of normal observers, whereas the lower rows show the templates of seven amblyopic observers. Note that the more severe amblyopes [(e.g., DM and DH) do show a shift in the peak of the spatial frequency tuning towards lower spatial frequencies (Levi et al., Reference Levi, Waugh and Beard1994c). The amblyopes’ detection templates are somewhat broader in space than those of the normal observers, corresponding to the shift in spatial frequency tuning towards lower spatial frequencies (Levi et al., Reference Levi, Waugh and Beard1994c). Interestingly, the amblyope with the most reduced efficiency (DH) shows a very poorly defined template with essentially no spatial frequency tuning. However, the poorly matched templates of the amblyopic observers do not come close to accounting for their loss of efficiency (Fig. 8).
(a) Classification coefficients for detection. The regression coefficients (symbols) are plotted as a function of spatial frequency for each of the amblyopic eyes and averaged across the dominant eyes of three normal observers. (b) Classification images for detection. The dotted lines are the raw classification images for each of the amblyopic eyes and the average across the dominant eyes of three normal observers. The solid curves are the Fourier transforms of the curves fit to the regression coefficients in the left panel, assuming all frequency components are in cosine phase. The top curves in both panels are the ideal observer. The classification coefficients and images have been vertically offset from one another for clarity. From Levi et al. (Reference Levi, Klein and Chen2008).

Visual performance (both psychophysical and neuronal) is also limited by noise or variability (Parker & Newsome, Reference Parker and Newsome1998). To quantify this behaviorally, one can use an “N-pass” approach in which the observer takes several passes through the identical stimuli and noise (Green, Reference Green1964; Burgess & Colborne, Reference Burgess and Colborne1988; Gold et al., Reference Gold, Bennett and Sekuler1999; Levi & Klein, Reference Levi and Klein2003; Levi et al., Reference Levi, Klein and Chen2005a, Reference Levi, Klein and Chen2007a, Reference Levi, Klein and Chen2008). This enables us to measure response consistency, and since the stimuli and noise samples are identical in each pass, we are able to determine the ratio of random to consistent noise (sometimes referred to as the ratio of internal to external noise by other authors) at different levels of external noise. In addition to a mismatched template, consistent noise may arise through a variety of sources. For example, applying a point-wise nonlinearity to an image prior to using a linear template would result in a distortion, which would result in the observer making consistent errors.
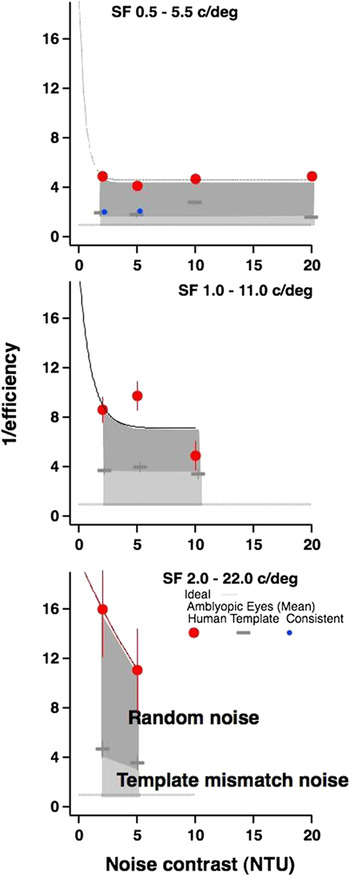
Fig. 8 shows the mean data of the normal controls and of the amblyopic eyes plotted as the inverse of efficiency (i.e., human or template observer thresholds divided by the ideal observer threshold) versus noise contrast. There are several points worth noting: (i) on average, the amblyopic loss increases with spatial frequency, (ii) both the increase in template mismatch noise (light gray zones) and the loss due to random internal noise (dark gray zones) vary remarkably little across external noise levels (NTU), (iii) consistent internal noise beyond the template mismatch (small blue symbols) plays little or no significant role in limiting performance in either normal or amblyopic vision, (iv) human performance changes dramatically between 0 and 2 NTU, and remarkably little from 2 to 20 NTU, and (v) the template-mismatch noise of the amblyopic eye increases substantially as spatial frequency increases.
Mean inverse efficiency of the amblyopic eyes. In each panel, the ideal observer is shown by the thick dotted gray line at 1. Human inverse efficiency is shown by the large symbols, and template inverse efficiency is shown by the gray bars. Consistent internal noise beyond the template mismatch noise is shown by the small blue dots and is not a significant factor in limiting performance. From Levi et al. (Reference Levi, Klein and Chen2008).

Interestingly, applying a similar approach to position discrimination shows random noise is larger for position discrimination than for detection (Levi et al., Reference Levi, Klein and Chen2008), as would be predicted by a noisy template model (McIlhagga & Paakkonen, Reference McIlhagga and Paakkonen1999—discussed below).
One of the earliest explanations for the losses seen in humans with amblyopia is the loss of contrast sensitivity at high spatial frequencies, consistent with the loss of contrast sensitivity of small (high spatial frequency) receptive fields in striate cortex of cats (Eggers & Blakemore, Reference Eggers and Blakemore1978) and V1 in monkeys (Kiorpes et al., Reference Kiorpes, Kiper, O’Keefe, Cavanaugh and Movshon1998; Kiorpes & McKee, 2006; Bi et al., Reference Bi, Zhang, Tao, Harwerth, Smith and Chino2011) with experimental amblyopia. This explanation is consistent with a coarse (low spatial frequency) template for detection (Levi et al., Reference Levi, Klein and Chen2008). However, the loss of neural contrast sensitivity is too small to fully account for the behavioral losses of contrast sensitivity in monkeys with amblyopia and cannot fully explain the loss of position acuity in humans with strabismic amblyopia (Levi et al., Reference Levi, Yu, Kuai and Rislove1994c). To account for this “additional” loss, two other explanations have been suggested: (1) cortical undersampling (i.e., a reduced complement of cortical neurons—Levi & Klein, Reference Levi and Klein1986) and (2) uncalibrated topographical jitter (i.e., mis-wiring of cortical neurons—Hess, Reference Hess1982; Field & Hess, Reference Field and Hess1996). There has been considerable debate surrounding undersampling versus jitter (Field & Hess, Reference Field and Hess1996; Levi & Klein, Reference Levi and Klein1996 and see Kiorpes & McKee, Reference Kiorpes and McKee1999 for a review).
Our finding of increased random internal noise offers a different account. If the information that V1 neurons of the amblyopic cortex transmits to higher levels is subject to random noise, from trial to trial different samples of the target will be more or less effective. On one trial, one set of neurons might provide reliable signals, whereas on the next trial, a different set of neurons might provide reliable signals from the same target. The net effect would be equivalent to combining undersampling with positional jitter. Indeed, in earlier work (Levi et al., Reference Levi, Klein and Wang1994b), we showed that strabismic amblyopes show a uniform loss of Vernier acuity over the entire range of target contrasts (a multiplicative loss). The only stimulus manipulation that produced this pattern in normal observers consisted of undersampling the target combined with random positioning of the samples from trial-to-trial. Undersampling the stimulus in a regular predictable way does not mimic the multiplicative pattern of loss, and we suggested that strabismic amblyopia may involve elevated levels of central noise. Thus, the effect of amblyopia may be a combination of early noise (which affects detection of both noise and signal) and late noise due to a template mismatch and random noise. This late noise may help to explain why the behavioral losses of contrast sensitivity are greater than the neural losses in V1 (Kiorpes, Reference Kiorpes2006).
We do not yet understand the origin of the high fraction of random noise in the amblyopic visual system. It is not clear whether this would be reflected in the Fano factor of neurons in the cortical hierarchy or whether it might be a consequence of a variable or noisy decision template (McIlhagga & Paakkonen, Reference McIlhagga and Paakkonen1999; Levi & Klein, Reference Levi and Klein2003). Noisy templates can be achieved in a variety of ways, for example, by including randomly selected, but irrelevant, neurons in the decision pool (Shadlen et al., Reference Shadlen, Britten, Newsome and Movshon1996) or by uncertainty (Pelli, Reference Pelli and Blakemore1990) in which a multiplicity of mechanisms (e.g., shifted templates) are monitored. A multiplicity of shifted templates would lead to a broader template, particularly at high spatial frequencies and would degrade position discrimination more than detection (Levi et al., Reference Levi, Klein and Chen2008) and, importantly, would lead to an increase in random internal noise. We note that both strabismic and ansiometropic amblyopes show high random noise when viewing with both the amblyopic and preferred eyes (Levi et al., Reference Levi, Klein and Chen2008), suggesting that this elevated random noise is central and is likely related to the absence of correlated binocular visual experience early in life (Kind et al., Reference Kind, Mitchell, Ahmed, Blakemore, Bonhoeffer and Sengpiel2002; McKee et al., Reference Pelli and Blakemore2003). Indeed, Bi et al. (Reference Bi, Zhang, Tao, Harwerth, Smith and Chino2011) found that binocular suppression in area V2 was proportional to the depth of amblyopia.
Summary and conclusions
A long-standing goal of research on amblyopia and other sensory disorders has been to try to attribute the sensory losses to specific underlying neural losses. The focus of this article was on the well-documented and much studied loss of contrast sensitivity in humans and animals with amblyopia—which has been considered to reflect neural losses in early visual cortex. Despite 35 years of intensive study, it turns out to be quite difficult to make a simple linking hypothesis, at least at the level of single neurons, and the locus of the sensory loss remains elusive. It is now clear that the simplest notion—that reduced contrast sensitivity of neurons in cortical area V1 explain the reduction in contrast sensitivity—is too simplistic. Considerations of noise, noise correlations, pooling, and the weighting of information also play a critically important role in making perceptual decisions, and our current models of amblyopia do not adequately take these into account. Indeed, although the reduction of contrast sensitivity is generally considered to reflect “early” neural changes, it seems plausible that it reflects changes at many stages of visual processing. Interestingly, recent work suggests that it may be possible to recover at least some of these losses in humans with amblyopia through perceptual learning (prolonged practice of a challenging visual task–see Levi & Li, Reference Levi and Li2009; Astle et al., Reference Astle, Webb and McGraw2011; Levi, Reference Levi2012 for recent reviews), or video game play (Li et al., Reference Li, Ngo, Nguyen and Levi2011) well beyond the sensitive period. The improvements occur for a wide range of visual tasks, operate through more efficient use of the stimulus information (increased efficiency through template re-tuning), and reduced internal noise (Li & Levi, Reference Li and Levi2004; Li et al., Reference Li, Klein and Levi2008; Huang et al., Reference Huang, Lu and Zhou2009; Li et al., Reference Li, Ngo, Nguyen and Levi2011).
Acknowledgments
This project was supported by the grant R01EY01728 from the National Eye Institute, National Institutes of Health, Bethesda, MD.