I. INTRODUCTION
Alongside chemical composition and energy level structure, morphology plays a critical role in determining function in organic semiconducting systems. Reference Beiley, Hoke, Noriega, Dacuña, Burkhard, Bartelt, Salleo, Toney and McGehee1–Reference Ye, Zhao, Li, Mukherjee, Carpenter, Awartani, Jiao, Hou and Ade10 However, the complexity of material architecture, chemistry, and interactions among constituent materials used in organic electronics make it a challenging task to elucidate structure–property relationships. The fundamental understanding, improvement and utilization of these complex materials requires probing the physical and chemical characteristics at the molecular scale. Reference Collins, Gann, Guignard, He, McNeill and Ade11,Reference Treat and Chabinyc12 Among systems where morphology often plays a determining role, solution-processed bulk heterojunction (BHJ) organic photovoltaics (OSs) have attracted much attention and have exhibited great potential for making low-cost, large area, flexible solar panels through solution coating techniques. Reference Ro, Downing, Engmann, Herzing, DeLongchamp, Richter, Mukherjee, Ade, Abdelsamie, Jagadamma, Amassian, Liu and Yan13,Reference Ye, Xiong, Yao, Gadisa, Zhang, Li, Ghasemi, Balar, Hunt and O’Connor14 Small area cells with power conversion efficiency (PCE) above 11% Reference Li, Ye, Zhao, Zhang, Mukherjee, Ade and Hou15,Reference Zhao, Li, Yang, Jiang, Lin, Ade, Ma and Yan16 have been demonstrated and state-of-the-art printed large area semitransparent modules producing 4.5% PCE have been manufactured. Reference Berny, Blouin, Distler, Egelhaaf, Krompiec, Lohr, Lozman, Morse, Nanson and Pron17
The BHJ active layer in an organic photovoltaic device is typically composed of two organic compounds. For simplicity we will refer to them as an electron donor and an electron acceptor, but excitons can be generated in both materials (depending on their absorption spectra) and the electron acceptor can also contribute to solar cell current by donating holes to the electron donor (hole acceptor). Reference Brabec, Scherf and Dyakonov18 The performance of a BHJ solar cell is sensitive to the details of the morphology that include the size, shape, connectivity and composition of sub-100 nm domains and the orientation of electrically or optically anisotropic components. Reference Burke and McGehee2,Reference Bartelt, Beiley, Hoke, Mateker, Douglas, Collins, Tumbleston, Graham, Amassian, Ade, Fréchet, Toney and McGehee3,Reference O’Connor, Kline, Conrad, Richter, Gundlach, Toney and DeLongchamp19–Reference Giri, DeLongchamp, Reinspach, Fischer, Richter, Xu, Benight, Ayzner, He, Fang, Xue, Toney and Bao23 A key challenge for the organic photovoltaics community has been to develop measurements of these aspects of structure. Various techniques such as scanning probe microscopy, transmission electron microscopy (TEM), Reference Herzing, Richter and Anderson24–Reference Pfannmöller, Heidari, Nanson, Lozman, Chrapa, Offermans, Nisato and Bals26 X-ray microscopy, Reference Ade and Hitchcock27–Reference Buchaca-Domingo, Ferguson, Jamieson, McCarthy-Ward, Shoaee, Tumbleston, Reid, Yu, Madec, Pfannmöller, Hermerschmidt, Schröder, Watkins, Kopidakis, Portale, Amassian, Heeney, Ade, Rumbles, Durrant and Stingelin30 small-angle neutron scattering (both transmission, SANS Reference Yin and Dadmun31–Reference Chen, Peet, Hu, Azoulay, Bazan and Dadmun33 and grazing incidence small angle neutron scattering, GISANS Reference Ruderer, Meier, Porcar, Cubitt and Müller-Buschbaum34,Reference Guo, Cao, Wang, Moulin and Müller-Buschbaum35 ), grazing incidence diffraction (GIXD), Reference Müller-Buschbaum36–Reference DeLongchamp, Kline and Herzing38 and grazing incidence small angle X-ray scattering (GISAXS) Reference Müller-Buschbaum36,Reference Richter, DeLongchamp, Bokel, Engmann, Chou, Amassian, Schaible and Hexemer39,Reference Hexemer and Müller-Buschbaum40 have been used to study structure–property relationships in BHJ active layers.
To date, most structure–property relationships have been studied for BHJs composed of conjugated polymer or small molecule electron donors combined with a fullerene-based electron acceptor, most commonly [6,6]-phenyl-C61-butyric acid methyl ester (PC61BM) or [6,6]-phenyl-C71-butyric acid methyl ester (PC71BM). Polymer–fullerene BHJs have resulted in highly efficient BHJs with power conversion efficiencies exceeding 10%. Reference Zhao, Li, Yang, Jiang, Lin, Ade, Ma and Yan16,Reference Liu, Zhao, Li, Mu, Ma, Hu, Jiang, Lin, Ade and Yan41–Reference Zhang, Ye and Hou44 Importantly, the high mass density of the fullerenes (1.6 g/cm3) Reference Ro, Akgun, O’Connor, Hammond, Kline, Snyder, Satija, Ayzner, Toney, Soles and DeLongchamp45 provides significant contrast for most tools. The methods used to optimize the performance of polymer–fullerene BHJ solar cells have largely targeted the conjugated polymer electron donor material and include the control of the molecular weight, Reference Li, Yang, Tumbleston, Yan, Ade and You46 side-chain engineering, Reference Zhou, Kurosawa, Ma, Guo, Fang, Vandewal, Diao, Wang, Yan, Reinspach, Mei, Appleton, Koleilat, Gao, Mannsfeld, Salleo, Ade, Zhao and Bao47–Reference Yao, Ye, Zhang, Li, Zhang and Hou49 and fluorine substitution. Reference Stuart, Tumbleston, Zhou, Li, Liu, Ade and You50,Reference Xu and Yu51
Polymer Reference Kim, Kim, Kang, Lee, Kang, Shin, Wang, Ma, Jeong, Kim and Kim52–Reference Ye, Jiao, Zhang, Yao, Qin, Ade and Hou57 and non-fullerene small molecule (electron) acceptors (SMAs) Reference Qiu, Yang, Zhang, Wan, Li, Liu, Zhang, Russell and Chen58–Reference Zhao, Wu, Cai, Zheng, Chen, Lu and Yu64 have recently attracted much attention because of their easily tunable molecular energy levels, excellent optical absorption properties, and potentially lower-cost chemical synthesis compared to fullerenes. They also may offer more options in molecular design for optimizing the efficiency. Although their early performance was lacking compared to polymer–fullerene BHJs, polymer–SMA BHJs have recently been reported that equal the performance of polymer–fullerene BHJs with efficiencies above 11%. Reference Ye, Zhao, Li, Mukherjee, Carpenter, Awartani, Jiao, Hou and Ade10,Reference Li, Ye, Zhao, Zhang, Mukherjee, Ade and Hou15 However, little is known regarding structure–property relationships for these systems as opposed to their fullerene counterparts.
These promising new SMA-based BHJs present significant challenges in morphology characterization. Unlike fullerenes, SMAs typically have a mass or electron density that is very similar to most electron donors. Although methods that rely on mass/electron density variations (e.g., TEM, GIXD, GISAXS) and are routine for fullerene-based BHJ blends have been successfully applied to study a few all-conjugated all-polymer blends, Reference Meier, Ruderer, Diethert, Kaune, Körstgens, Roth and Müller-Buschbaum65,Reference Ruderer, Prams, Rawolle, Zhong, Perlich, Roth and Müller-Buschbaum66 it becomes more challenging in a number of fullerene-free systems due to low contrast; the electron acceptor-rich phases have few distinguishing features to isolate them from the electron donor-rich phases. The lower contrast cannot be compensated for by longer integration times, due to the limitations of radiation damage. Here we develop two, synergistic approaches to morphology characterization, low-angle annular dark field STEM (LAADF-STEM) and resonant soft X-ray scattering (R-SoXS) and compare their use in the study of a standard fullerene based BHJ and a difficult-to-characterize SMA BHJ system.
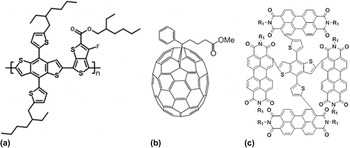
The two systems of study are high-performing BHJs based on the common polymer donor PTB7-Th and either PC71BM or the recently introduced SMA α-TPB, see Scheme 1 for structures.
Chemical structures of (a) PTB7-Th; (b) PC71BM; (c) α-TPB. α-TPB structure shown is not geometry optimized.

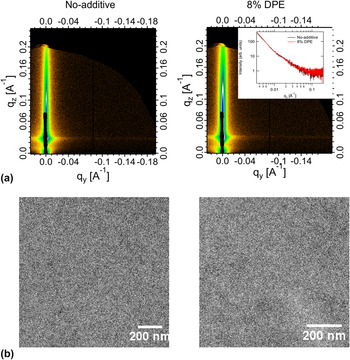
Both the PC71BM and α-TPB systems exhibit distinct process-performance variations, allowing clear tests of the utility of the measurement suite. For PTB7-Th/PC71BM, PCE of 10.3% (9.9% certified) has been demonstrated when processed from CB with 3% DIO additive. Reference He, Xiao, Liu, Wu, Yang, Xiao, Wang, Russell and Cao42 However, additive free processing results in PCE < 5%. Similarly, for PTB7-Th:α-TPB, a device optimized by processing with the additive diphenyl ether (DPE) exhibits 8.5% efficiency compared to 7% for the device cast from CB only. Reference Wu, Zhao, Schneider, Chen and Yu61 This particular polymer-SMA BHJ system presents a case where the blend components have very similar mass and electron densities and both the donor and acceptor materials show weak contrast in traditional bright field TEM and GISAXS as shown in Fig. 1.
(a) GISAXS 2-D data; (b) bright field TEM images (scale bar 200 nm) for the samples cast from CB only (no-additive) (left panel) and the optimized CB + 8% v/v DPE additive (8% DPE) (right panel). Inset in (a) shows 1-D scattering profiles from the two samples.

A. Characterization techniques
We provide here a short review of the techniques we will employ and the physical principles involved. We emphasize the mechanisms by which our chosen methods derive contrast, which differ from conventional approaches.
1. LAADF-STEM
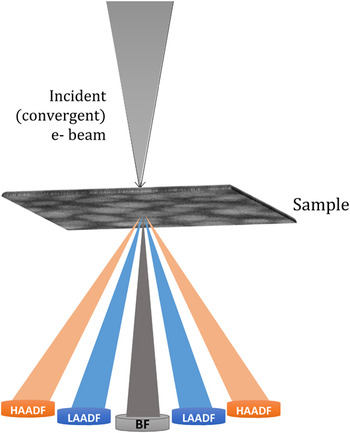
Real-space imaging via scanning transmission electron microscope (STEM) has been established as a versatile tool for structural and chemical characterization at the nano- and atomic-scale. In the STEM, an electron probe is scanned over a thin, electron transparent specimen at high spatial resolution. Reference Pennycook and Nellist67 The incident electrons are scattered by the specimen in a variety of ways, and one or more of the resulting signals is collected serially at each position in the scan. The most widely used approaches for data collection in STEM is accomplished by integrating the electron flux impinging upon a post-specimen detector. The resulting image characteristics will depend upon the angular range of the electron scattering distribution that the detector subtends. For example, if the detector is chosen so as to collect the unscattered and those electrons scattered only to small angles, an image directly comparable to a traditional bright-field TEM image is formed. If instead an annular detector is centered on the optic axis, as shown in Fig. 2, the unscattered and low-angle electrons pass through uncollected while those electrons scattered within the detector range are used to form an annular dark field (ADF) image. One advantage of STEM imaging over traditional, parallel beam imaging is that multiple signals can be collected simultaneously or along with the chemically sensitive electron energy loss and X-ray energy dispersive spectroscopic signals.
Schematic of ADF-STEM imaging showing the respective experimental geometries for the low-angle annular dark field (LAADF), high-angle annular dark field (HAADF) and bright field (BF) imaging modes. The collection angles of the detectors are varied by changing the camera length (effective distance between specimen and detector plane).

In solid-state materials characterization, high-angle (HA)ADF images are often collected by positioning the detector so as to collect only those electrons scattered to angles typically greater than 70 mrad. HAADF images are dominated by incoherent scattering and are relatively free of contrast changes due to Bragg diffraction. Therefore, with some care, the HAADF intensity at each position in the scan can be directly interpreted in terms of differences in atomic-number, density, thickness, or some combination of these. This so-called Z-contrast imaging can also be used effectively to characterize soft matter specimens; however, such materials scatter high energy electrons weakly and often the result in poor quality HAADF images. This can be overcome to some degree by increasing the integration time at each image position, but this also increases the dose delivered to the specimen which leads to structural and chemical alteration or even catastrophic breakdown in some cases. In many cases for soft matter, coherent scattering due to Bragg diffraction is of little concern. In these cases, low-angle (LA)ADF imaging can be superior. LAADF images of such materials exhibit a higher signal-to-noise ratio, can be collected with much lower electron dose, and the contrast they reveal can still be interpreted in a straightforward manner. A potential drawback of the technique, as with most electron microscopies, is that the electron beam can cause sample damage that might alter its composition or structure. The rate of sample damage for polymeric materials is known to be a function of incident electron beam energy and sample temperature that in turn determine the optimal electron dose for a particular class of samples. Reference Grubb and Groves68 Another issue common to all electron microscopies is that the LAADF-STEM image formed on the detector plane is a 2-D projection of the 3-D morphology resulting in loss of out-of-plane information, loss of contrast, and artifacts due to overlapping structures. These issues can be addressed with advanced tomographic approaches.
2. Resonant soft X-ray scattering (R-SoXS)
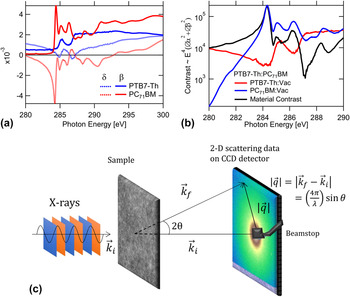
While STEM can produce images with clear contrast, signal limitations often preclude detailed quantitative analysis. Reciprocal space techniques (small angle X-ray scattering, small angle neutron scattering) typically provide a much wider signal dynamic range. The contrast limitations of hard X-ray (>10 keV) scattering can be overcome by operation in the soft X-ray regime (120–2500 eV) near the resonance edges in the absorption (β) and dispersion (δ) [Fig. 3(a)]. In the case of a two-component system the scattering intensity scales as
 $I({\bi{q}},E) \propto {E^4}( {\Delta \idelta {{(E)}^2} + \Delta \ibeta }{{(E)}^2}}) \times S\left( q \right)$
where
 $\Delta \delta = {\delta _1} - {\delta _2}$
and
 $\Delta \beta = {\beta _1} - {\beta _2}$
denotes difference in optical constants between the constituent materials.
Reference Araki, Ade, Stubbs, Sundberg, Mitchell, Kortright and Kilcoyne69
The resonant soft X-ray scattering (R-SoXS) intensity is therefore modulated strongly as a function of energy [Fig. 3(b)]. Thus, even in the absence of significant differences in the mass/electron densities of the sample constituents, the differences in the optical constants near absorption edges can be exploited for scattering contrast in R-SoXS.
Reference Carpenter, Hunt and Ade70
Furthermore, the relatively large difference between material and mass roughness contrast below the absorption edge [Fig. 3(b)] allows data to be acquired with good contrast below the edge enabling thick samples (∼500 nm) to be studied without loss due to absorption and with minimal sample damage.
(a) Variation of the real (δ) and imaginary (β) parts of the refractive index for PTB7-Th and PC71BM; (b) material contrast between the donor polymer PTB7-Th and PC71BM and vacuum/mass thickness contrasts for PTB7-Th and PC71BM near and across the C K-edge (∼285 eV); see Supplementary Material for details on measurement of δ and β (c) schematic of R-SoXS experiment in transmission geometry with the X-ray beam at normal incidence to the film.

Standard R-SoXS Reference Carpenter, Hunt and Ade70,Reference Collins, Cochran, Yan, Gann, Hub, Fink, Wang, Schuettfort, McNeill, Chabinyc and Ade71 employs a small angle scattering transmission geometry, with a thin film perpendicular to an incoming soft X-ray beam, as shown in Fig. 3(c). Typically R-SoXS experiments utilize relatively small scattering angles (<30°), therefore the momentum transfer (q) component in the out-of-plane direction is negligible. The scattered intensity is recorded (with loss of phase information) by a 2-D detector behind the sample, and the distance from the beam center on the detector is converted to magnitude of momentum transfer values as shown in Fig. 3(c).
With appropriate choice of X-ray energy, R-SoXS can probe the same in-plane morphological structures as hard X-ray techniques as well as probe in-plane spatial correlations having little differences in electron density. The technique has been applied before to study all-polymer and polymer–SMA BHJ blend systems.
Reference Ye, Zhao, Li, Mukherjee, Carpenter, Awartani, Jiao, Hou and Ade10,Reference Swaraj, Wang, Yan, Watts, Luning, McNeill and Ade72–Reference Deshmukh, Prasad, Chandrasekaran, Liu, Gann, Thomsen, Kabra, Hodgkiss and McNeill76
From the contrast functions corresponding to a given sample a suitable energy is chosen to investigate the structures of interest. Azimuthally averaged 1-dimensional (1-D) I(q) profiles can be obtained from reduction of the 2-D scattering data. It is a text-book exercise to establish that
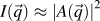 $I\left( {\vec q} \right) \approx {\left| {A\left( {\vec q} \right)} \right|^2}$
where
 $A\left( {\vec q} \right)$
is the spatial Fourier transform of the scattering length density (SLD) distribution.
Reference Stribeck77
This establishes the quantitative link between R-SoXS and LAADF-STEM with the recognition that the relevant SLD is different for each technique. If the system is 3-D isotropic, then one can write the familiar relationship
 $I\left( q \right) = V\int_0^\infty {4\pi {r^2}\,{\rm{d}}r\,\gamma \left( r \right){{\sin qr} \over {qr}}}$
where γ is the real-space SLD autocorrelation function. A useful, model independent parameter based on I(q) is the total scattering intensity:
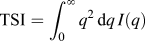 ${\rm{TSI}} = \int_0^\infty {{q^2}\,{\rm{d}}q\,I\left( q \right)}$
. For a two phase system with fixed composition in each phase, it can be shown that
 ${\rm{TSI}} = 2{\pi ^2}V\Delta {\rm{SLD}}_{12}^2{\phi _1}{\phi _2}$
where
 ${\phi _i}$
is the volume fraction of phase i. The insight into phase purity is critical in the characterization of BHJs. However, in both R-SoXS and plane-view LAADF-STEM, only I(q
x
, q
y
) are measured, and over a limited range. We will consistently make the approximation that the system is 3-D isotropic and domains of length scales larger than molecular length scales only contribute to TSI. Under the above assumptions the experimental integrated scattering:
 ${\rm{ISI}} \equiv \int_{q\min }^{q\max } {{q^2}\,{\rm{d}}q\,I\left( q \right)}$
is as a good proxy for the TSI and provides a measure of domain purities over the measured q-range or corresponding length scales. In addition to size and average composition variation (average purity), molecular orientation correlations and ordering relative to the donor–acceptor interface can also be a critical structure parameter that impacts performance. It has been shown that the scattering anisotropy or the dichroic ratio between the scattering intensities in directions parallel and perpendicular to the incident X-ray beam polarization vector in polarized R-SoXS correlates with the degree of in-plane molecular ordering at the donor–acceptor interface.
Reference Collins, Cochran, Yan, Gann, Hub, Fink, Wang, Schuettfort, McNeill, Chabinyc and Ade71,Reference Gann, Collins, Tang, Tumbleston, Mukherjee and Ade78
This ordering may influence exciton dissociation and charge transport near an interface, with “face-on” orientation being generally positively correlated to improved device performance.
Reference Tumbleston, Collins, Yang, Stuart, Gann, Ma, You and Ade5,Reference Ma, Tumbleston, Wang, Gann, Huang and Ade79
Despite the advantages discussed above, R-SoXS has some drawbacks. As is the case with scattering methods in which phase information is lost, extracting a real space picture by Fourier inversion often requires modeling and associated computation costs, and multiple real-space solutions may account for the scattering pattern. Although radiolabeling is not required for R-SoXS contrast, the range of sample thickness is limited to <500 nm due to absorption in the sample, which might require sample thinning approaches such as those that have been developed for TEM. Higher absorption cross-section near the edge also leads to X-ray induced sample damage Reference Coffey, Urquhart and Ade80 and requires optimization of choice of energy, contrast and irradiated dose. Critically, due to the absorption and shorter attenuation lengths of soft X-rays in air it is necessary to conduct the experiments in vacuum and therefore sampling gas/liquid environments requires additional design considerations. Transmission R-SoXS provides information on the in-plane morphology. Limited out-of-plane information can be obtained by tilting the sample within certain limits. Reference Sunday, Hammond, Wang, Wu, Kline and Stein81 Additionally, grazing incidence R-SoXS (GI-RSoXS) can be applied to simultaneously probe the vertical and lateral morphology as has been recently shown for some polymer–fullerene and all-polymer blends. Reference Schaffer, Wang, Hexemer and Müller-Buschbaum82,Reference Ruderer, Wang, Schaible, Hexemer, Xu and Muller-Buschbaum83
II. EXPERIMENTAL METHODS
A. Sample preparation
The BHJ films were fabricated on glass slides pre-cleaned in chloroform, acetone, deionized (DI)-water, and dried under a nitrogen stream. The precleaned glass substrates were UV Ozone-treated and a 30–40 nm layer of poly(3,4-ethylenedioxythiophene):poly(styrenesulfonate) (PEDOT:PSS) (Clevios AI 4083, Ossila, Sheffield, United Kingdom). (Certain commercial equipment, instruments, or materials are identified in this paper in order to specify the experimental procedure adequately. Such identification does not imply recommendation or endorsement by the National Institute of Standards and Technology, nor is it intended to imply that the materials or equipment identified are necessarily the best available for the purpose.) was spun cast at 419 rad/s (4000 rpm) on top. The samples were subsequently annealed at 130 °C for 20 min under ambient conditions in a fume hood before being moved to a N2 glovebox. Chlorobenzene (CB) solutions containing 1:1.5 (by weight) blend ratios of poly[[2,6′-4,8-di(5-ethylhexylthienyl)benzo[1,2-b;3,3-b] dithiophene] [3-fluoro-2[(2-ethylhexyl)carbonyl]thieno[3,4-b]thiophenediyl]] (PTB7-Th) (1-Material, Dorval, Canada) and PC71BM (Nano-C, Westwood, Massachusetts) with total solid concentration 25 mg/mL were prepared and kept overnight at 75 °C. The BHJ layers were spun cast from the hot solvent at 105 rad/s (1000 rpm) for 60 s on the PEDOT:PSS coated glass substrates to make a ≈ 100 nm film. The 3% DIO sample was prepared by adding 3% v/v concentration of 1,8-diiodooctane (DIO) (98%, Sigma-Aldrich, St. Louis, Missouri) to the blend solution. The alpha-substituted PDI acceptor (α-TPB) was synthesized as described in literature. Reference Wu, Zhao, Schneider, Chen and Yu61 The α-TPB based PTB7-Th:α-TPB blend films were spun cast at 105 rad/s (1000 rpm) from chlorobenzene (CB) solutions stirred overnight at 73 °C containing 1:1 (by weight) blend ratios with total solid concentration of 20 mg/mL to make a ≈ 100 nm film. The 8% DPE sample was prepared by adding 8% v/v concentration of diphenyl ether (DPE) (≥99%, Sigma-Aldrich) to the blend solution.
B. R-SoXS and STEM experiments
Samples of the BHJ films were prepared for both R-SoXS and STEM imaging by a wet floatation method. The films were scored with a scalpel and then introduced to a bath of deionized water at an angle of approximately 45°. The bottom-most organic layer (PEDOT:PSS) was dissolved by the water leaving behind the active BHJ layer floating on the surface. The floating films were then picked up using a 100 nm Si3N4 window (Norcada, Edmonton, Canada) for R-SoXS measurements and on a standard 200-mesh copper TEM grid for STEM and dried in air. Film thicknesses were measured using an ellipsometer (M-2000-XI, J. A. Woollam Co., Inc, Lincoln, Nebraska) prior to transfer.
The 2-D R-SoXS data were collected at beamline 11.0.1.2 (Ref. Reference Gann, Young, Collins, Yan, Nasiatka, Padmore, Ade, Hexemer and Wang84) at the Advanced Light Source using a Peltier-cooled (−45 °C) in-vacuum [base pressure ∼10−9 kPa (10−8 mBar)] CCD detector (PI-MTE, Princeton Instruments, Trenton, New Jersey; 2048 × 2048 pixels). 1-D scattering profiles were obtained from the 2-D scattering patterns using a custom Nika Reference Ilavsky85 analysis package and subsequently normalized for the instantaneous X-ray flux. The scattering intensity is affected by the distance traveled by the X-ray beam through the sample. R-SoXS scattering intensities were therefore normalized for absorption and film thickness. Reference Tumbleston, Stuart, Gann, You and Ade48
LAADF images of each specimen were collected using an FEI Titan 80-300 STEM (FEI Company, Hillsboro, Oregon) equipped with a double-hexapole spherical aberration corrector (CEOS GmbH, Heidelberg, Germany) and an annular dark-field detector (Model 3000, E. A. Fischione Instruments, Export, Pennsylvania). A small (3 mrad) probe-forming aperture was used and the post-specimen optics were configured such that the ADF detector inner and outer angles were 17 mrad and 95 mrad, respectively. A low spot number was used to produce an electron probe containing a current of approximately 45 pA when using the small probe-forming aperture. A 2-D fast Fourier transform (FFT) was calculated from each image (Scipy, fftpack). A linear (incoherent) background was fitted to the nearly constant values in the extreme high-q range of the azimuthally averaged power spectral density profiles (PSD) obtained from the FFT. All profiles had similar values for the incoherent background. The background subtracted PSD profiles were normalized for film thickness and compared with the R-SoXS.
C. Grazing incidence small-angle X-ray scattering (GISAXS)
GISAXS measurements were performed at beamline 7.3.3 (Ref. Reference Hexemer, Bras, Glossinger, Schaible, Gann, Kirian, MacDowell, Church, Rude and Padmore86) of Advanced Light Source. Samples were blade-coated using identical blend solutions as those used in devices on a PEDOT:PSS pre-coated Si substrate. The 10 keV X-ray beam was incident at a grazing angle of 0.16° that is above the critical angle for the film. The scattered intensity was detected with a Dectris Pilatus 1M photon counting detector (Dectric AG, Baden, Switzerland) at a distance of ≈3.8 m.
D. NEXAFS
Transmission NEXAFS measurements were performed at the ALS bending magnet beamline 5.3.2.2 (Ref. Reference Kilcoyne, Tyliszczak, Steele, Fakra, Hitchcock, Franck, Anderson, Harteneck, Rightor, Mitchell, Hitchcock, Yang, Warwick and Ade87) using a 240 µm diameter zone plate with an outermost zone-width of 25 nm. Entrance and exit slits were at 50 µm and 25 µm, respectively. Approximately 0.08 kPa (0.6 torr) of N2 was bled into a section of the beamline to improve spectral purity. All data were acquired and processed using previously established protocols. Reference Collins and Ade88
III. RESULTS AND DISCUSSION
A. Fullerene-based BHJ (PTB7-Th:PC71BM) blends
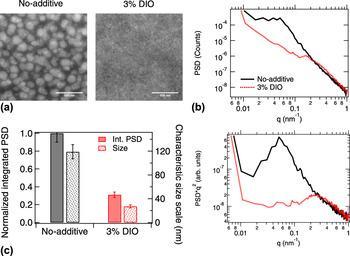
In Fig. 4(a) LAADF STEM images for samples cast from CB (no-additive) and CB + DIO (3% DIO) solution are shown respectively. The contrast in the LAADF-STEM image is determined by the amount of scattering due to mass or electron density correlations. Therefore, the brighter regions are PCBM-rich with a higher electron density and the darker regions are polymer-rich. Droplet-like fullerene-rich domains with diameters >100 nm suggesting liquid–liquid phase separation in a polymer-rich matrix is observed for the no-additive sample. Reference Bartesaghi, Perez, Kniepert, Roland, Turbiez, Neher and Koster7,Reference van Franeker, Westhoff, Turbiez, Wienk, Schmidt and Janssen89 In the case of the 3% DIO sample the large-scale domains are completely absent and a fine fibrillar polymer network is observed. This agrees with previous observations where the use of a co-solvent results in onset of polymer aggregation and/or network formation before liquid–liquid phase separation occurred. Reference van Franeker, Westhoff, Turbiez, Wienk, Schmidt and Janssen89,Reference van Franeker, Turbiez, Li, Wienk and Janssen90
(a) LAADF-STEM images of PTB7-Th:PC71BM samples cast from CB (no-additive) and CB + DIO (3% DIO) solutions respectively. Scale bar, 500 nm; (b) background corrected power spectral density (PSD) versus q (upper) and q 2 weighted Reference Stribeck77 (PSD*q 2 versus q) (lower) 1-D profiles calculated from a fast Fourier transform (FFT) of the LAADF images in (a); (c) integrated PSD*q 2 (ISI) over all observed length scales (solid bars) and characteristic size scale (dotted bars) calculated from major peak position in PSD profiles for the no-additive and 3% DIO samples. Intensity and size scale error bar values were estimated from single log-normal peak fits to the PSD*q 2 profiles.

To obtain further insights into the morphology and particularly to analyze the spatial size distribution present in the samples, power spectral density profiles were calculated by taking the FFT of the LAADF-STEM images. Both the PSD (equivalent to I(q)) and the q 2 weighted PSD (necessary for calculation of the ISI) are shown in Fig. 4(b). A strong peak around 0.05 nm−1 corresponding to a dominant size scale of ≈120 nm (s = 2π/q) is observed for the no-additive sample. The 120 nm length scale is clearly the average PCBM-rich domain spacing by inspection of Fig. 4(a). In contrast, the 3% DIO sample shows strikingly little structure, with a weak peak around 0.25 nm−1 corresponding to a characteristic size scale of ≈25 nm. The derived ISI and the size scales for the two samples are shown in Fig. 4(c). The interpretation of these features in the LAADF-STEM will be discussed below in the context of reciprocal space X-ray data.
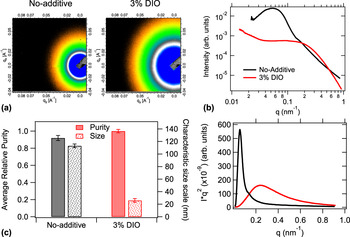
To compliment the real space investigations, the in-plane spatial composition variations were assessed using R-SoXS. The 2-D scattering data and the azimuthally averaged 1-D scattering profiles of no-additive and 3% DIO blends acquired at a photon energy of 284.1 eV, where the material contrast dominates over vacuum contrast or mass-thickness contrast, are shown in Fig. 5(a). The clear superior dynamic range of the R-SoXS data, relative to LAADF-STEM, can be seen in the comparison of Figs. 4(b) and 5(b). For the no-additive film a dominant peak around 0.055 nm−1 is observed, corresponding to a spacing (long period) of ≈115 nm and a weaker shoulder around 0.135 nm−1 corresponding to a size scale of ≈45 nm similar to previous observations with PTB7:PC71BM blend. Reference Collins, Li, Tumbleston, Gann, McNeill and Ade91 The 3% DIO sample exhibits a broad peak suggesting a broad size distribution of domains with a characteristic size scale of ≈25 nm. The size scale values obtained from R-SoXS are in excellent agreement with the FFT analysis of the LAADF-STEM images. R-SoXS alone cannot distinguish polydispersity from shape anisotropy. The real-space images provide direct evidence for interpretation of the no-additive case as polydisperse droplets, and the 3% additive case as anisotropic fibrils, with the 25 nm length the fibril width. For both the systems the broad or multi-peak nature of the scattering profile indicates presence of a multi-length-scale morphology similar to previous observations. Reference Mukherjee, Proctor, Bazan, Nguyen and Ade6,Reference Mukherjee, Jiao and Ade9,Reference Ye, Zhao, Li, Mukherjee, Carpenter, Awartani, Jiao, Hou and Ade10,Reference Ro, Downing, Engmann, Herzing, DeLongchamp, Richter, Mukherjee, Ade, Abdelsamie, Jagadamma, Amassian, Liu and Yan13,Reference Collins, Li, Tumbleston, Gann, McNeill and Ade91–Reference Liu, Zhao, Tumbleston, Wang, Gu, Wang, Briseno, Ade and Russell94 The scattering profiles taken at photon energy 270 eV where vacuum or high mass-thickness roughness contrast dominates also exhibit similar features (Fig. S1a).
(a) R-SoXS 2-D data set acquired at high material contrast energy (284.1 eV) for PTB7-Th:PC71BM blends prepared with CB solvent (no-additive) and CB + DIO (3% DIO) solvents; (b) azimuthally averaged I versus q (upper) and, absorption corrected and normalized q 2 weighted Reference Stribeck77 (Iq 2 versus q) (lower) 1-D profiles obtained from the 2-D scattering data in (a); (c) average relative domain purity (solid bar), characteristic size scale (dotted bar) calculated from the 1-D profiles in (b). Domain purity error bars were estimated from variations between relative purity values at different high material contrast energies in the energy range 282–284.2 eV. Error values for the characteristic size scales were obtained from variations in q-scale calibrations in independent measurements on identical samples.

As discussed above, the R-SoXS profiles arise from composition correlations weighted by the scattering contrast and volume fractions of these correlations. The ISI is affected by the phase contrast as well the volume fraction of each phase and the energy dependence of the ISI reveals the physical origin underlying the contrast that produces the scattering. The ISI for the two samples measured at different energies is seen to follow the material contrast (Fig. S1b). The normalized composition variation (domain purity, estimated as normalized
 $\sqrt {{\rm{ISI}}}$
) calculated from the q-range probed reveals that the relative phase purities are very similar [Fig. 5(c)]. A higher scattering intensity is observed above 0.2 nm−1 corresponding to size scales <30 nm for the 3% DIO sample compared to the no-additive sample. Interestingly, the R-SoXS ISI does not match with what is obtained from LAADF-STEM. However, one needs to be careful when directly comparing the integrated intensity from LAADF-STEM PSD profiles and R-SoXS. Unlike R-SoXS, where the dominant source of contrast can be selected by changing the incident photon energy, the contrast in the LAADF-STEM images is determined by multiple factors viz., mass/electron density correlations, 2-D projection of roughness and electron diffraction contrast. As electron diffraction in these poorly ordered samples should be negligible, the higher intensity of the no-additive sample [Fig. 4(c)] is likely due to the other two reasons. On the other hand, the finer features in the 3% DIO sample probably result in lower signal relative to noise that lowers the resultant correlation in the projected 2-D image leading to a lower integrated intensity. Nevertheless, the excellent match between the size scales between the two samples and the qualitative agreement between the PSD and scattering profiles qualify the above combination of tools to characterize a set of non-fullerene samples and raise an alert in the use of LAADF-STEM for assessing phase purity.
B. Non-fullerene based BHJ (PTB7-Th:α-TPB) blends
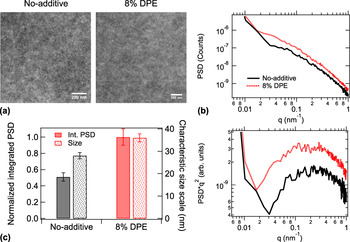
The above set of tools was applied for the study of no-additive and optimized 8% DPE PTB7-Th:α-TPB samples. The real space morphology of the no-additive and 8% DPE samples was probed using LAADF-STEM and the images are shown in Fig. 6(a). The samples have a similar fibrillar morphology as the PTB7-Th:PC71BM 3% DIO case. As with the 3% DIO PC71BM system, the identification of any clear length scales in the PSD is problematic. However, slightly larger characteristic length scales are observed for the 8% DPE sample compared to the no-additive sample. It is interesting to note the distinctly different morphologies (droplet-like versus fibrillar) of the no-additive samples from both sample sets (PC71BM versus α-TPB blends) notwithstanding identical processing protocols including donor material, solvent and temperature. The differences in phase separation characteristics indicate differences in miscibility of the donor–acceptor materials. Reference Collins, Gann, Guignard, He, McNeill and Ade11,Reference Treat and Chabinyc12,Reference Leman, Kelly, Ness, Engmann, Herzing, Snyder, Ro, Kline, DeLongchamp and Richter95 However, a detailed investigation of the thermodynamic properties of the blends is beyond the scope of this study and will be reported elsewhere.
(a) LAADF-STEM images of PTB7-Th:α-TPB samples cast from CB (no-additive) and CB + DPE (8% DPE) solutions respectively. Scale bar, 200 nm; (b) Background subtracted PSD versus q (upper) and q 2 weighted (PSD*q2 versus q) (lower) 1-D profiles calculated from FFT of the LAADF images in (a); (c) integrated PSD*q 2 over observed length scales (solid bars) and characteristic size scale (dotted bars) calculated from major peak position in PSD profiles for the no-additive and 8% DPE samples. Error bars were estimated from single log-normal peak fits to the PSD*q 2 profiles.

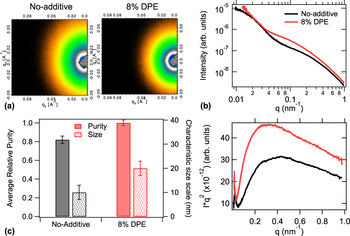
Owing to the similar features in the optical constants and mass density (see Supplementary Material for details) the scattering contrast between the two materials is considerably lower and hence the overall scattering intensity and the S/N ratio of the R-SoXS is noticeably poorer compared to their fullerene counterparts. To obtain meaningful quantification, these samples therefore require longer integration times while keeping beam damage to a minimum. The optical constants are more similar to each other, resulting in a narrower range of energies where the material contrast dominates the vacuum or mass roughness contrast (see Supplementary Material). The R-SoXS 2-D images acquired at the maximum material contrast energy of 283.7 eV are shown in Fig. 7(a). Both the systems show broad scattering peaks suggesting the presence of multiple length scales. After ensuring that the ISI of the broad high-q peak in the scattering profiles follows material contrast (see Supplementary Material, Fig. S3) the characteristic size scales and relative domain purities from the scattering profiles [Fig. 7(b)] were calculated from the relative ISI values and are shown in Fig. 7(c). The PTB7-Th:α-TPB no-additive sample shows a smaller characteristic length scales compared to the 8% DPE sample. The overall average domain purity for the 8% DPE sample was also found to be slightly higher.
(a) R-SoXS 2-D images acquired at high material contrast energy (283.7 eV) for PTB7 Th:α-TPB blends prepared with CB solvent (no-additive) and CB + 8% v/v DPE (8% DPE) solvents; (b) azimuthally averaged I versus q (upper) and absorption corrected and normalized q 2 weighted (Iq 2 versus q) (lower) 1-D profiles; (c) average relative domain purities over all length scales (solid bar), characteristic length scales (dotted bars) obtained from the 1-D scattering profiles in (b). Purity error bars were calculated from variations between relative purity values at different high material contrast energies in the energy range 283–284 eV. Size scale error bars were estimated from variations in q-scale calibrations in independent measurements.

In spite of the challenging low contrast, LAADF-STEM and R-SoXS agree on the primary characteristics of the PTB7-Th:α-TPB system. Both samples show broad peaks with the characteristic size scale of the no-additive sample slightly smaller (by ≈10 nm) compared to that of the 8% DPE sample. However, the size scale values from the PSD profiles was found to be larger compared to the R-SoXS. The LAADF-STEM images are a projection of the 3-D morphology onto a 2-D plane that could result in an overlapping of domains and an apparent increase of size scale in films where the features are smaller than film thickness. Moreover, since mass roughness as well as the density correlations are convoluted in the PSD profile, with the former typically corresponding to larger size scales, Reference Mukherjee, Jiao and Ade9 the net effect will be a shift of peak position toward lower q-values. Higher intensity of the low-q mass-thickness peak in R-SoXS for the 8% DPE sample would result in a slightly higher estimation of the PSD intensity for the latter. Nevertheless, the reasonably good match between the size scales obtained between LAADF and R-SoXS shows that the mass-thickness correlations are lower compared to the density correlations and possibly results in the agreement found between the integrated intensity for the PSD profiles and the ISI from R-SoXS.
IV. CONCLUSIONS
We have showed the utility of LAADF-STEM and R-SoXS as complimentary real and reciprocal space tools to characterize the morphologies of an efficient fullerene-based (PTB7-Th:PC71BM) as well as a recent non-fullerene-based (PTB7-Th:α-TPB) BHJ blend systems that employ the same acceptor but are optimized using different co-solvents and have widely different phase contrast. The validity of the morphology investigation results was put to test by comparing the non-optimum and optimized blends in each of the two systems. For the PTB7-Th:PC71BM system R-SoXS shows strong differences between the differently processed samples in terms of domain size and composition variations at different length scales. Fourier analysis of the LAADF-STEM images gives a qualitative match with the R-SoXS profiles and an excellent match between the characteristic size scales for the respective samples. The discrepancies between the intensities could be explained in terms of different contrast functions governing the STEM images compared to soft X-ray scattering. In case of the PTB7-Th:α-TPB system, despite the low material contrast, the results show an overall good match in terms of profile shape as well as size scale between the two techniques. The optimized non-fullerene blend prepared with additive DPE is found to have a higher average phase purity compared to the no-additive sample. The agreement between the LAADF-STEM and R-SoXS results shows that the toolset can be valuable for characterizing OPV blend systems that exhibit low phase and/or material contrast. The markedly different phase separation characteristics of the identically prepared no-additive fullerene and non-fullerene blends likely indicate different miscibilities of the acceptor materials in the donor (PTB7-Th) matrix and therefore different Flory–Huggins interaction parameters (χblend). Suitably altering χblend could lead to pathways toward adjusting phase separation properties and further improvement of the device performance for this system.
Supplementary Material
To view supplementary material for this article, please visit https://doi.org/10.1557/jmr.2017.131.
ACKNOWLEDGMENTS
Beamline support at beamline 11.0.1.2 was provided by A.L.D. Kilcoyne and C. Wang. Beamline support at beamline 7.3.3 was provided by C. Zhu and E. Schaible. Beamlines 11.0.1.2 and 7.3.3 at the Advanced Light Source are supported by the Director of the Office of Science, Office of Basic Energy Sciences, of the U.S. Department of Energy under Contract No. DE-AC02-05CH11231. H. Ade is supported by ONR contract N00141512322. Michael B. Katz (MSED, NIST) is acknowledged for conducting the BF-TEM characterizations. Thomas Ferron and Brian A. Collins (WSU) are acknowledged for conducting the NEXAFS characterizations. S. M. gratefully acknowledges valuable discussions with Wen-Li Wu (NIST).