Introduction
Lutein is a member of the xanthophyll family of carotenoids and the major carotenoid in soybean [Glycine max (L.) Merr.] seeds (Seppanen et al., Reference Seppanen, Rahmani and Csallany2003; Kanamaru et al., Reference Kanamaru, Wang, Abe, Yamada and Kitamura2006). Lutein is highly concentrated in the macula and lens of the human eye and exhibits dual functions in both tissues as a powerful antioxidant and a filter of high-energy blue light (Landurm and Bone, Reference Landurm and Bone2001). Lutein has been shown to improve and maintain eye health (Mares-Perlman et al., Reference Mares-Perlman, Millen, Ficek and Hankinson2002; Semba and Dagnelie, Reference Semba and Dagnelie2003), and it may contribute to cardiac health by reducing the risk of atherosclerosis (Kritchevsky et al., Reference Kritchevsky, Bush, Pahor and Gross2000; Dwyer et al., Reference Dwyer, Navab, Dwyer, Hassan, Sun, Shircore, Hama-Levy, Hough, Wang, Drake, Merz and Fogelman2001; Mares-Perlman et al., Reference Mares-Perlman, Millen, Ficek and Hankinson2002).
Kanamaru et al. (Reference Kanamaru, Wang, Abe, Yamada and Kitamura2006) studied the variation in lutein content in 490 cultivated soybeans and 610 wild soybeans and found that it did not vary significantly among the years in high-lutein content wild soybeans and concluded that lutein content in wild soybeans was stable. Similarly, Lee et al. (Reference Lee, Shannon, So, Sleper, Nelson, Lee and Choung2008) found no effect of year and planting date on lutein content in the seeds of 15 cultivated soybeans grown in four environments. Wang et al. (Reference Wang, Kanamaru, Li, Abe, Yamada and Kitamura2007) reported high narrow-sense heritability for lutein content and suggested that selection for high lutein concentrations should be easy.
As lutein plays significant nutritional and functional roles in human health, manipulation of its content is an important breeding objective for soybean breeders. However, little is known about the concentrations and stability of lutein in accessions from the USDA Soybean Germplasm Collection. The objectives of this study were to identify and select soybean genotypes with contrasting seed lutein concentrations and to determine the stability of lutein concentrations across six environments.
Materials and methods
Soybean genotypes and field experiments
In 2007, 314 soybean genotypes (maturity groups 0–VII) that had not been examined for lutein concentrations were obtained from the USDA Soybean Germplasm Collection, Urbana-Champaign, IL (see online supplementary Table S1), and grown at the University of Missouri-Delta Center Lee (UMDCL) farm in Portageville, MO, USA. One replication of ten seeds per genotype was planted on 14 May. At maturity, seeds were harvested and lutein concentrations determined as described below.
Based on the lutein concentration data (see online supplementary Table S1) obtained in 2007, 18 genotypes with high lutein concentrations (>8 μg/g) and five genotypes with low lutein concentrations (1–2 μg/g) were selected to test the environmental stability of lutein concentrations. In addition, based on the study carried out by Lee et al. (Reference Lee, Shannon, So, Sleper, Nelson, Lee and Choung2008), cultivars ‘N98-4445A’ (Burton et al., Reference Burton, Wilson, Rebetzke and Pantalone2006) and ‘Anand’ (Anand et al., Reference Anand, Newman and Fisher2001) were included as references. The 25 entries were planted on 15 May and 18 June 2008 and 18 May and 19 June 2009 at UMDCL (latitude 36°44′N) and on 20 May and 1 June 2009 in Columbia, MO (latitude 38°58′N). At each location, seeds were planted in a randomized complete block design with two replications. Ten seeds per genotype were planted in hill plots at a distance of 61 cm between hills and of 76 cm between rows. At maturity, plants from each hill plot were threshed and seeds stored until analyses.
Lutein analysis
A subsample of seeds from each plot was used for lutein extraction as described by Lee et al. (Reference Lee, Shannon, So, Sleper, Nelson, Lee and Choung2008). Lutein concentrations were determined using an Agilent 1200 series HPLC system (Wilmington, DE, USA) equipped with a YMC ODS AM 303 column (5 μm: 250 × 4.6 mm inner diameter; Waters, Milford, MA, USA) protected with a Nova-Pak C18 guard insert column (Waters) and a photodiode array detector operating at 430 nm.
Statistical analyses
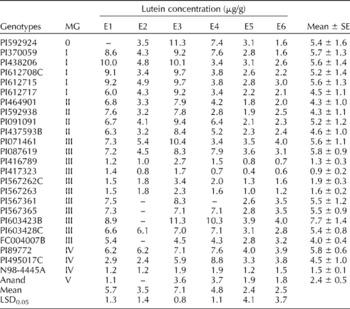
For statistical analyses, locations, years and planting dates within a location were treated as different environments (Table 1). To test the environmental effect on soybean seed lutein concentrations, range of average lutein concentrations, coefficients of variation (CVs) and stability coefficients (b E) were determined (Lee et al., Reference Lee, Woolard, Sleeper, Pantalone, Nyinyi, Cardinal and Shannon2009). The b E was calculated from the regression of the lutein concentration of a genotype in an environment on an environmental index (Lee et al., Reference Lee, Woolard, Sleeper, Pantalone, Nyinyi, Cardinal and Shannon2009). Analysis of variance was carried out using the SAS general linear mixed model procedure (SAS version 9.1).
Mean lutein concentrations of 25 soybean genotypes including two checks in each of the six environmentsa, 2008 to 2009

MG, maturity group; –, missing plot; LSD, least significant difference.
a Environments where soybean genotypes were planted: E1 (15 May, University of Missouri-Delta Center (UMDCL), Lee farm, Portageville, MO, 2008); E2 (18 June, UMDCL, Lee farm, Portageville, MO, 2008); E3 (18 May, UMDCL, Lee farm, Portageville, MO, 2009); E4 (19 June, UMDCL, Lee farm, Portageville, MO, 2009); E5 (20 May, Bradford Research and Extension Centre, Columbia, MO, 2009); E6 (1 June, Bradford Research and Extension Centre, Columbia, MO, 2009).
Results and discussion
The seed lutein concentrations of the 314 genotypes ranged from 0.1 to 11.2 μg/g and averaged 4.3 μg/g (see online supplementary Table S1). Multi-environment examination of 25 genotypes revealed that seed lutein concentrations were significantly affected by genotype (G) (P< 0.0001), environment (E) (P< 0.0001), and G × E interactions (P< 0.0001) (see online supplementary Table S2). Mean lutein concentration across all the genotypes and environments was 4.4 μg/g and ranged from 0.9 to 7.7 μg/g (Table 1). Averaged across all the environments, the lutein concentrations of genotypes PI603423B (7.7 μg/g), PI087619 (5.8 μg/g) and PI89772 (5.8 μg/g) were numerically greatest, while those of genotypes PI417323 (0.9 μg/g), PI416789 (1.3 μg/g) and PI567263 (1.6 μg/g) were numerically lowest. The lutein concentrations of the two check varieties N98-4445A (1.5 μg/g) and Anand (2.4 μg/g) were slightly lower than that reported previously for these two varieties (Lee et al., Reference Lee, Shannon, So, Sleper, Nelson, Lee and Choung2008).
The lutein concentrations of most genotypes fluctuated across the environments. Lutein concentrations were strongly influenced by planting date (P< 0.0001), with early plantings resulting in greater lutein concentrations (5.0 μg/g) than late plantings (3.6 μg/g). As planting date did not have a consistent effect on lutein concentrations in Columbia, the significant overall planting date effect was caused by the responses observed in Portageville. In Portageville, where the entries were examined for 2 years, a significant effect of growing season (P< 0.001; 4.6 μg/g in 2008 and 5.9 μg/g in 2009) was also observed. Comparison of genotypes grown in Portageville and Columbia in 2009 revealed a significant location effect (P< 0.001), with lutein concentrations averaging 5.9 μg/g in Portageville and 2.5 μg/g in Columbia. Nonetheless, genotypes with the highest and lowest lutein concentrations were consistent at both the locations, except for genotype PI071461, which had high lutein concentrations in Columbia for both planting dates but exhibited strongly reduced concentrations from the first to the second planting dates in Portageville.
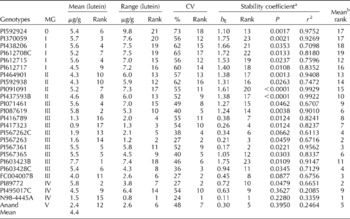
Relative stability among the genotypes was assessed based on range, CV and b E, with smaller values being indicative of greater stability across the environments (Table 2). Interestingly, early-maturity group entries (MG 0 to II) were less stable across the environments (Table 2). Most genotypes with low lutein concentrations were more stable than the genotypes with elevated lutein concentrations. The cultivar N98-4445A, which had a low mean lutein concentration (1.5 μg/g), was the most stable as indicated by the lowest rank for all the three stability parameters. Among the accessions with elevated lutein concentrations, PI567361 (5.5 μg/g), PI567365 (5.5 μg/g) and PI89772 (5.8 μg/g) were relatively stable and PI603423B (7.7 μg/g) was medium stable across the growing environments. Thus, these PI accessions with elevated lutein concentrations and stability may serve as good breeding materials to improve lutein concentrations in soybean seeds.
Stability parameters, mean, range, coefficient of variation (CV), stability coefficient (b E), and coefficient of determination (r 2) for the mean lutein concentrations of 25 soybean genotypes calculated when grown in six environments

MG, maturity group.
a Stability coefficients for the regression of lutein concentrations of genotypes in each environment against the environmental index.
b Mean rank was determined based on the average value of four stability parameters.
Although some studies found lutein concentrations to be stable across environments (Kanamaru et al., Reference Kanamaru, Wang, Abe, Yamada and Kitamura2006; Lee et al., Reference Lee, Shannon, So, Sleper, Nelson, Lee and Choung2008), others reported them to be significantly affected by environments such as seeding date and management including seeding rate, row spacing and fertilizer (Seguin et al., Reference Seguin, Tremblay, Pageau, Liu and Turcotte2011) and also reported G × E interactions (Lee et al., Reference Lee, Shannon, So, Sleper, Nelson, Lee and Choung2008). The results of this study reveal significant genotype, year, location and planting date effects on seed lutein concentrations. Significant differences among the genotypes imply that it is possible to select and breed for high lutein concentrations in soybeans. However, factors such as location, planting date and field management should be considered when breeding for increased lutein concentrations and developing soybeans as a lutein source. In this study, we identified novel germplasms that should prove useful for breeding soybeans with high seed lutein concentrations.
Supplementary material
To view supplementary material for this article, please visit http://dx.doi.org/10.1017/S1479262114000161
Acknowledgements
This research was supported by Bio-industry Technology Development Program (110018-4), Ministry of Agriculture, Food and Rural Affairs, Republic of Korea.