I. INTRODUCTION
Demand for efficient nonlinear optical crystals has attracted many researchers in the field of photonics due to their wide usage in laser frequency converters, high pulsed lasers,Reference Dudley and Taylor1,Reference Fejer2 electro-optical modulators, and Q-switching devices.Reference Shang, Sun, Li, Yang, Zhang and Xu3 Organic and semi-organic crystals have fulfilled all the above-mentioned applications for few decades. But their usage is limited in pure form due to low thermal conductivity, low SHG efficiency, and high intrinsic polarizability. To overcome such key factors, many researchers have incorporated a variety of dopants like amino acids, metal ions, nonmetal ions, and dyes in the crystal matrix.Reference Bhagavannarayana, Parthiban and Meenakshisundaram4–Reference Ganesh, Shkir, AlFaify and Yahia8 Dying of the crystals is important for a variety of solid-state dye lasers. The importance and incorporation of dye molecules in solution-grown crystals have been studied by many researchers: especially, Kahr et al.Reference Kahr and Gurney9 extensively discussed the importance of dye incorporation in a wide variety of organic, inorganic, and semi-organic crystals in terms of their habit modification and structural change. Kahr and ShtukenbergaReference Kahr and Shtukenberg10 also discussed the dying of biological, optical, and electrical important crystals in various structural aspects. The effect of Violamine R dye, DCM dye, and pyranine dye in KAP and K2SO4 was studied by Kristin et al. by the single-molecule confocal microscopy study and concluded the incorporation of dye molecules.Reference Wustholz, Bott, Isborn, Li, Kahr and Reid11 Similarly, there are many articles which clearly show the importance of dye-doped crystals in various aspects like growth factors, habit modifications structural, spectral luminescence, optical, and mechanical studies.Reference Ganesh, Shkir, AlFaify and Yahia8,Reference Shkir12,Reference Shkir, Ganesh, AlFaify, Maurya and Vijayan13 Bis thiourea cadmium acetate (BTCA), an important semi-organic crystal, belongs to thiourea complex family with space group P212121 which hosts a variety of dopants and provides a conductive environment to increase the nonlinear optical properties of the material.Reference Ganesh, Bhaskar Rao, Kishan Rao, Bhagavannarayana and Shkir14 In this context, several studies have been carried out on pure and doped BTCA crystals viz., crystal growth, morphology, and optical and thermal studies.Reference Ganesh, Snehalatha Reddy, Shakir, Wahab, Bhagavannarayana and Kishan Rao15–Reference Anis, Hussaini, Shirsat and Muley17 There has been a little focus on dying of the crystals, which affects the local deformation structure of the host material and enhances the various optical properties. Hence, in view of this importance, first time, an efficient π-conjugated organic dye of phenol red (PR) is used to dye BTCA and various key properties of growth, structural, optical, luminescence, thermal; defect and mechanical have been studied and discussed.
II. EXPERIMENTAL TECHNIQUES
A. Crystal growth
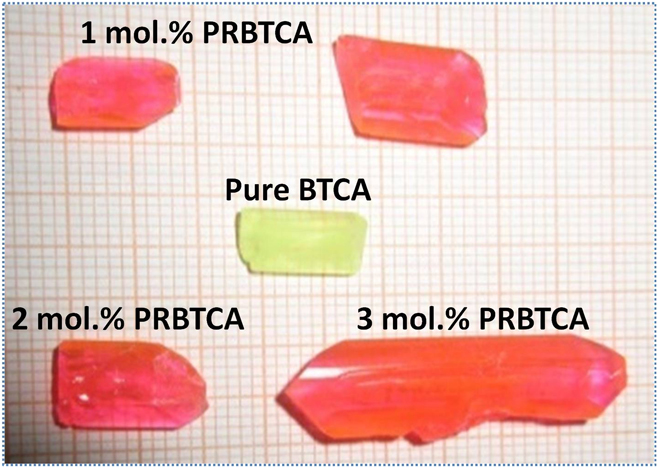
Pure and PR dyed BTCA crystals were grown by the slow solvent evaporation process. High quality commercially available thiourea and cadmium acetate salts in one:two molar ratios were dissolved in highly purified water to grow pure BTCA crystals and multiple recrystallization was done to attain the pure material. The total prepared solution was divided in other four beakers in which one was considered as pure and in other 1, 2, and 3 mol% of PR dye was added and stirred. pH was measured during this process and found to be 5.0 to 5.5 of pure and dyed solutions, respectively. All solutions were filtered into different beakers and stored in firm temperature bath at RT. After 30 days, pure BTCA crystals of 10 mm length and 45 days later PRBTCA crystals at all concentrations of small and large dimensions were picked from their mother solutions. Well-faceted pure BTCA crystals are depicted in Fig. 1.Reference Ganesh, Bhaskar Rao, Kishan Rao, Bhagavannarayana and Shkir14,Reference Ganesh, Snehalatha Reddy, Shakir, Wahab, Bhagavannarayana and Kishan Rao15 The PRBTCA crystals were suppressed on other sides and the growth direction proceeded in the 〈100〉 direction only.
Growth morphology of pure and dyed BTCA.

B. Characterization techniques
X-ray diffraction studies were done using an X-ray diffractometer having Cu Kα radiation at 0.01°/m speed in the angular region of 5° ≥ 2θ ≥ 70° at RT. For identifying the incorporation of PR in the crystal matrix, EDX study was carried out. For functional group identifications, FTIR studies were performed. Crystalline excellence was judged by HRXRD using Cu Kα1 radiation (λ = 1.540598 Å). Diffuse reflectance spectra were analyzed in the range of 190–2400 nm. The photoluminescence spectrum of studied crystals was measured in the region of 300–550 nm. Thermal studies of pure BTCA and PRBTCA were examined by differential scanning calorimetry in 30–300 °C temperature range at 10 °C/s flow of heat. To identify defect types and value of present crystals, etching studies were carried out with different etchants at ambient temperature. In addition to these studies, mechanical strength characterization was performed by using a Shimadzu microhardness tester (Kyoto, Japan) and various hardness parameters were calculated.
III. RESULTS AND DISCUSSION
A. Powder X-ray diffraction studies
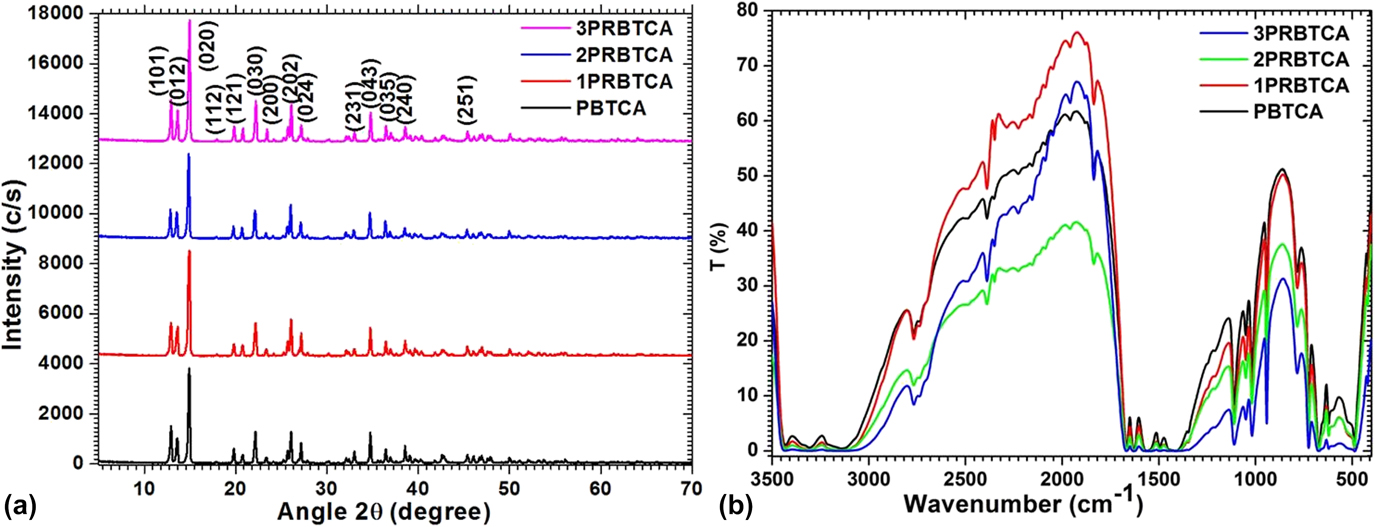
XRD patterns of pure BTCA and PRBTCA crystals are shown in Fig. 2(a). The intensity of diffraction peaks of dyed crystals was enriched and slightly shifted from main peaks showing the effect dye in the pure material by absorption. The measured data were polished and studied using POWDERX software and confirm that the crystals are orthorhombic and the calculated lattice parameters for both crystals are tabulated in Table I. Tabulated data show that the lattice parameters of BTCA are varied in the presence of PR dye and found to be in close agreement with the reported one.Reference Ganesh, Snehalatha Reddy, Shakir, Wahab, Bhagavannarayana and Kishan Rao15
(a) XRD patterns and (b) FTIR spectra of BTCA and PRCTA crystals.

Calculated lattice constants for BTCA and PRCTA crystals.

B. FTIR study
FTIR spectra of pure and PRBTCA samples were analyzed in the wavelength range of 4000–400 cm−1. Figure 2(b) displays FTIR spectra of both samples. In case of pure BTCA crystals at the higher wavelength region, several peaks are observed between 3000 and 3800 cm−1 and are due to N–H stretching. Absorption bands observed at 3500–2750 cm−1 are symmetric and asymmetric stretching modes of NH2 groups. Bands at 1495 and 1110 cm−1 are assigned to CN asymmetric and symmetric stretchings, one-to-one. The band at 1412 and 725 cm−1 is assigned to CS asymmetric and symmetric stretchings. From all these spectral assignments, it has been concluded that CN and CS stretching vibrations of thiourea are lifted toward larger and lesser frequencies. Henceforward, these observed core vibration modes indicate that the thiourea establishes coordinate bonds through sulfur. Whereas in dyed crystals, the higher wavelength region slightly shifted to the lower wavelength region giving a sign of dying in the pure material, along with a slight shift at the higher wavelength region, the functional groups of 3819 cm−1, 3689, 3547, 3111, and 3047 cm−1 are witnessed due to phenolic OH stretching vibrations and CH stretching vibrations, which indicate phenol groups and pure material. Similar observations were also recorded in our previous work on BTCA crystals.Reference Ganesh, Bhaskar Rao, Kishan Rao, Bhagavannarayana and Shkir14,Reference Ganesh, Snehalatha Reddy, Shakir, Wahab, Bhagavannarayana and Kishan Rao15
C. HRXRD analysis
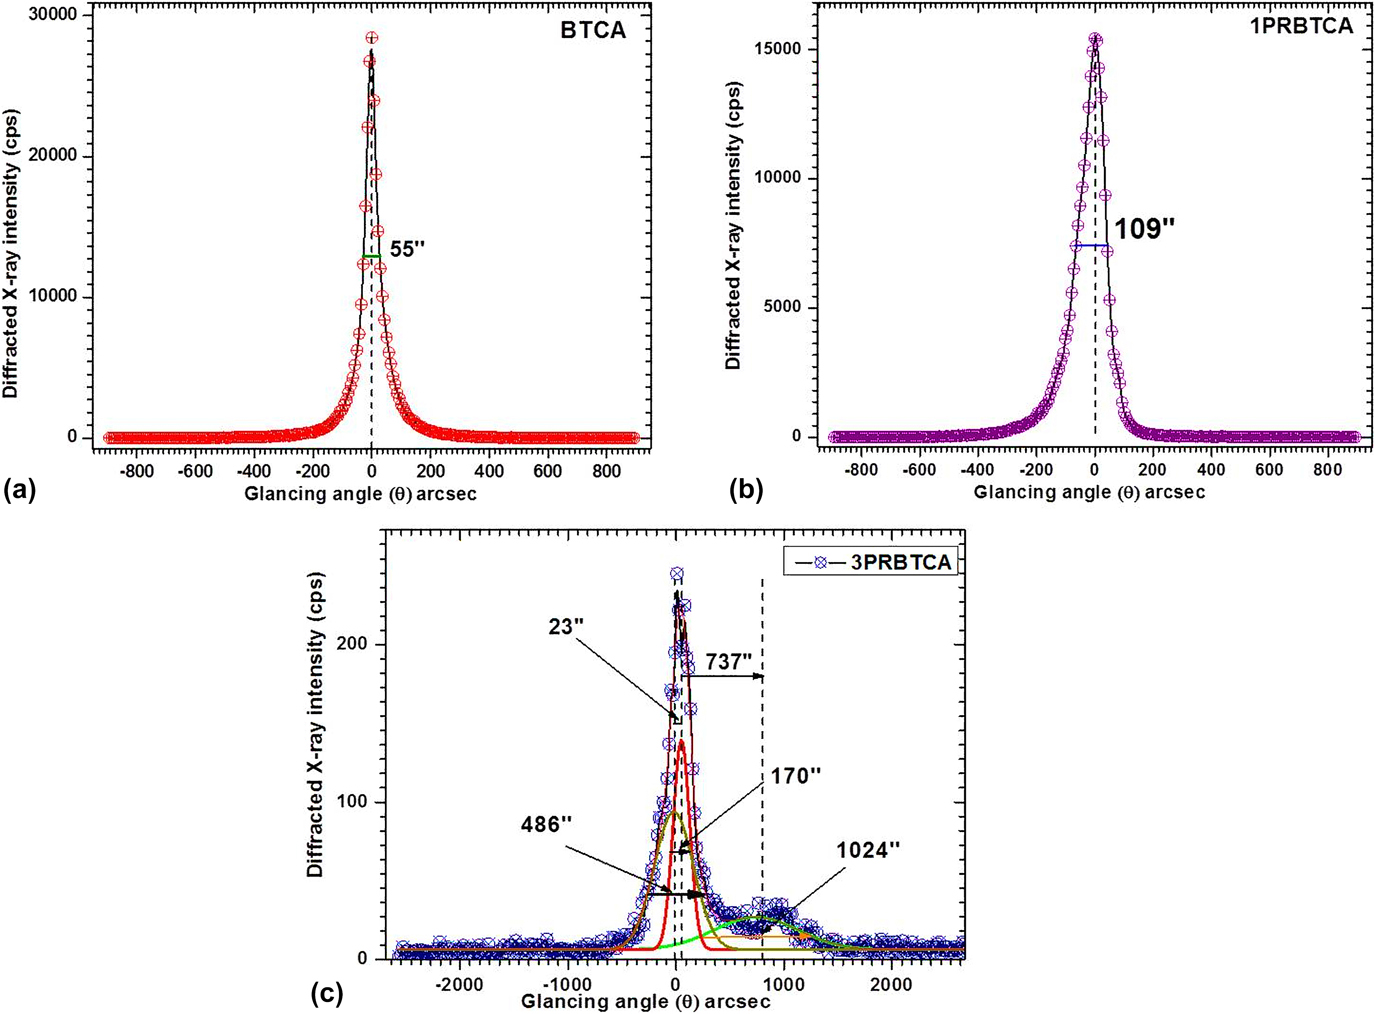
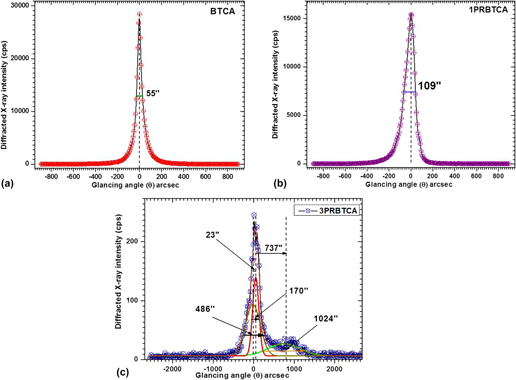
The analysis of full width at half maximum (FWHM) majorly determines the occurrence of defect centers and grain boundaries which assist to calibrate the crystalline purity of the crystal.Reference Shkir, Ganesh, AlFaify, Maurya and Vijayan13,Reference Anis, Shkir, Baig, Ramteke, Muley, AlFaify and Ghramh18–Reference Shkir, Ganesh, AlFaify, Yahia and Maurya20 Figures 3(a)–3(c) present the recorded HRXRD diffraction curve (DC) for (200) diffraction planes of pure, 1 mol%, and 3 mol% PR dyed BTCA single crystals. It may be mentioned here that the DC for the 2 mol% PR dyed BTCA crystal was found to be similar to 1 mol% PR dyed BTCA and hence is not given. It can be seen in the figure that the DC for pure BTCA contains a single peak with an FWHM of 55″, which is quite near to an ideally perfect single crystal permitting dynamical theory of X-ray diffraction.Reference Battermann and Cole21,Reference Shakir, Kushawaha, Maurya, Kumar, Wahab and Bhagavannarayana22 The sharp nature of diffraction peak intensity versus glancing angle curve demonstrates a very low density of point defects. The lower FWHM value for the grown pure BTCA crystals confirms that it is better than previous reports on BTCA.Reference Ganesh, Bhaskar Rao, Kishan Rao, Bhagavannarayana and Shkir14,Reference Kushwaha, Maurya, Haranath and Bhagavannarayana23 Hence, the BTCA crystal possesses better crystalline perfection which relates to better growth conditions. The DC for the 1PRBTCA crystal is shown in Fig. 3(b), which looks broader than that of the pure BTCA crystal. This shows that the presence of PR dye in BTCA increased the FWHM from 55″ to 109″ along with a clear asymmetry in the negative (−ve) side. This visible asymmetry peak broadening of the DC curve is increased due to PR inclusion in the BTCA lattice and hence indicates the presence of a vacancy type of defect in the 1 mol% PR dyed BTCA crystal. However, at 3 mol%, PR dye in the BTCA crystal leads to three diffraction peaks of FWHM ∼170, 486, and 1024″ [see Fig. 3(c)], which are observed by deconvolution of the DC and the convoluted curves/solid lines are found to be fitted well with experimental data points. These diffraction peaks show that the 3PRBTCA crystal contains a number of low angle structural grain boundaries whose tilt angles are mentioned in the DC [Fig. 3(c)]. The detailed explanation and possible reasons for observing the grain boundaries and subgrain mosaic blocks can be seen elsewhere.Reference Shkir, Ganesh, AlFaify, Black, Dieguez and Bhagavannarayana24 The HRXRD curve indicates that the crystals have good crystalline perfection and can be used for device fabrications.
HRXRD DCs for (a) BTCA, (b) 1PRBTCA, and (c) 3PRBTCA single crystals.

D. Optical studies
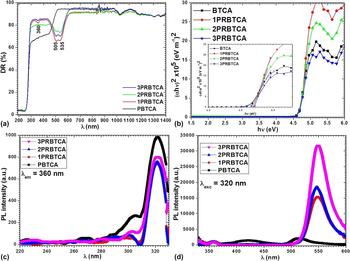
The interaction of the material with electromagnetic signal facilitates the promotion of electrons to allow energy states, which governs the optical transmittance in the material. Furthermore, the structural and crystalline defects also influence the optical transmittance of the crystal.Reference Mohd, Ganesh, AlFaify, Yahia and Mohd25–Reference Ramteke, Baig, Shkir, Kalainathan, Shirsat, Muley and Anis27 From the DR spectra of pure and PR dyed samples [Fig. 4(a)], the cut-off wavelength of all these samples are observed around 260 nm for all crystals. There is no absorption band in pure BTCA; however, in dyed samples, there are three absorption bands at around 360, 505, and 535 nm, which indicate that the dye has a strong effect on optical properties of BTCA crystals. Such signatures were also reported in other crystals.Reference Pritula, Gayvoronsky, Gromov, Kopylovsky, Kolybaeva, Puzikov, Kosinova, Savvin, Velikhov and Levchenko7,Reference Ganesh, Shkir, AlFaify and Yahia8,Reference Shkir12,Reference Shkir, AlFaify, Ganesh, Yahia, Algarni and Shoukry28–Reference Rajesh, Silambarasan and Ramasamy30 The Kubelka–Munk function [F(R)] of pure and dyed BTCA crystals was calculated using Kubelka–Munk relationReference Kubelka and Munk31:
 $$F\left( R \right) = {{{{\left( {1 - R} \right)}^2}} \over {2R}}\quad .$$
(a) DR spectra, (b) energy gap plot, (c) excitation, and (d) emission spectra of pure and dyed BTCA crystals.

Equation (1) in terms of F(R) is expressed as
 $$\alpha = {{F\left( R \right)} \over s}\quad ,$$
Here, α is the absorption coefficient and s is the thickness ∼2 mm. With the help of the above equation, the E g is computed using the following relation:
 $${\left( {\alpha h\nu } \right)^{{1 \over n}}} = {\left( {{{F\left( R \right)h\nu } \over s}} \right)^{{1 \over n}}}A\left( {h\nu - {E_{\rm{g}}}} \right)\quad ,$$
Here, symbols have general meanings and n = 1/2 has been taken for direct allowed transition in BTCA. Figure 4(b) shows the direct allowed transitions for pure and dye-doped samples, and the band gap values are found to be in the range of 4.6–4.8 eV. The values of E g is observed to be minutely enriched in the presence of dye and show that the grown crystals comes under high band gap materials category and may be applied in optoelectronic applications.Reference Shakir, Kushwaha, Maurya, Bhagavannarayana and Wahab32–Reference Shkir, Riscob, Hasmuddin, Singh, Ganesh, Wahab, Dieguez and Bhagavannarayana34
E. Photoluminescence studies
The Photoluminescence (PL) is the key technique to identify the electronic band structure and attributes of cationic/anionic defects associated with the material.Reference Ramteke, Anis, Baig, Shkir, Ganesh and Muley35 The fundamental process of PL involves the photo-excitation of the material at specific energy and tracking down the emitted energy during the photorelaxation process. This eventually serves the purpose to analyze the color centered behavior of the given material.Reference Anis, Hussaini, Shkir, AlFaify, Baig and Muley36,Reference Anis, Ramteke, Shirsat, Muley and Baig37 Figures 4(c) and 4(d) display PL excitation (λexc = 320 nm) and emission (λem = 360 nm) spectra for BTCA, 1PRBTCA, 2PRBTCA, and 3PRBTCA crystals at 300 K, respectively. PL spectra of the pure crystal possess three emission bands at around 360 (UV-A emission band), 425 (violet blue emission band), and 520 nm (green emission band), and in dyed crystals, only two emission bands occur around 360 nm (UV-A emission band) along with a robust green emission band at 550 nm. PL intensity is found to be enriched in dyed crystals, which indicates the presence of defects, which act as color centers.
F. Thermal analysis
The DSC thermographs of title compounds were recorded and heat anomalies of the melting points were identified. The fine powdered sample of the grown crystals (2.5 mg) was used for the measurement of pure and dyed crystals. Figure 5 shows the thermal profiles of pure and dyed samples. From these graphs, the melting points of pure and dyed samples are observed by a sharp single endothermic peak at nearly 175 ± 2 °C, whereas in case of the 2% PR dyed sample, there is a broad decomposition peak at 136 °C. In case of 2% PR dyed sample, the broad peak at 136 °C is due to dye molecules in BTCA which may increase the enthalpy of the material and increase the crystallinity. With increasing temperature, there are some peaks in the range of 195–270 °C, which may be attributed due to the complete melting of remaining substances. The observed melting points of the present material are quite high compared with the pure material (viz. ∼155 °C),Reference Ganesh, Snehalatha Reddy, Shakir, Wahab, Bhagavannarayana and Kishan Rao15 which indicates that the dye enhances the thermal stability of BTCA crystals except for 2% PR dyed BTCA. Sample 2% PR dyed BTCA needs further investigation in terms of thermal properties and in progress.
DSC curves for pure and dyed BTCA crystals.

G. Etching studies
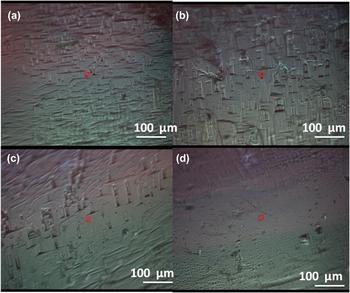
The most ideal material for device fabrication is those which possess less defects. The etching study thus reveals the typical etch pattern (spiral, triangular, rectangle, square, oval, etc) associated with the material.Reference Anis, Baig, Pandian, Ramasamy, AlFaify, Ganesh, Muley and Ghramh38,Reference Azhar, Rabbani, Shirsat, Hussaini, Baig, Ghramh and Anis39 The quality of the grown crystal is assessed by a simple and accurate etching technique; this technique reveals the information of the number of dislocations present in a crystal which is directly related to the number of physical properties like strength, plasticity, fracture toughness, and brittleness of the material.Reference Sangwal40,Reference Shekar, Nagaraju, Ganesh and Rao41 Hence, it is very important to determine the density and distribution of dislocations in a crystal. In the present work, well-faceted good quality crystals were chosen for chemical etching. To reveal the dislocations, a number of etchants were tried with different combinations of chemicals like acetic acid, methanol, ethanol, and combination of their mixtures. Finally, good etching of elongated squares was observed with methanol and methanol + CdCl2 (0.01 g) with the shape of Ref. Reference Ganesh, Snehalatha Reddy, Shakir, Wahab, Bhagavannarayana and Kishan Rao15. When the grown samples were etched with methanol, the observed etch pits were not clear but when small amount of CdCl2 (0.01 g) is added, the observed etch pits are clear and well oriented. The reason for this is that the small amount of CdCl2 acts as an inhibitor for rapid dissolution of the surface. Furthermore, the successive etching technique is also applied on pure and dyed samples with constant etching timings, i.e., 5 s. From this study, it is interesting that the number of etch pits is lower in dyed crystals, which indicates less dislocation. Figures 6(a)–6(d) show the photographs of etch pit patterns of pure BTCA and PRBTCA at constant etching time, i.e., 5 s, and the average etch pit density is in the range of 4.5 × 10³/cm2 to 3.0 × 10²/cm2. The obtained etch pit density suggests that the PRBTCA crystals are of improved quality with less dislocation density and can be used for optoelectronic device applications.
Etch pit patterns of (a) BTCA, (b) 1PRBTCA, (c) 2PRBTCA, and (d) 3PRBTCA crystals after 5 s.

H. Microhardness studies
The hardness of the single crystal is a significant key property for the usage of the material for various applications. A microhardness test was used to determine the different strength parameters of the grown crystals. A Leitz-Wetzlar microhardness tester with variable loads of 10–100 g fitted with a diamond indenter is used for the calculation of various hardness parameters. Transparent and crack-free (100) face of pure and dyed BTCA crystals were mounted on the base of the indenter tester for static indention time 5 s, and average diagonal lengths (d) for the each indentation load were calculated. Using these indentation diagonals, the H v is calculated using the following equationReference Karan and Gupta42:
 $${H_{\rm{v}}} = 1854.4{P / {{d^2}\quad ,}}$$
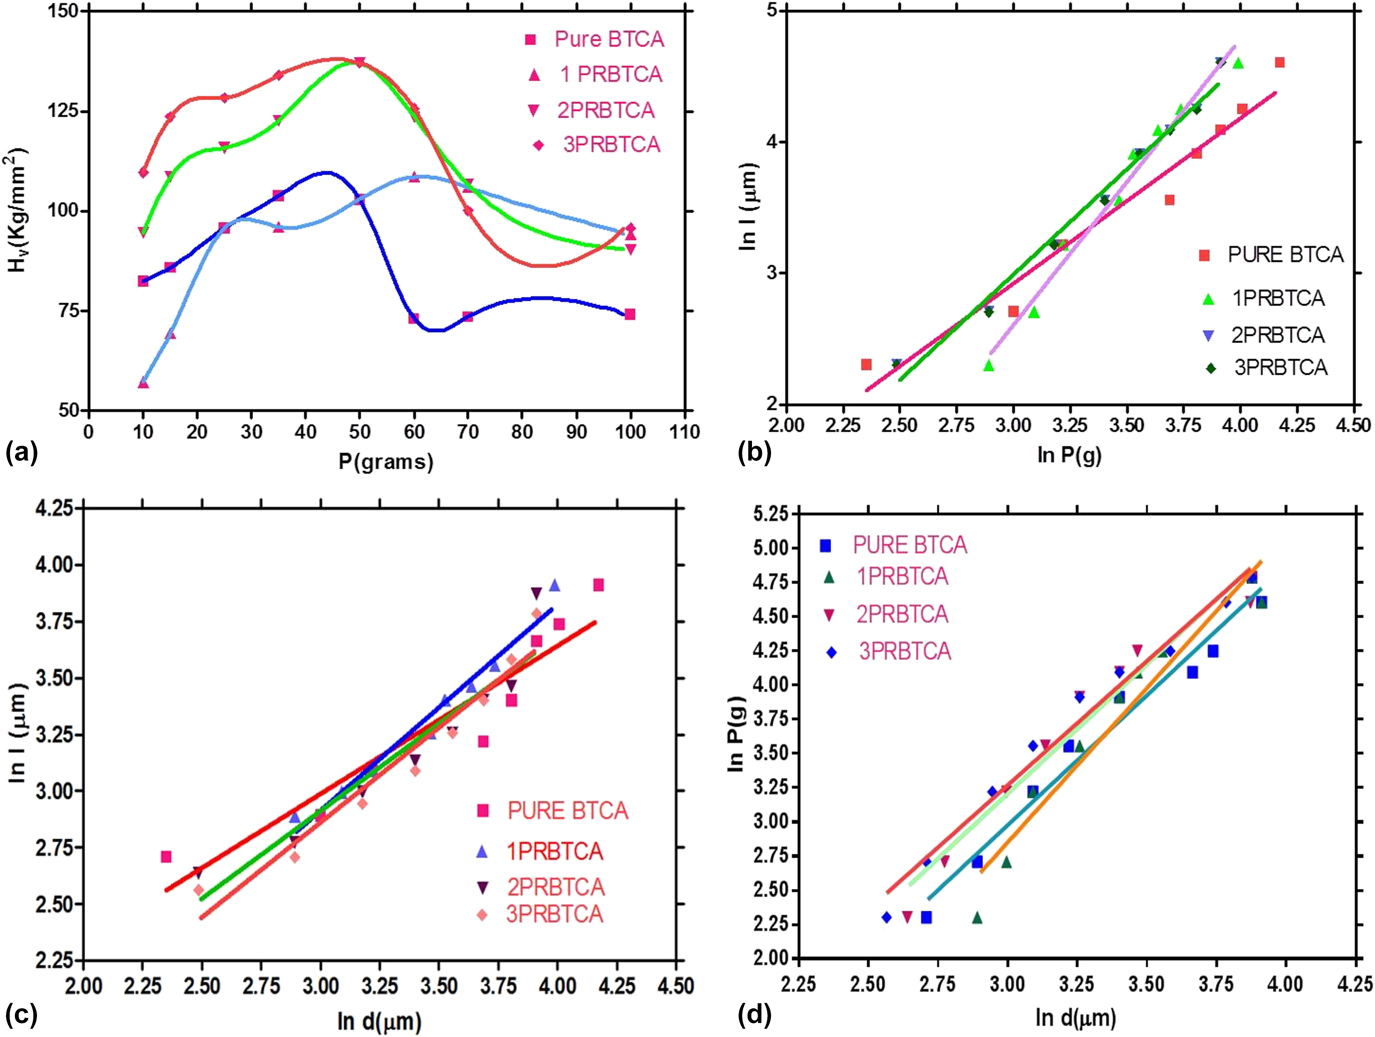
where P is the load (in g) and d (μm) is the diagonal length of indentation impression. Figure 7(a) shows plots between the variations of H v with applied load (P). From these plots, it is clearly visible that the H v increases with P, which indicates that the present crystals are showing reverse indentation size effect (RISE).Reference Sangwal43,Reference Ganesh, Shkir, Husain, Singh, Rao and Rao44 In the present case, the load variation of hardness is calculated up to a load of 100 g, with further increasing the load cracks appeared at the edge of diagonal length, which indicates the plastic deformation samples [Fig. 7(b)]. To obtain the nature of samples and the relation between cracks formed at the edge of the impressions, the length (l) of radial cracks was studied as the function of P and d using the following relationsReference Sangwal43,Reference Sangwal, Kothari and Arora45,Reference Shkir, Ganesh, AlFaify, Black, Dieguez and Maurya46 :
 $$l = {C_1}P_1^m\quad ,$$
and
 $$l = {C_2}d_2^m\quad ,$$
where C 1, C 2 and m 1, m 2 are constants, the values of m 1, m 2, and calculated from the plots between log l and log P, log d plots [Figs. 7(c) and 7(d)]. From these measurements, the obtained values of m 1 and m 2 provide the work-hardening coefficient (n) of studied samples by the following equation:
 $$n = {{{m_2}} / {{m_1}}}\quad .$$
(a) H v versus P, (b) ln p versus ln l, (c) ln d versus ln l, and (d) ln d versus ln P of pure and dyed BTCA crystals.

The “n” of present samples were found to be 2.1 to 1.85 for pure and dyed samples, indicating that these belong to the soft material category. However, the low n values in case of dyed samples are attributed to the dye, making the doped crystals harder compared to pure crystals.
Further to analyze the RISE effect in detail, we applied some standard approaches as followed by many researchers in the literature on various types of crystals.Reference Shkir, Ganesh, AlFaify, Black, Dieguez and Bhagavannarayana24,Reference Sangwal43,Reference Sangwal, Surowska and Błaziak47–Reference Riscob, Shkir, Ganesh, Vijayan, Maurya, Kishan Rao and Bhagavannarayana50 Some of those laws are studied and discussed in following sections.
1. Meyer’s law
Normal and reverse ISEs were simply analyzed by Meyer’s law, and this law provides the relation between P and d by the following relationReference Meyer and Ver51:
 $$P = A{d^n}\quad ,$$
where P, d, n, and A have their usual meanings. The value of n is determined from the plots of ln P versus ln d. The exponents n < 2 and n > 2 show NISE and RISE behaviors, respectively, whereas n = 2 shows load independent hardness from Kick’s law.Reference Meyer and Ver51 Figure 7(d) shows ln P versus ln d plots of the present crystals; from these plots, the n values are found to be 2.02 to 2.21, which are very close to the work-hardening coefficient values calculated in Sec. III.H, which indicates the validity of Meyer’s law. The higher values of n also indicate that present crystals are exhibiting RISE behavior. Although, Meyer’s law succeeded to explain RISE behavior, nonetheless it is convenient for lower loads. To understand the RISE effect for total load applied regions, we applied the Hays–Kendall approach, which determines the exact behavior of the samples.
2. Hays–Kendall’s law
In the Hays–Kendall approach, we use the following relation to explain the nonlinear behavior of hardness of pure and dyed BTCA crystals,Reference Hays and Kendall52
 $$P = W + {A_1}{d^2}\quad ,$$
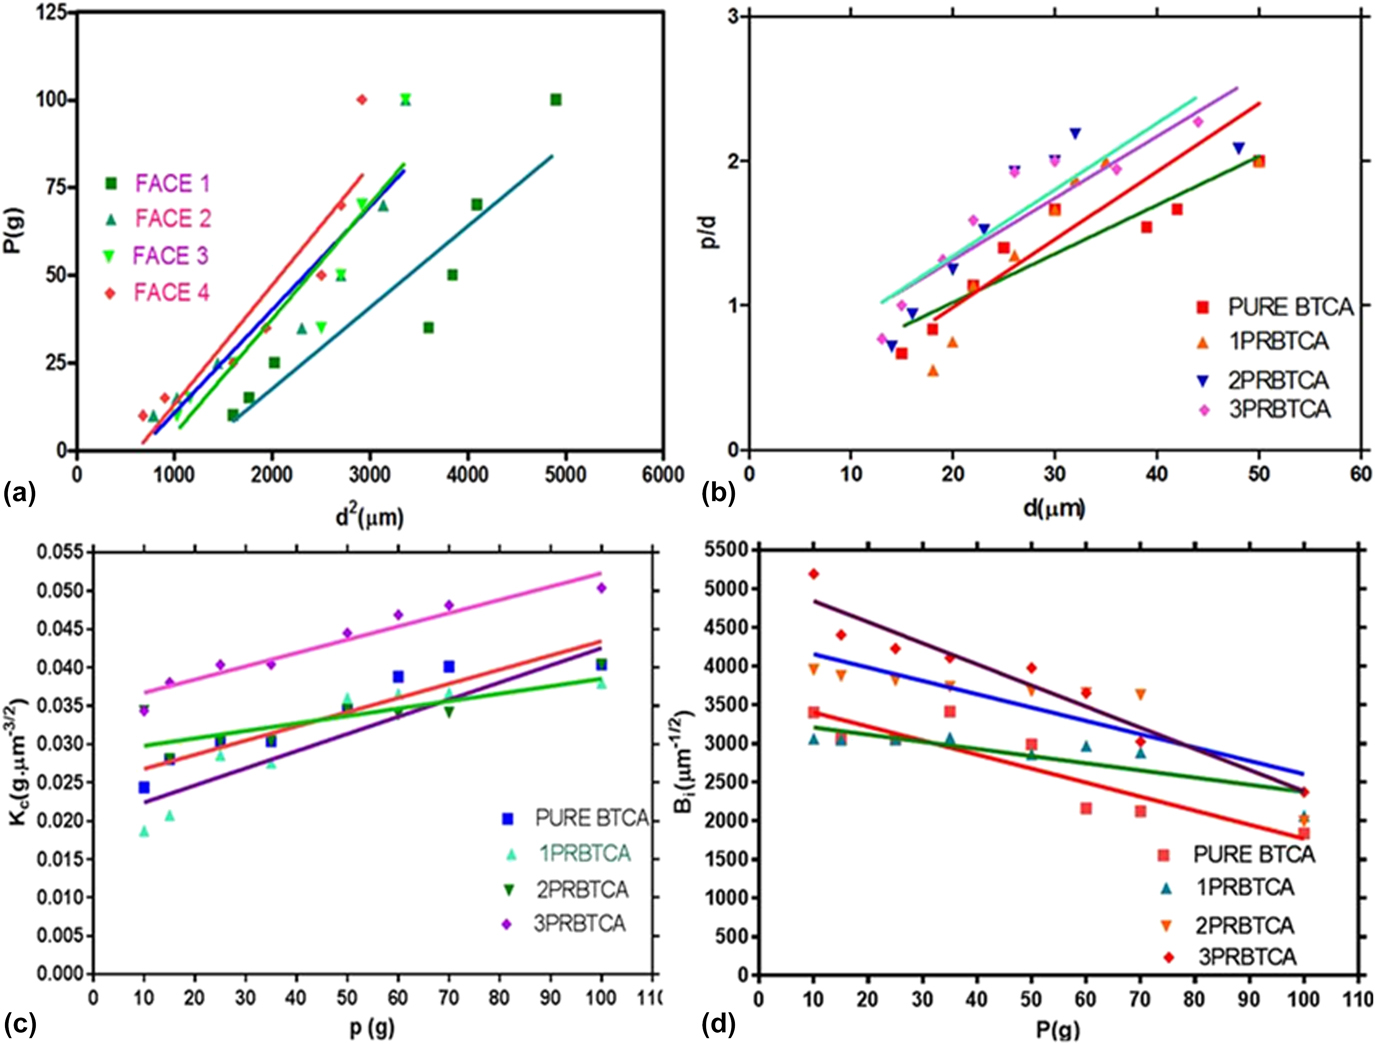
where W and A 1 are calculated from P versus d 2 [Fig. 8(a)] plots, which are considered as minimum load required for plastic deformation and load sovereign constant, respectively. High negative values of W indicate RISE behavior, whereas positive values indicate NISE behavior. In the present case, the W values of both the pure and dyed samples are negative, thus indicates that the material exhibits RISE behavior. The corrected hardness H 0 is also calculated from the following relation:
 $${H_0} = 1854.4{A_1}\quad .$$
(a) P versus d 2, (b) P/d versus d, (c) K c versus P, and (d) B i versus P plots for pure and dyed BTCA crystals.

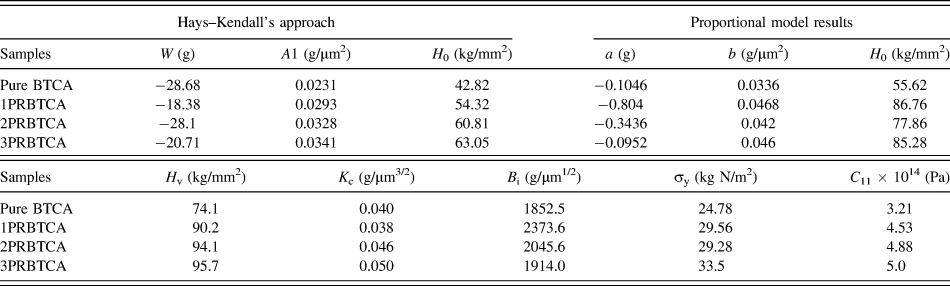
The values of W and H 0 for pure and dyed BTCA crystals are listed in Table II.
Calculated microhardness parameters along the (100) plane.

3. Proportional specimen resistance model
The PSR model is an effective model to determine the hardness in load-dependent and load-independent regions. This law gives relation between P and d asReference Li and Bradt53–Reference Shakir, Ganesh, Wahab, Bhagavannarayana and Rao57
 $$P = ad + b{d^2}\quad ,$$
where the parameters a and b give elastic and plastic behaviors of the sample.Reference Sangwal, Hordyjewicz and Surowska54,Reference Pollock, Maugis, Pethica, Blau and Lawn58–Reference Shakir, Ganesh, Riscob, Maurya, Wahab, Bhagavannarayana and Kishan Rao61 The term ad is related to surface energy of the specimen for distorted surface layers of the material. The values of b is determined from plot P/d versus d [Fig. 8(b)] and a is calculated from a = P/d − bd. It is observed that the a > 0 value material possesses NISE and samples, which obey the RISE behavior, producing a < 0.Reference Li and Bradt53,Reference Sangwal and Kłos55 According to Li and Bradt, if the specimen shows a perpetual plastic distortion also show a well-defined crack profile around the indentation impression, which indicates RISE behavior. In the present case, all the samples display well-defined cracks above 100 g, which confirms the RISE. Obtained values of a, b, and indentation-size independent hardness H 0 are listed in Table II.
Similarly, the fracture toughness (K c) and brittle index number (B i) were calculated by using relations as given below and their micrographs are given in Figs. 8(c) and 8(d). The K c and B i were determined using standard relations P/l 3/2 = βoK c; l ≥ d/2, where K c is in (g/µm)3/2, l in microns, and βo is the indenter constant (=7).Reference Lawn and Fuller62 The brittle index number (B i) is calculated from fracture toughness value B i = H v/K c.Reference Townsend and Field63 The yield strength σy = H v/2.9 [1 − (n − 1)]{12.5 (n − 2)/1 − (n − 2)}n−2 (for n > 2)Reference Cahoon, Broughton and Kutzak64 and also elastic stiffness constants for pure and dyed BTCA crystals were calculated form Wooster’s empirical relation C 11 = (H v)7/4.Reference Wooster65 The elastic stiffness coefficient gives the clue of bonding between the consecutive atoms associated in the molecule.Reference Baig, Anis, Kalainathan, Babu and Muley66 Calculated values of all mechanical parameters are given in Table II. The present data on pure and dyed BTCA crystals are showing improved results compared to different dopants on these crystals.Reference Wooster65,Reference Rajesh and Ramasamy67–Reference Meenakshisundaram, Parthiban, Madhurambal, Dhanasekaran and Mojumdar69 Hence, these crystals may replace many standard materials for various device applications.
IV. CONCLUSION
For the first time, the growth of large size single crystals (∼30 × 10 × 6 mm) of BTCA are grown in the presence of PR dye by the slow evaporation solution technique. XRD peaks confirm the decent crystalline nature of grown crystals and lattice parameters are varied. The FTIR studies confirm the formation of BTCA. The HRXRD studies confirm that the grown crystals possess good crystalline perfection and can be used for device fabrications. Solid-state optical studies were done through diffuse reflectance measurement in which three absorption bands are occurred at around 363, 505, and 535 nm. The presence of extra absorption bands indicates the dye interaction with BTCA. The optical band gap was calculated using Kubelka–Munk relation and found to be ∼4.6 eV. However, no major change was observed in the value of band gap. The photoluminescence excitation and emission spectra were recorded. The etching study indicates that the density of etch pits are reduced from 4.5 × 10³/cm2 to and 3.0 × 10²/cm2 in dyed crystals. The hardness of BTCA is found to be modified due to dye.
ACKNOWLEDGMENT
The authors would like to express their gratitude to Research Center for Advanced Materials Science-King Khalid University, Saudi Arabia, for support.