


Introduction
Natural climate variability over much of Antarctica is still poorly known, both because Antarctic instrumental records are short (starting in 1956-57) and because such records are restricted to the coastal zones. Longer records are available from the Antarctic Peninsula and South Orkney Islands, but these show little correspondence with records from continental Antarctica and therefore cannot be used to extend the short instrumental records (Reference Raper, Wigley, Mayes, Jones and SalingerRaper and others, 1984).
Ice-core records remain the most valuable tool for deriving past climate data in Antarctica. By selecting a suitable drill location it is possible to retrieve information extending back several hundred thousand years (e.g.Reference JouzelJouzel and others, 1993). At the other extreme, it is possible to collect high-resolution information on seasonal time-scales with cores from high accumulation areas (e.g. Morgan and Van Ommen, 1997). The well-established relation between air temperature and snowfall isotope chemistry permits us to use ice cores to extend the instrumental records back in time and expand the spatial coverage.
Nevertheless, basic glaciological and climatological data are still lacking for large areas of Antarctica; one such area is the interior of Dronning Maud Land (DML). During the 1996-97 field season the European Project for Ice Goring in Antarctica (EPIGA) pre-site surveying traverse, supported by the Norwegian Antarctic Research Expedition (NARE), worked in the area between 70° S, 5° E and 75° S, 15° E in DML (Fig. 1). The aim of the traverse was to collect glaciological and meteorological data which would help in selecting a drill site for the EPIGA DML deep ice core. Details of the traverse and field methods are described in Reference Winther and WintherWinther and others (1997). The spatial variability of some of the climate variables collected along the traverse are presented and discussed in Reference Van den BroekeVan den Broeke and others (1999).
Map of the field area in eastern DML with the core sites marked. Core-site data are presented in Table 1.
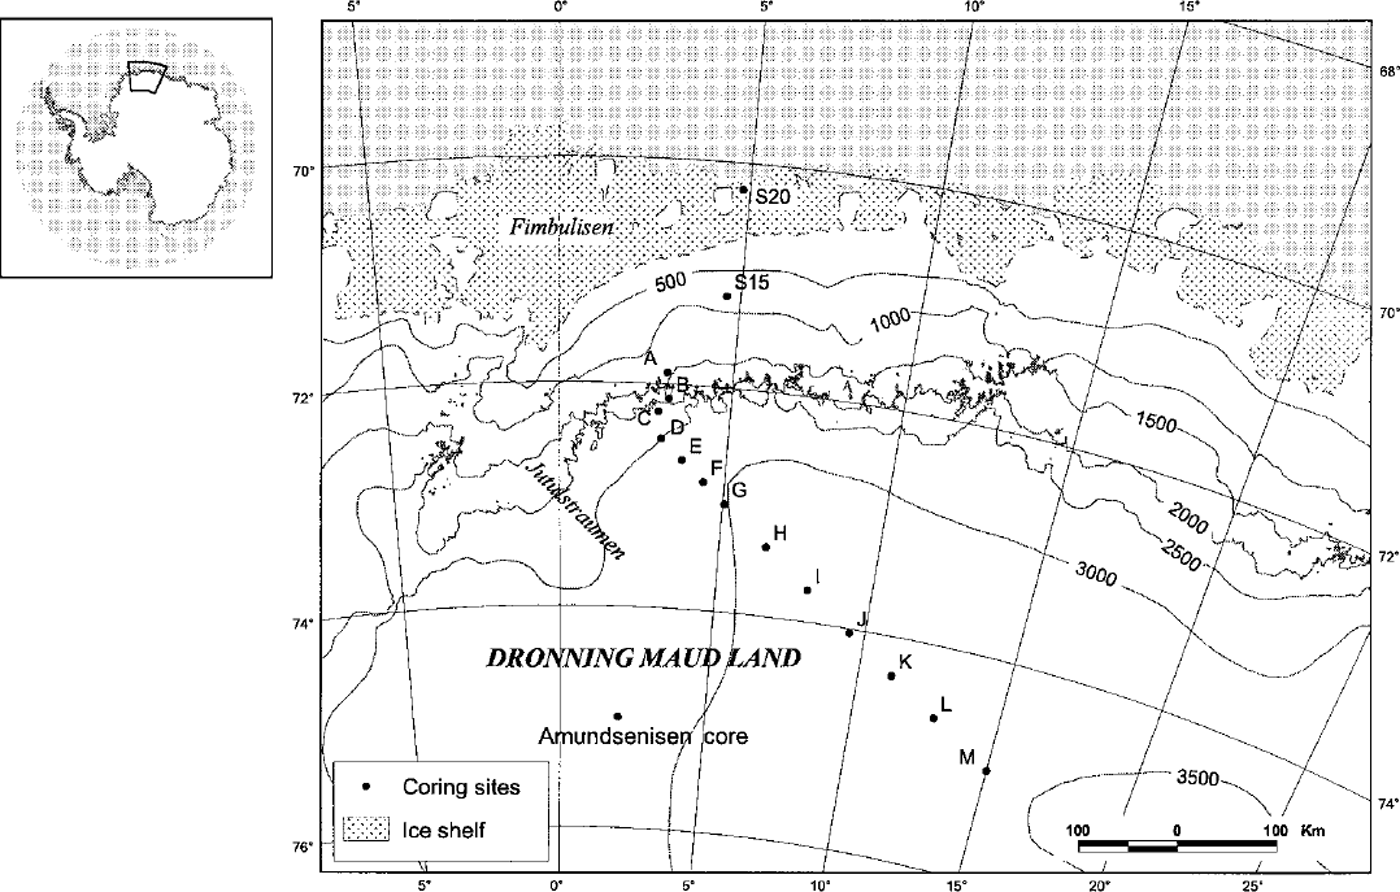
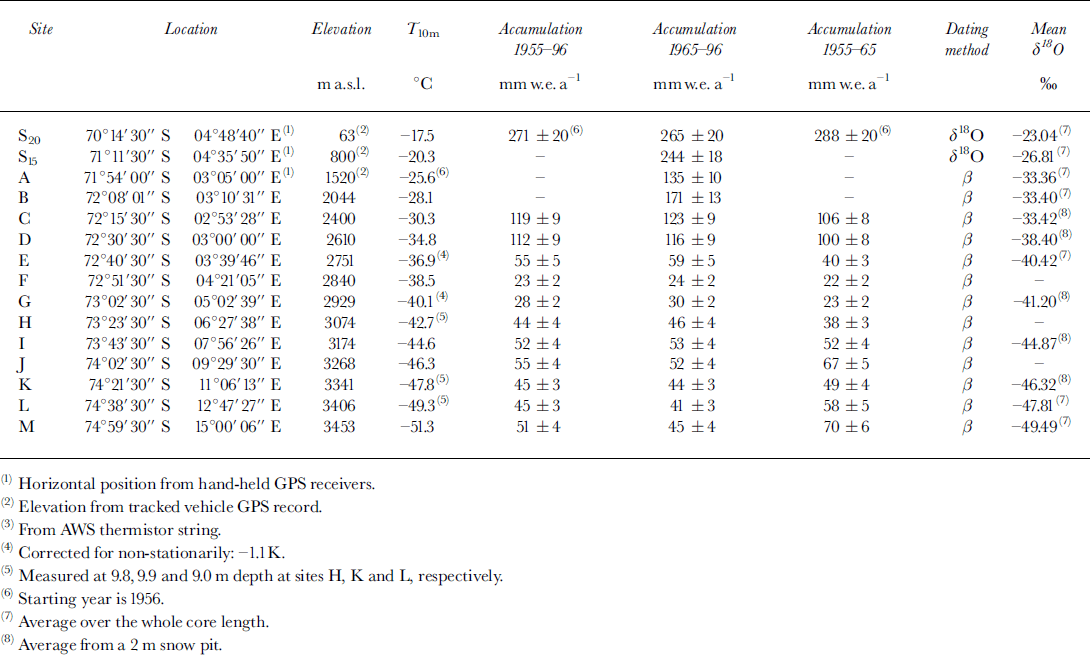
In this paper we present accumulation and stable-isotope data obtained from some of the 10 and 20 m deep firn cores obtained in 1996-97 between the coast and 600 km inland (to 3450 m a.s.l.) (Fig. 1; Table 1). In the discussion of the data we also include a firn-core record from Amundsenisen (75° S, 2°E at 2900 ma.s.l.; Fig. 1), obtained during the Swedish Antarctic Research Programme in 1991-92 (Reference Isaksson, Karlen, Gundestrup, Mayewski, Whitlow and TwicklerIsaksson and others, 1996). The Amundsenisen core site is located about 300 km west of core M and should be under similar climatic influences.
Sites for snow cores including accumulation and oxygen-isotope data
Dating
The cores were dated using the known time horizons 1964-65 and 1954-55 from the nuclear bomb tests (Fig. 2). All the cores except S15 and S20 were analyzed for /3 radioactivity in Grenoble, France, using methods described in Reference Pourchet, Pinglot and LoriusPourchet and others (1983).
The ECM (a) and total /3 activity (b) records from core M. The identified distinctive volcanic eruptions are indicated in the ECM record (running mean).
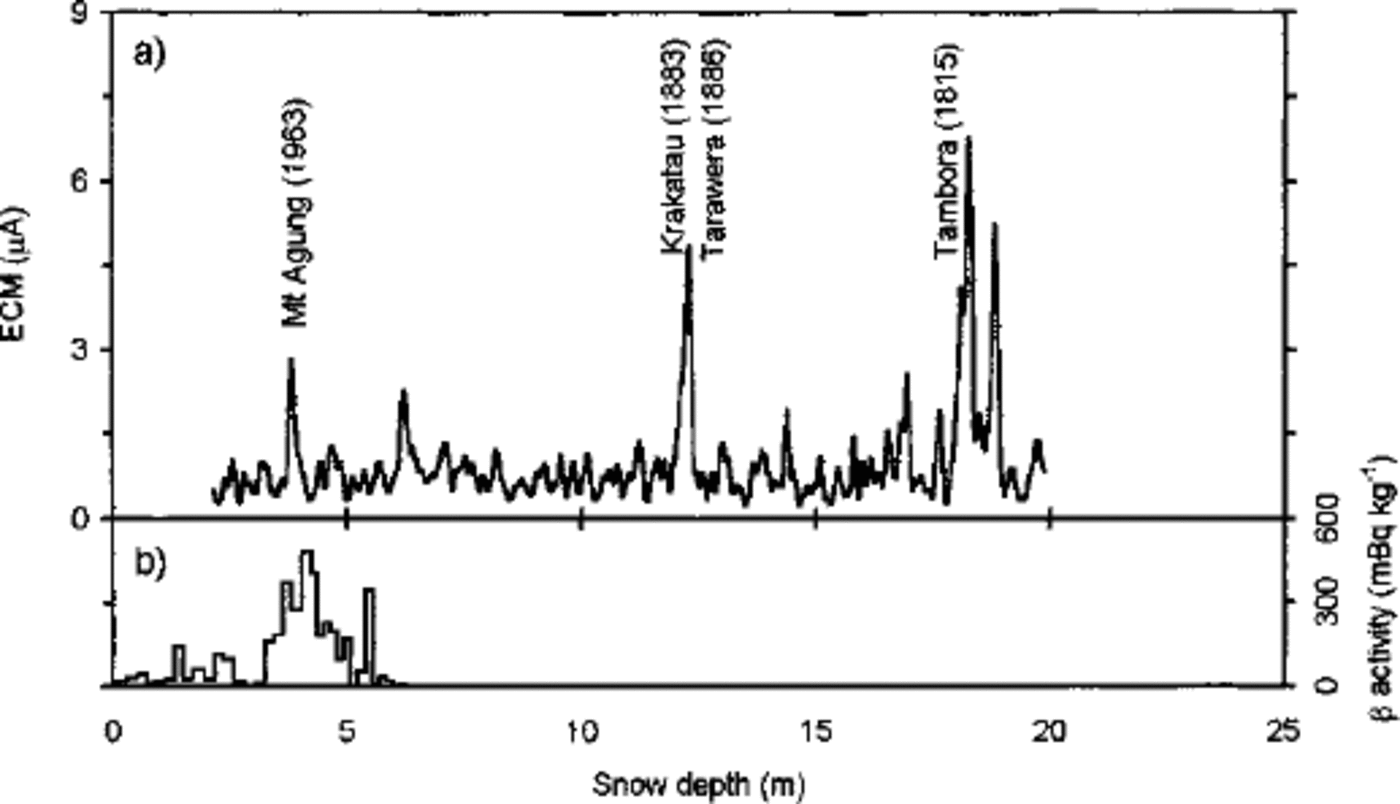
Electrical conductivity measurement (ECM) analysis was performed on all the cores. Horizons of increased conductivity were assumed to represent the eruptions of Mount Agung (1963), Krakatau (1883), Tarawera (1886) and Tambora (1815). These reference horizons were used as a complement to the total (3 activity measurements and for dating the cores beyond the 1954-55 layer (Fig. 2). The ECM records were obtained in a cold room using the method for ice developed by Reference HammerHammer (1980). Measurements were made under constant-temperature conditions (-15°G) and with a constant applied voltage of 500 V which is lower than in most systems. In our ECM system we found that using higher voltage produced a noisier record and we therefore chose to use the lower setting. A fresh surface was cut in the firn with a microtome knife, and the sliding speed of the electrode was controlled manually. Each core piece was measured several times to ensure the reproducibility of the experiment.
Seven of the cores were analyzed for oxygen isotopes at the University of Copenhagen. Core S20 was sampled with 40-50 mm resolution, S15 with 50 mm and cores A,B,E,L and M with 30 mm. Seasonal variations in the oxygen-isotope stratigraphy and the ECM record are used to date the two coastal cores S15 and S20. Core S20 from the most coastal site at Fimbul Ice Shelf is dated back to 1955.
No reference horizons before the 1954-55 layer could be found in the ECM records from cores E and L. Therefore, dating of cores E and L back to about 1920 was done using the accumulation rate obtained between the radioactive layers and assuming constant accumulation throughout the record.
The dating error is estimated to be ± 3 years for cores S15 and S20 (based on ambiguities in the δ180 stratigraphy), ±2 years at the reference horizons for the cores dated with total /3 activity (based on the sample size and annual accumulation rate) and ±2 years for the volcanic layers in core M dated with ECM. The dating error for the period before 1954-55 in cores E and L may be even larger because of the lack of time control.
All available accumulation and oxygen-isotope data are presented in Table 1 together with the core-site information. In the following discussion of the data, we distinguish between cores from the ice shelf (core S20), the coastal zone (cores S15, A, and B) and the polar plateau (cores E, L and M).
Oxygen-Isotope Data
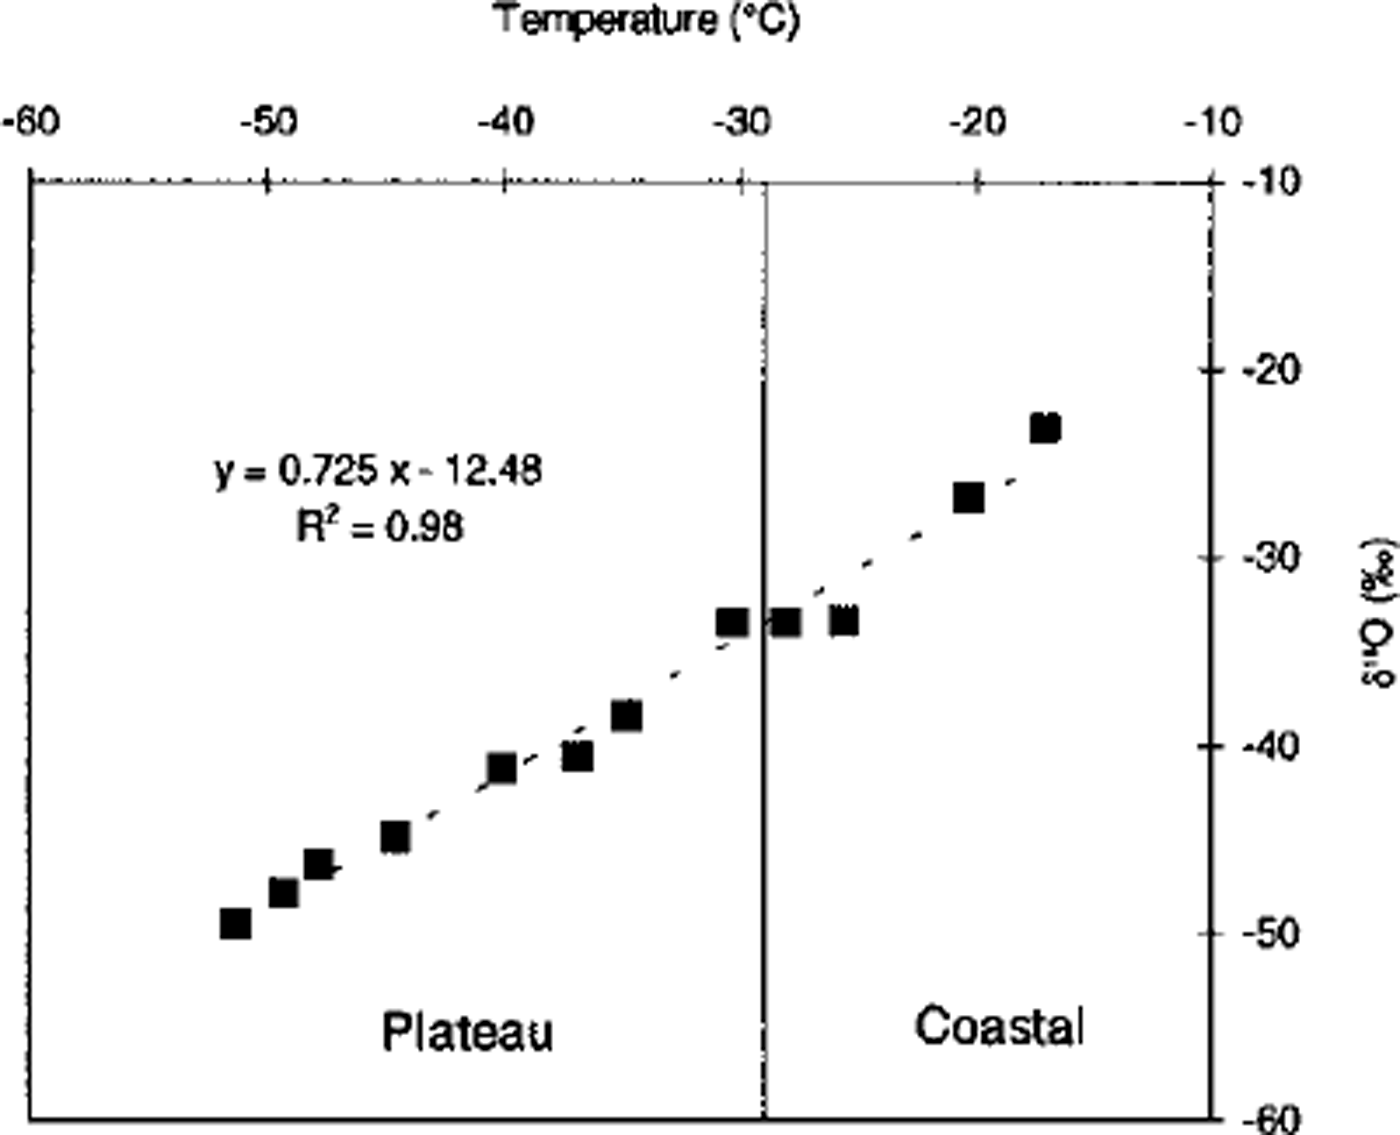
Reliable transfer functions are necessary when translating ice-core records into climate data. The temperature vs δ180 relationship is empirical (Reference DansgaardDansgaard, 1964) and many factors can influence the content of δ180 in the snow, such as change of moisture source, distance to moisture source and transportation history. Using oxygen-isotope records as proxy-temperature records requires knowledge of the specific temperature-,δ18O relationship for a particular area. Because of the empirical nature of this relationship the temperature–δ18O gradient can provide insight into some of these processes (see, e.g., Reference GrafGraf and others, 1994). We have established a gradient for this area using 10 m borehole temperatures and the mean δ180 from shallow pits and cores (altogether 12 sites) along the traverse (Fig. 3). The temperature was measured with a thermistor cable which was left in the borehole overnight (Reference Winther and WintherWinther and others, 1997). The gradient for this area is 0.73‰ "CT1 (R2 = 0.98) (Fig. 3) which is very close to the gradient of 0.75‰ "CT1 proposed for East Antarctica by Reference Lorius and MerlivatLorius and Merlivat (1977). However, since the temperature-,δ18O relationship using this method is a spatial gradient based on the current conditions, it may not be valid for other time periods, a problem that has been discussed by Reference JouzelJouzel and others (1997). Because of the lack of a better method we choose to use the spatial gradient but with caution.
The mean δ18O datafrom 12of the sites (S20,S15,A,B, C D, E, G, I, K, L and M) vs the 10 m core-hole temperature along the travel route. Some of the values are the mean from 2 m deep snow pits, and others from 10-20 m cores (see Table 1).
Polar plateau
We analyzed three cores from the polar plateau (E, L and M) for oxygen isotopes (Fig. 4). However, the low accumulation rate makes it impossible to count annual layers using ,5180 peaks; there are simply too many missing layers. Therefore we have interpolated the time-scale between the stratigraphic marker horizons. The longest record, from core M, extends back beyond the Tambora eruption in 1815 (Fig. 2).
The δ18O stratigraphy from four cores from the polar plateau. Cores E, L and Mare from this work, and the other 8180 record is from Amundsenisen, western DML (Reference Isaksson, Karlen, Gundestrup, Mayewski, Whitlow and TwicklerIsaksson and others, 1996). On the Amundsenisen core, major ions were analyzed and annual layers identified. The time-stratigraphic markers from (3 activity, ECM and the mean line are indicated. The records have been smoothed with a running mean, equivalent to 3years.
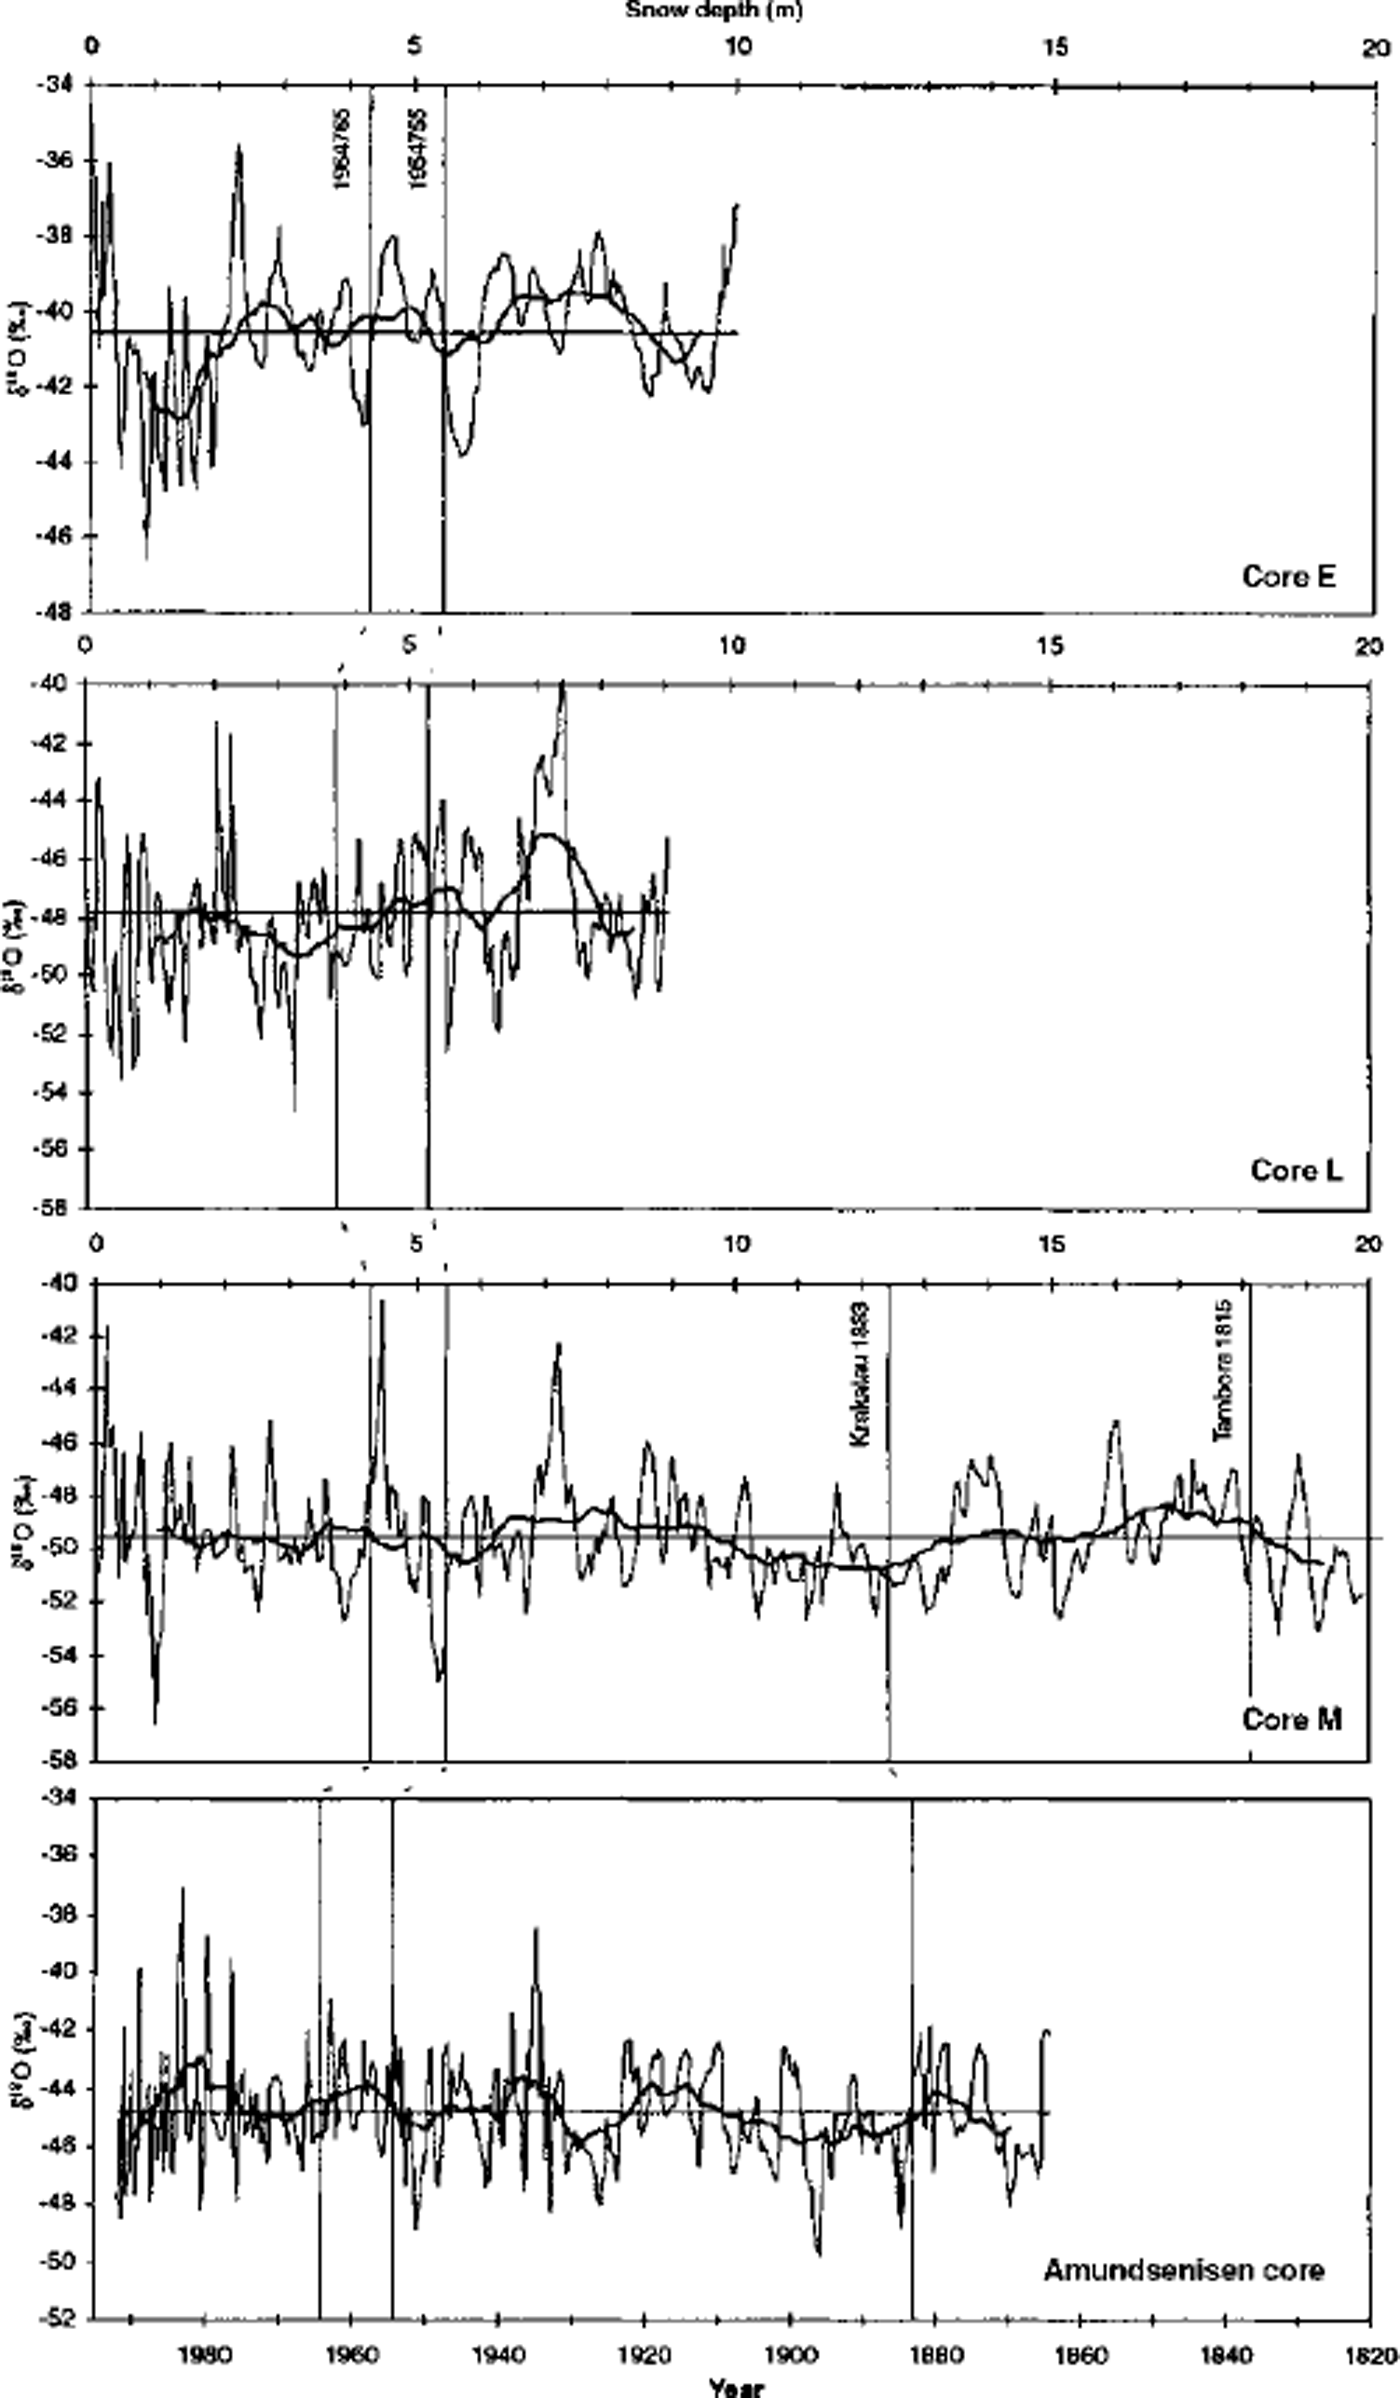
The δ180 record in core M suggests that temperatures were above average for most of the period 1820-60. A cold period begins before the Krakatau eruption (1883) and continues until the beginning of 1900 (Fig. 4). This cold period is also evident in the core from Amundsenisen, but here it begins at the time of the eruption. Overall, the multi-year patterns in the δ180 records from these two cores are similar.
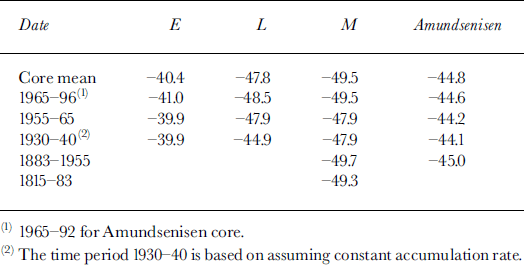
There is a pronounced isotopic warm event in cores L and M around 7.5 m, which would correspond approximately to 1930-40 (Table 2), a period known to have been particularly warm from Southern Hemisphere temperature records (Reference Jones and BriffaJones and Briffa, 1992). This apparent warming is also seen in the Amundsenisen record, but is less distinct.
δ18O values for the different time periods established by the ECM and (3 activity dating methods
Gores E, L and M all indicate that the last few years have been some of the warmest during the past century. There is no temperature record available from the nearby Sanae station after 1992, but our coastal records (which are discussed below) and oxygen-isotope data from western Fimbul Ice Shelf (Reference MelvoldMelvold, 1999) also indicate a temperature increase during the last 3 years.
The oxygen-isotope record from Amundsenisen indicates a temperature increase of about 0.8°C since 1865 (Reference Isaksson, Karlen, Gundestrup, Mayewski, Whitlow and TwicklerIsaksson and others, 1996). Also the oxygen-isotope record from core M indicates a temperature increase equivalent to almost 1°C since about 1883. This is more than the overall warming trend of 0.5°C in the Southern Hemisphere instrumental records since 1880 (Reference Jones and BriffaJones and Briffa, 1992) but in accordance with estimates based on information from early expeditions to and around the continent (Reference JonesJones, 1990). In a review of Little Ice Age conditions on the Antarctic continent, Reference Mosley-Thompson, Bradley and JonesMosley-Thompson (1992) did not find a persistent pattern for the whole continent, but both oxygen-isotope and dust data point towards cooler temperatures on the polar plateau during much of the time period referred to as the Little Ice Age (approximately AD 1500-1880).
Coastal zone
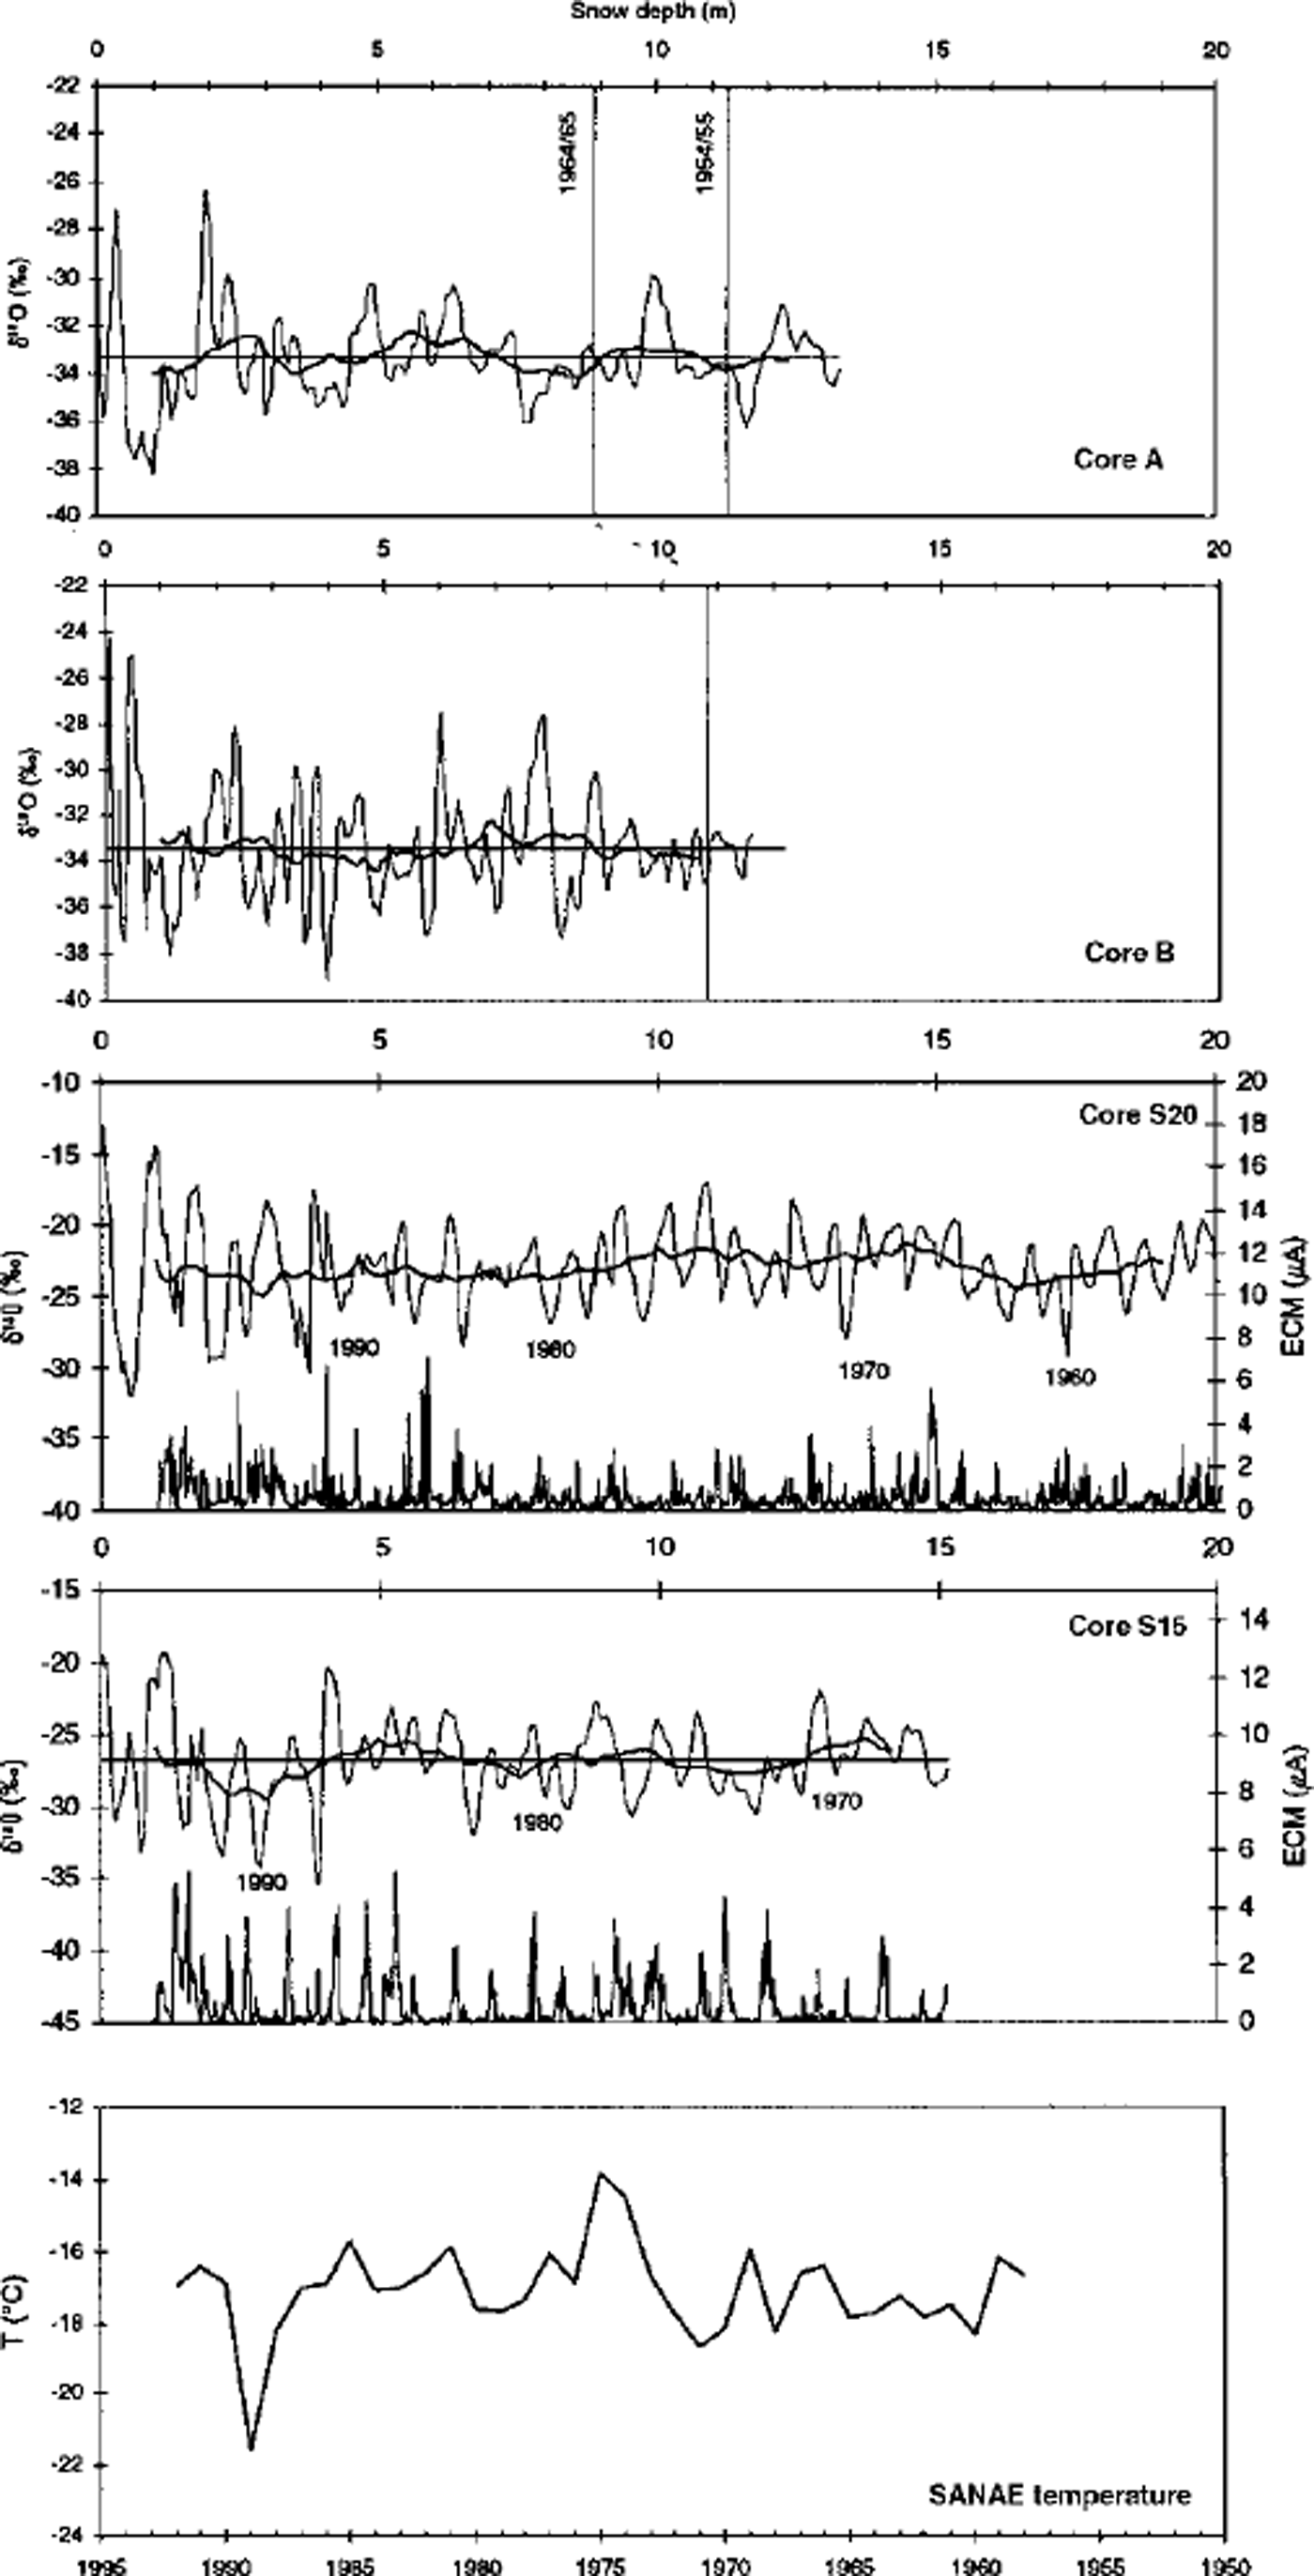
Simple statistical analysis does not reveal any significant trends in the oxygen-isotope records from the coastal sites S20, S15, A and B (Fig. 5). Since the coastal climate is influenced by cyclonic intrusions one should not expect a close correlation between the δ180 records and the temperature record from Sanae. However, cores A, B and S20 all suggest colder temperatures in the early 1960s, in agreement with Sanae temperatures.
δ18O records from four cores from the coastal zone. They have been smoothed with a running mean, equivalent to 3 years. The ECM records for cores S20 and S15 indicate annual variability and provided help with the dating. The time horizons from the total (3 activity analysis are indicated in the δ18O records from cores A and B. The mean annual temperature record from Sanae is included for comparison.
Accumulation Data
Annual accumulation varies from 271mmw.e. at Fimbul Ice Shelf to 45 mm w.e. at the traverse turning-point at 75° S, 15° E (Table 1; Fig. 1). Accumulation was also measured continuously with snow radar (Reference Richardson and HolmlundRichardson and Holmlund, 1999).
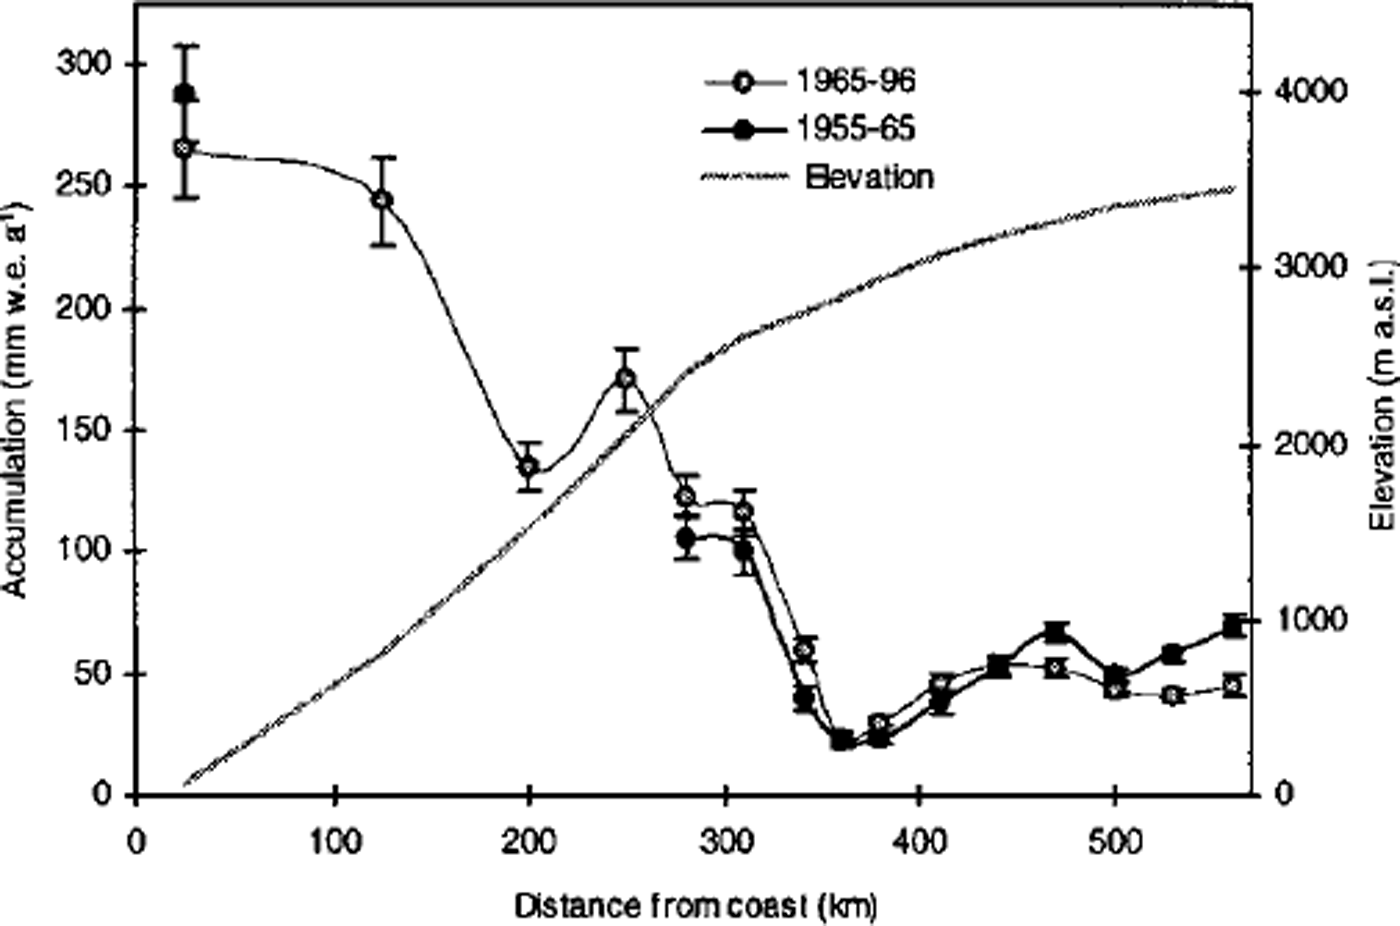
In general, the spatial distribution of accumulation, with a rapid decrease of accumulation with altitude and distance from the shelf edge (Fig. 6), is in agreement with data from stake measurements and stratigraphic studies in snow pits collected during the period 1956-60 by Norwegian scientists who overwintered at Norway station on Fimbul Ice Shelf (Reference LundeLunde, 1961). They determined the annual accumulation at the ice shelf to be 495 mm w.e. for the period 1940-59. Reference MelvoldMelvold (1999) has estimated 480 mm w.e. for the 1965-93 period.
Spatial and temporal variability of accumulation data along the traverse. The grey squares are the annual accumulation the period 1965-96, and the black dots for the period 1955-65. The error bars indicate the ±1 standard error. The data suggest an accumulation increase on the polar plateau at about 2400-3000 ma.s.l. and a decrease on the sites above 3250 m. The ice-shelf record shows an accumulation decrease. The grey line is the elevation profile.
Polar plateau
The accumulation on the high-altitude plateau varies from 123 mm w.e. a−1 in the areajust south of the nunatak range to as little as 24 mm w.e. a−1 at site F. Reference Van den BroekeVan den Broeke and others (1999) use a katabatic-wind model to show that the accumulation minimum is probably due to high wind erosion in this area. Also, 137G deposition rates confirm the effect of wind activity The accumulation data from the sites above about 3000 ma.s.l. are in agreement with data collected during the third leg of the South Pole-Queen Maud Land Traverse in summer 1967-68, about 200 km southwest of our traverse line (Reference Picciotto, Crozaz, de Breuck and CraryPicciotto and others, 1971).
Calculating accumulation from the total /3 activity peaks yields significant accumulation decreases on the highest parts of the polar plateau between the time periods 1955-65 and 1965-96, hereafter referred to as PI and P2, respectively (Fig. 6). This decrease varies between 10% and 35% at core sites J,K, L and M; however, the changes at site K are within the error bars. There is a 15-50% increase between PI and P2 at core locations C,D, E, G and H, while core sites Fand I do not show any changes (Fig. 6). Isotope values in core M suggest that temperatures were about 2°G (1.6%,) lower for P2 than for PI (Table 2). The same value for core L is <1°G (0.6%,). At site E, where accumulation has increased, there is a change of 1.5%, in mean δ180 value between PI and P2.
The time horizons from the volcanic horizons in core M (Fig. 2) provide additional time periods when accumulation can be calculated and compared. Accumulation appears to have been stable over this time period (1815-1996). Despite a large annual fluctuation in accumulation, this relatively well-dated core from Amundsenisen does not show any significant changes since 1865.
Several studies have reported recent accumulation increases from both coastal areas and the polar plateau in East Antarctica (e.g. Reference Petit, Jouzel, Pourchet and MerlivatPetit and others, 1982; Reference Morgan, Goodwin, Etheridge and WookeyMorgan and others, 1991; Reference Mosley-ThompsonMosley-Thompson and others, 1995). However, this study and studies from western DML about 500 km west (Reference Isaksson and KarlenIsaksson and Karlen, 1994; Reference Isaksson, Karlen, Gundestrup, Mayewski, Whitlow and TwicklerIsaksson and others 1996) suggest that accumulation increases do not necessarily apply to the whole polar plateau.
Coastal zone
Data from the two coastal cores S20 and S15 provide a 40 year long time series of accumulation, based on annual dating from the δ18O stratigraphy. The averaged and smoothed record of these data shows a distinct positive anomaly for the years 1970-76 (Fig. 7). In addition, the years 1955-59 show higher accumulation than the overall mean in cores S20 and S15. The year-to-year correlation with the Sanae temperature record is not significant, but the multi-year trends are similar. During the particularly cold year 1989, accumulation at both core sites S15 and S20 was <20% lower than the overall 1955-96 mean. During the period 1960-70 the accumulation is below mean in both cores S20 and S15. At Riiser-Larsen Ice Shelf about 1000 km west, the accumulation is low from 1955 to 1975, increases from 1975 to 1985 and decreases up to 1988 (Reference Isaksson and KarlenIsaksson and Karlen, 1994). The accumulation record from Riiser-Larsen Ice Shelf corresponds quite closely with the temperature record from Halley.
The annual and the averaged and smoothed (3year running mean) accumulation record from core S20 on Fimbul Ice Shelf and core S15 from the area just above the grounding line plotted with the smoothed (3year running mean) temperature record from Sanae (data obtained from South African Weather Bureau).
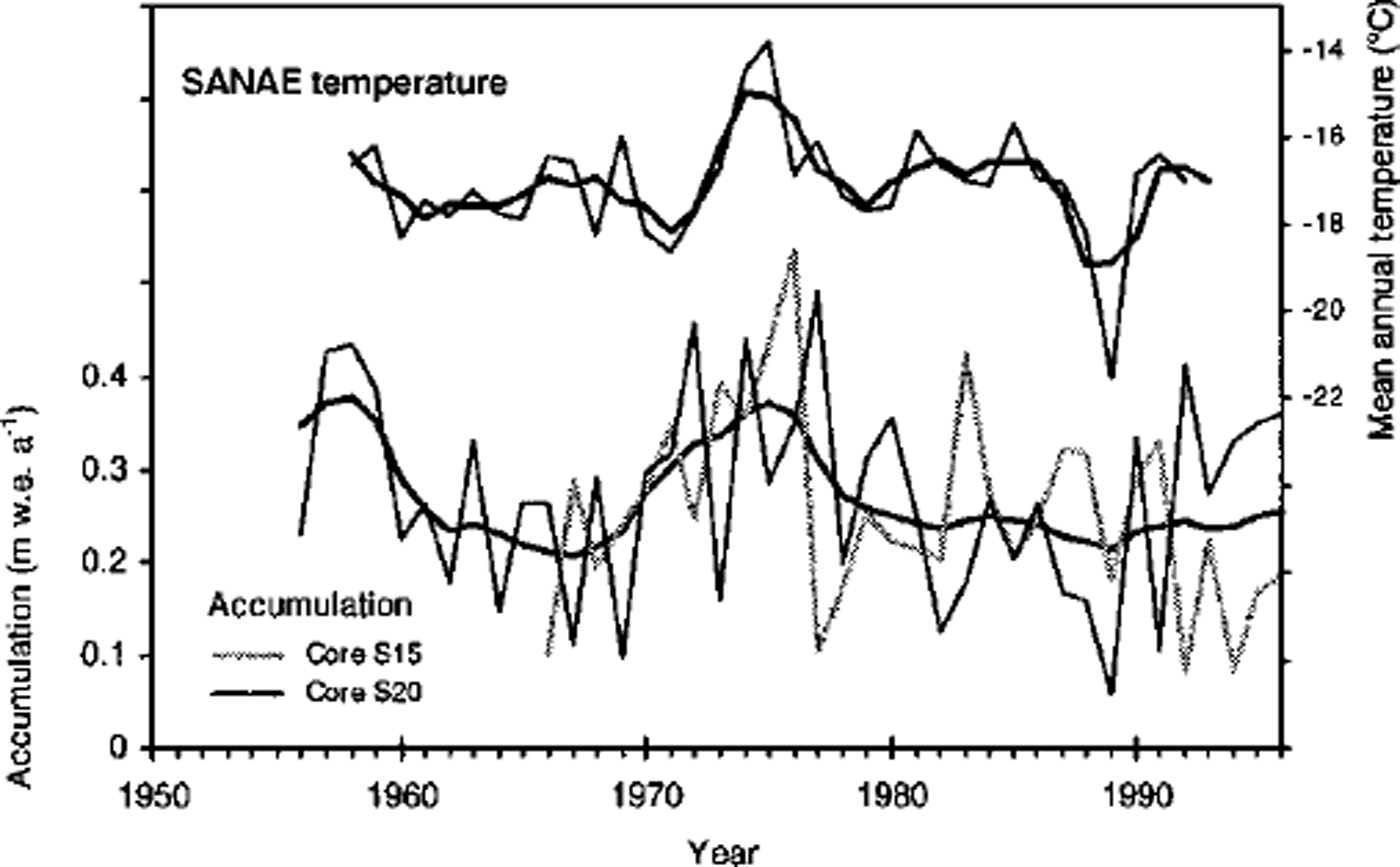
Data from the Fimbul Ice Shelf around 200 km west and Jutulstraumen also indicate higher accumulation between 1955 and 1965 compared to the period 1965 to present (Reference MelvoldMelvold, 1999).
Concluding Remarks
Our finding of a complicated spatial pattern of accumulation is not easy to explain. Furthermore, it demonstrates that the accumulation increases reported from several areas of the polar plateau in East Antarctica are not affecting high-altitude areas over the whole continent. Finding the mechanisms for this is a challenge for the meteorological and modelling communities. This also has important implications for sea-level change in connection with the global climate warming expected in the next century.
The question is, how reliable are accumulation changes as indicators of temperature increase? The fact is that temperature changes cannot explain these large changes in accumulation. Therefore, circulation variations appear to be important (Reference King and TurnerKing and Turner, 1997). In comparing data from different areas we must remember that different precipitation mechanisms operate in coastal and inland areas. While coastal areas are mostly affected by cyclones which rarely penetrate far inland, the high-altitude areas have a large input of clear-sky precipitation which could be more directly sensitive to atmospheric temperature changes than to the frequency of cyclone paths. The processes controlling the spatial variability of accumulation are still not understood, and therefore it is essential to improve the observations.
Acknowledgements
The fieldwork was conducted at NARE 1996-97 organised by the Norwegian Polar Institute. The authors would like to thank all the participants on the EPICA traverse. This work is a contribution to the "European Project for Ice Coring in Antarctica" (EPICA), ajoint European Science Foundation/ European Commission (EC) scientific programme, funded by the EC under Environment and Climate Programme (1994-98) contract ENV4-CT95-0074 and by national contributions from Belgium, Denmark, France, Germany, Italy, The Netherlands, Norway, Sweden, Switzerland and the U.K.T. Braaland, L. Hoivik and S. Teigre assisted with the processing of the cores. Figure 1 was drafted by A. Estoppey. K. Melvold and M. Stenberg are thanked for providing unpublished data. Critical and constructive comments from D. Wagenbach and an anonymous referee substantially improved the paper. Both the content and style of the paper benefited from discussions with J. Kohler. This is contribution No. 336 of the Norwegian Antarctic Research Expeditions (1996-97) and EPICA publication No. 7.



