1. Introduction
The finite wall-mounted cylinder in cross-flow is commonly encountered in engineering applications, from pollutant dispersion in the wakes of buildings and smoke stacks (Vincent Reference Vincent1977), to pin-fin heat exchangers (Igarashi Reference Igarashi1985). In addition to the Reynolds number ( $Re = \rho U D/ \mu$), the primary parameters influencing the flow development are the boundary layer to diameter ratio
 $\delta /D$, boundary layer to height ratio
 $\delta /H$ and aspect ratio
 $H/D$. This work focuses on relating the mean flow topology to the evolution of shed structures for a fixed boundary layer thickness (
 $\delta /D$) and moderate range of aspect ratios (
 $3\leq H/D \leq 7$).
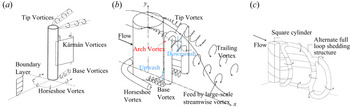
In a detailed review of experimental studies for finite wall-mounted square and circular cylinders, Porteous & Moreau (Reference Porteous and Moreau2014) report several proposed models for the wake topology. Figure 1 shows a schematic of the main flow features. In the mean field, a pair of counter-rotating streamwise vortex structures is reported to form at the cylinder free end and extend downstream (Rostamy et al. Reference Rostamy, Sumner, Bergstrom and Bugg2012). A second pair of streamwise ‘junction’ (Park & Lee Reference Park and Lee2000) or ‘base’ (Wang et al. Reference Wang, Zhou, Chan and Lam2006) vortices is reported extending from the wall junction region, in addition to ‘horseshoe’ vortices. Moreover, an ‘arch vortex’ in the time-averaged field has been identified (Pattenden, Turnock & Zhang Reference Pattenden, Turnock and Zhang2005; Zhu et al. Reference Zhu, Wang, Wang and Wang2017) as shown in figure 1(b).
(a) Flow features in the near wake of the finite wall-mounted cylinder, adapted from Porteous & Moreau (Reference Porteous and Moreau2014). (b) Flow features suggested by and adapted from Zhu et al. (Reference Zhu, Wang, Wang and Wang2017) for the ‘short’ wall-mounted cylinder ( $H/D = 2$). (c) ‘Full-loop structures’ formed behind a wall-mounted square cylinder, Hosseini, Bourgeois & Martinuzzi (Reference Hosseini, Bourgeois and Martinuzzi2013), adapted from Porteous & Moreau (Reference Porteous and Moreau2014).

Figure 1(a) also shows the periodically shed Kármán vortices, which are depicted as distinct from the mean structures. For the square cylinder, Wang & Zhou (Reference Wang and Zhou2009) provided the first model relating the shed structures and the mean tip/base structures. Based on uncorrelated planar particle image velocimetry (PIV) observations, Wang & Zhou (Reference Wang and Zhou2009) propose that the arch structures form in the recirculating region and are shed periodically. Due to the downwash and upwash flow, these structures bend upstream, which result in the poles of oppositely signed streamwise vorticity.
Bourgeois, Sattari & Martinuzzi (Reference Bourgeois, Sattari and Martinuzzi2011) and Bourgeois, Noack & Martinuzzi (Reference Bourgeois, Noack and Martinuzzi2013) propose an alternative model, satisfying the solenoidal condition on both mean and instantaneous vorticity fields, based on a three-dimensional (3D) reconstruction from correlated stereoscopic PIV measurements. Vortices are initially shed alternately, similarly to the classical Kármán shedding process. The ends of the structures undergo bending and tilting, forming streamwise bent extensions, or strands, which connect successive vortices. For thin boundary layers,  $\delta /D < 1$, only the free end strands reconnect, forming ‘half-loop’ structures. Their time-averaged signature is referred to as a dipole. Hosseini et al. (Reference Hosseini, Bourgeois and Martinuzzi2013) showed that for thicker boundary layers, the bending process also occurs in the base junction region, resulting in ‘full-loop’ structures, schematically shown in figure 1(c). These full loops induce upwash and their time-averaged signature is a quadrupole structure. Yauwenas et al. (Reference Yauwenas, Porteous, Moreau and Doolan2019) conducted a parametric study, based on large-eddy simulations (LES), of the influence of
 $\delta$ and
 $H/D$ for cantilevered square cylinders protruding thin turbulent boundary layers. The observed wake dynamics are similar to those reported above. Yauwenas et al. (Reference Yauwenas, Porteous, Moreau and Doolan2019) found that for
 $2 < H/D < 10$, dipole structures occurred for
 $\delta /D < 1 - 1.5$, while quadrupole structures were observed for larger
 $\delta /D$.
The influence of boundary layer state or the horseshoe vortex, which forms upstream of the obstacle–wall junction with trailing vortices extending downstream past the cylinder, appears limited. Kindree, Shahroodi & Martinuzzi (Reference Kindree, Shahroodi and Martinuzzi2018), for cantilevered circular and square cylinders of  $H/D =4$ protruding laminar boundary layers with
 $\delta /D = 0.2$ at
 $Re = 11\,000$, found that the dipole mean structure, shedding structures and frequency
 $St$ were similar to those found by Bourgeois et al. (Reference Bourgeois, Noack and Martinuzzi2013). Similar observations were made for circular cylinders protruding thin turbulent boundary layers,
 $\delta /D < 0.5$ with
 $Re \sim 22\,000$, by Palau-Salvador et al. (Reference Palau-Salvador, Stoesser, Fröhlich, Kappler and Rodi2010) and Krajnović (Reference Krajnović2011) for
 $H/D = 5$ and
 $H/D = 6$, respectively. Uffinger, Ali & Becker (Reference Uffinger, Ali and Becker2013), at
 $Re=12\,800$, based on LES for a cantilevered square cylinder of
 $H/D=6$ and laminar boundary layer of
 $\delta /D = 0.14$, also observed a dipole pattern and similar shedding topology. They further observed that the horseshoe trailing vortices interacted with shed structures relatively far downstream of the mean recirculation. These results were similar to those of Sau et al. (Reference Sau, Hwang, Sheu and Yang2003) for a square cylinder for laminar flows (
 $H/D=1.7, Re\le 500$). El Hassan, Bourgeois & Martinuzzi (Reference El Hassan, Bourgeois and Martinuzzi2015) investigated experimentally the junction region of a cantilevered square cylinder of
 $H/D=4$ protruding a turbulent boundary layer at
 $Re=11\,000$. For the dipole case,
 $\delta /D = 0.7$, the velocity fluctuations on the windward and leeward junction regions were uncorrelated, while for the quadrupole case,
 $\delta /D=2.4$, the correlations were significant. However, the low-Reynolds-number simulations from Zhang et al. (Reference Zhang, Cheng, An and Zhao2017) raise the possibility that quadrupole structures can form without the presence of vortex shedding. Taken together, these observations suggest that, for square and circular cantilevered cylinders with
 $3 < H/D < 10$ protruding thin turbulent boundary layers,
 $\delta /H < \sim 0.3$ with
 $Re >10\,000$, the transition between dipole and quadrupole wakes occurs around
 $\delta /D=1$. The limited studies available for laminar oncoming boundary layers fall within these criteria. Horseshoe interactions with the shed vortices are generally reported downstream of the vortex formation region. While the study of El Hassan et al. (Reference El Hassan, Bourgeois and Martinuzzi2015) suggests that interactions in the base region may exist, these do not determine the shedding mode or the mean near-wake structure.
In the case of the finite wall-mounted circular cylinder, to the authors’ knowledge, no past studies have measured and analysed the 3D instantaneous and time-averaged wake of finite wall-mounted circular cylinders with  $3 \leq H/D \leq 7$. Moreover, the review by Porteous & Moreau (Reference Porteous and Moreau2014) indicates that the flow development for the finite circular cylinder remains undocumented for
 $50 < Re < 1000$. Evidence of structures similar to the dipole and quadrupole have been identified in the time-averaged wake of circular cylinders (Sumner, Heseltine & Dansereau Reference Sumner, Heseltine and Dansereau2004; Pattenden et al. Reference Pattenden, Turnock and Zhang2005; Essel, Tachie & Balachandar Reference Essel, Tachie and Balachandar2021). Furthermore, Essel et al. (Reference Essel, Tachie and Balachandar2021) observed that the presence of a quadrupole or dipole structure depended on
 $\delta /H$ for circular cylinders at a higher Reynolds number (
 $Re=5540$), and for a much thicker boundary layer,
 $\delta /H > 1$, than in the present study. However, the mechanism by which these structures form is yet to be characterized. In view of these observations, the objectives of the present study are to (i) document the time-averaged wake topology across the parameter space of the study,
 $3 \leq H/D \leq 7$ and
 $\delta /D \approx 0.98$ for
 $Re = 750$; (ii) study the role of vorticity stretching and tilting on the evolution of the periodically shed vortices; and (iii) investigate the formation mechanism of the time-averaged poles.
2. Methodology
2.1. Flow facility
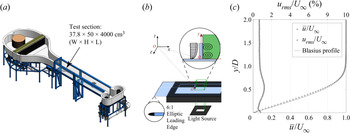
Tomographic PIV measurements were performed in the University of Calgary Water Tunnel (figure 2a). The flow speed was set at  $U_\infty = 7.13$ cm s
 $^{-1}$ with the water level being maintained at 43.4 cm depth for all experiments. The free-stream turbulence intensity in the test section is less than
 $1.2\,\%$. Five cylinder test models (
 $D = 0.95$ cm) were mounted 20 cm (21
 $D$) from the leading edge of a 1 m long acrylic flat plate with a 6:1 elliptic leading edge (figure 2b). The unperturbed boundary layer thickness at this location is
 $\delta /D \approx 0.98$, while the shape factor is
 $\hat {H} = 2.57$. The five cylinder test models were constructed of acrylic for aspect ratios of
 $H/D = 3, 4, 5, 6, 7$. The boundary layer profile and root-mean-square velocity fluctuations measured with planar PIV are shown in figure 2(c).
Schematic of (a) water channel facility and (b) experimental setup. The origin is located at the junction of the circular cylinder with the ground plane, with the y-axis coincident with the cylinder axis. The directions of the velocity components are defined along the following axes:  $u$ (x-axis),
 $v$ (y-axis) and
 $w$ (z-axis). (c) The boundary layer profile,
 $\bar {u}/U_\infty$, and turbulence intensity profile,
 $T_u = u_{rms}/U_\infty$, with
 $u_{rms}$ the root-mean-square streamwise velocity fluctuations at the obstacle location with the obstacle absent. Overlaid is the distribution of the Blasius profile.

2.2. Tomographic PIV
Two Phantom Miro R311 and two Miro R340 cameras of resolution  $1280 \times 800$ and
 $2560 \times 1600$, and pixel sizes of 20 and 10
 $\mu$m, respectively, were placed in a linear configuration for the tomographic PIV measurements. To achieve equal fields of view, the larger resolution Miro R340 cameras, equipped with Tokina 110 mm objective lenses, had their fields of view cropped down to
 $1280\times 800$, while the smaller resolution Miro R311 cameras were equipped with Nikon 50 mm objective lenses. The outer two cameras were set to a numerical aperture of
 $f/11$, and the inner two cameras to
 $f/8$. Although the cameras were imaging over an air–glass–water interface, the image distortion due to astigmatism was found to be minimal, and no corrections were used. The laser and camera system were operated in a cycle-based mode with a cycle rate of 18 Hz and interframe delay of 11.1 ms. This resulted in 10–12 double-frame image recordings per vortex shedding cycle. The camera recording and synchronization were handled using a LaVision programmable timing unit, and controlled using DaVis 8.4 software. The imaging parameters are summarized in table 1. The PIV domain volume of
 $70\times 66 \times 25$ mm
 $^{3}$ (
 $\textrm {L}\times \textrm {H}\times \textrm {W}$, corresponding to
 $7.4\times 7.0\times 2.6\ D^{3}$) was illuminated with a 20 mJ pulse
 $^{-1}$ photonics Nd:YLF laser. The flow was seeded with hollow glass spheres of mean diameter 11.6
 $\mu$m supplied by Potters Industries Inc. Calibration of the system was performed using a dual plane calibration plate manufactured by LaVision Inc., placed at the
 $x$–
 $y$ centre plane of the domain. The calibration error was measured to be less than 0.1 pixels. Particle image processing involved 3D intensity volume reconstruction performed using the motion-tracking-enhanced MART method for tomographic PIV, a variation on the MART algorithm (Novara, Batenburg & Scarano Reference Novara, Batenburg and Scarano2010). Vector calculations were then performed using cross-correlations between pairs of reconstructed intensity volumes. The final interrogation volume size was
 $32\times 32\times 32$ voxels with 50 % overlap, giving a vector spacing of 0.70 mm (
 $0.074D$). The quality of the tomographic calibration and reconstruction was assessed using the
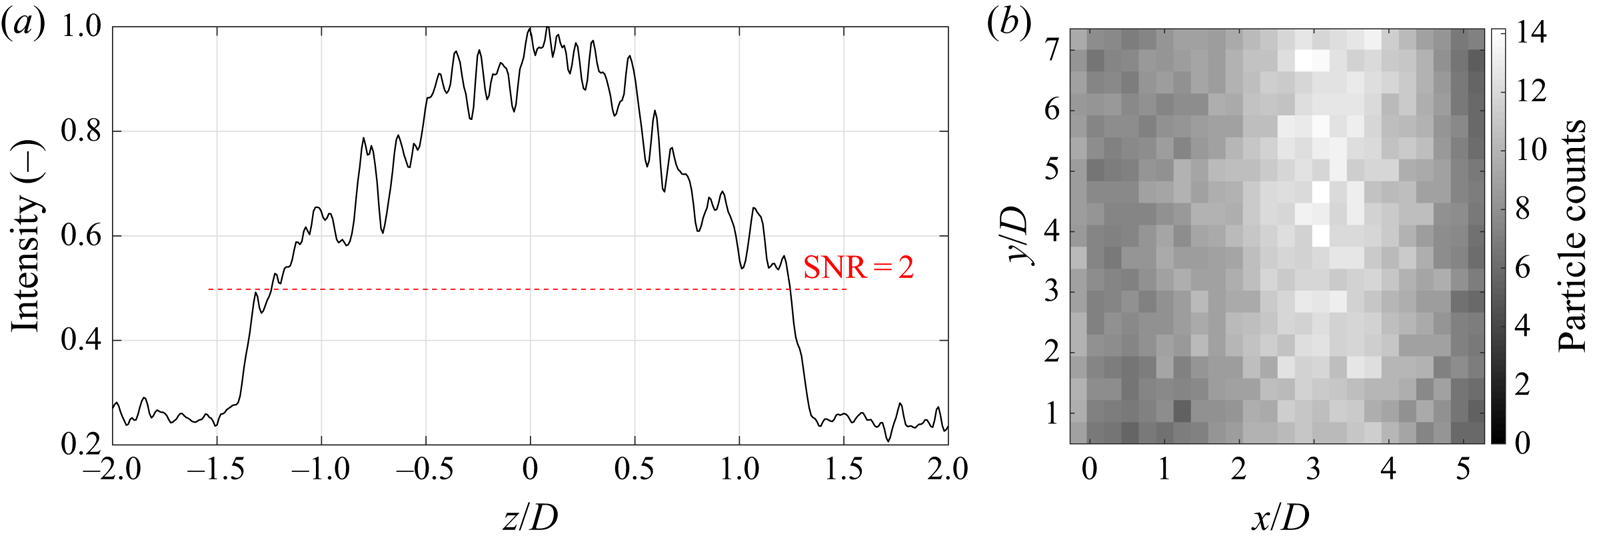
 $z$-axis light intensity distribution and the particle density field using 300 snapshots. The light intensity profile is shown in figure 3(a). The corresponding particle density per interrogation volume is shown in figure 3(b). The reconstruction signal-to-noise ratio, defined as the ratio between the intensities inside and outside the illuminated region, is greater than 2 for all the results presented here, which confirms that the acquired recordings and the volume reconstruction are of good quality.
Details of the tomographic imaging parameters, defined as  $d_{\tau }^{*}$ (particle image diameter),
 $\Delta x_{p,max}$ (maximum particle pixel displacements between image pairs),
 $M$ (magnification factor),
 $\textrm {SNR}_{min}$ (minimum signal-to-noise ratio),
 $\epsilon _{max}$ (maximum calibration error) and ppp (particles per pixel) (Scarano Reference Scarano2012).

(a) Average  $Z$-intensity profile after image pre-processing for volume reconstruction of a representative image. (b) Average particle density per interrogation volume across all
 $Z$-planes after image pre-processing.

3. Results
The results are divided into three sections: (i) an overview of the mean wake topology is presented and the salient time-averaged flow features described; (ii) a detailed analysis is carried out on the tilting and stretching terms of the vorticity transport equation to elucidate a proposed topology; and (iii) low-order representations of the wake dynamics are analysed and related to the observed time-averaged flow features.
3.1. Time-averaged wake
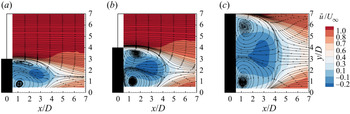
For all  $H/D$ considered, the mean wake flow is characterized by a 3D recirculation, shown in figure 4, which extends to
 $x/D \approx 4$. Similarly to experimental observations for the square cylinder for
 $\delta /D \geq 1$ (Wang et al. Reference Wang, Zhou, Chan and Lam2006; Hosseini et al. Reference Hosseini, Bourgeois and Martinuzzi2013), a downwash region forms downstream of the free end and a region of upwash behind the obstacle–ground junction. The counter-rotating free end and junction recirculating regions are centred about foci and bounded by the positive bifurcation lines. These lines extend to a saddle point. The vertical location
 $y/H$ of the saddle point is only weakly affected by
 $H/D$, i.e. the saddle location lies between
 $0.45H$ and
 $0.5H$ for the cases shown in figure 4. Moreover, the general topology of the wake is similar for all aspect ratios. The width of the wake (
 $z$ direction, not shown for brevity) remains unchanged at the height of the foci. The positions of the foci relative to the free end and junction in the plane
 $z=0$ remain similar for all aspect ratios. For
 $H/D = 3$, a slight reduction in the streamwise extent of the recirculation region from
 $x/D = 4.1$ to
 $x/D = 3.9$ can be observed. This is consistent with the observations of Wang & Zhou (Reference Wang and Zhou2009) (
 $\delta /D = 1.35$,
 $Re = 9300$) for the square cylinder and Rostamy et al. (Reference Rostamy, Sumner, Bergstrom and Bugg2012) (
 $\delta /D = 1.6$,
 $Re = 42\,000$) for the circular cylinder, both studies noting a streamwise reduction in the extent of the recirculation for
 $H/D = 2$.
Time-averaged sectional streamlines at  $z/D = 0$ for
 $H/D = 3$, 4, 7: (a)
 $H/D = 3$,
 $\delta /D = 0.98$, (b)
 $H/D = 4$,
 $\delta /D = 0.98$ and (c)
 $H/D = 7$,
 $\delta /D = 0.98$.

To identify vortex cores in the three-dimensional three-component (3D-3C) velocity field and educe time-averaged and instantaneous vortex structures, the Q-criterion (Hunt, Wray & Moin Reference Hunt, Wray and Moin1988) is applied. Isosurfaces of  $Q = 0$ are displayed in figure 5 for
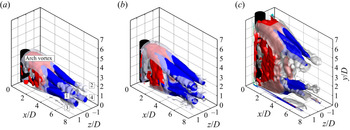
 $H/D = 3$, 4, 7. The figure shows an arch-type structure containing the recirculating region, similar to that shown by Zhu et al. (Reference Zhu, Wang, Wang and Wang2017) for the
 $H/D = 2$ cantilevered cylinder. Four distinct branches of Q-isosurfaces extend downstream from the arch structure. These streamwise branches are denoted as poles in this study and correspond to time-averaged tip (poles 1, 2) and base (poles 3, 4) vortices. A similar quadrupole topology was observed for
 $H/D = 5, 6$, and has been reported for finite square cylinders (Hosseini et al. Reference Hosseini, Bourgeois and Martinuzzi2013) for
 $\delta /D \geq 1$.
Time-averaged isosurfaces of  $Q/(U_{\infty }/D)^{2} = 0$ in grey isosurface: (a)
 $H/D = 3$, (b)
 $H/D = 4$ and (c)
 $H/D = 7$. The arch vortex is shown in red isosurfaces of
 $Q/(U_{\infty }/D)^{2} = 0.0015$. Isosurfaces of
 $|\omega _x|= \max (|\omega _x|/2)$ are overlaid in blue.

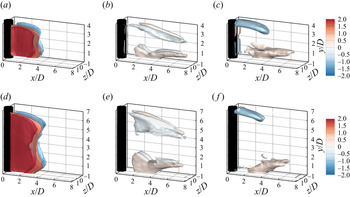
To investigate the 3D spatial distribution of the time-averaged vorticity field, isosurfaces of  $\overline{\omega _x}$,
 $\overline{\omega _y}$ and
 $\overline{\omega _z}$ are shown in figure 6 for
 $H/D = 4, 7$ and
 $\delta /D = 0.98$. Similar vorticity distributions are observed for all aspect ratios investigated. As expected, figures 6(a) and 6(d) show concentrated regions of high-magnitude
 $\overline{\omega _y}$ corresponding to the separated shear layers. Figures 6(c) and 6(f) show concentrated regions with large values of
 $\overline{\omega _z}$ at the cylinder tip and base regions. The negatively signed region of
 $\overline{\omega _z}$ near the cylinder tip is associated with separation over the free end and is consistent with the location of the bifurcation line along the separated shear layer. The positively signed region of
 $\overline{\omega _z}$, which forms downstream of the cylinder junction (figure 6c,f), coincides with the region of upwash and cannot be explained simply by the local separation process along the cylinder sides and tip. As shown in § 3.2, the generation of this vorticity requires consideration of the vorticity transport terms. Figures 6(b) and 6(e) show large magnitudes of
 $\overline{\omega _x}$ concentrated in regions downstream of the cylinder tip and base. These
 $\overline{\omega _x}$ concentrations extend downstream along the poles branching off the arch vortex. The present results show that the streamwise vorticity concentrations form the quadrupole and originate inside the arch vortex (i.e. significant concentrations exist for
 $x/D \leq 3$, within the vortex formation region).
Time-averaged vorticity isosurfaces of (a)  $\overline{\omega _y}D/U_{\infty }$, (b)
 $\overline{\omega _x}D/U_{\infty }$, (c)
 $\overline{\omega _z}D/U_{\infty }$ for
 $H/D = 4$ (top), and (d)
 $\overline{\omega _y}D/U_{\infty }$, (e)
 $\overline{\omega _x}D/U_{\infty }$, (f)
 $\overline{\omega _z}D/U_{\infty }$ for
 $H/D = 7$ (bottom),
 $\delta /D = 0.98$.

To clarify the origins of the vorticity distribution shown in figure 6 and the relationship between the instantaneous vortex dynamics and the mean field quadrupole structure, an analysis of the tilting and stretching terms in the vorticity transport equation was performed.
3.2. Vorticity transport analysis
For the flow of a viscous, incompressible fluid, the averaged vorticity transport equation is
 \begin{align} \overline{u_j}
\frac{\partial \overline{\omega_i}}{\partial x_j} &=
\underbrace{\overline{\omega_j} \frac{\partial
\overline{u_i}}{\partial x_j}}_{\textit{mean
stretching/tilting}} +
\underbrace{\overline{\omega_j^{\prime} \frac{\partial
u_i^{\prime}}{\partial x_j}}}_{\textit{fluctuating
stretching/tilting}}\nonumber\\ &\quad +
\frac{\partial}{\partial x_j} \Bigg(\underbrace{\nu
\frac{\partial \overline{\omega_i}}{\partial
x_j}}_{\textit{viscous diffusion}} -
\underbrace{\overline{u_j^{\prime}
\omega_i^{\prime}}}_{\textit{turbulence diffusion}}\Bigg).
\end{align}
Table 2 summarizes the contribution of each term in (3.1) over the PIV domain. The quantities are shown as the fraction of the  $\int _{V}({\textrm {D} \omega _i}/{\textrm {D} t} )\,\textrm {d} V$ over the PIV volume,
 $V$. In all directions, the viscous diffusion term is less than
 $2\,\%$, while the contributions due to the stretching/tilting terms are dominant. Of particular interest in this study are the terms responsible for the generation of
 $\overline{\omega _x}$, leading to the quadrupole structure observed in figures 5 and 6. The mean stretching/tilting terms are
 \begin{equation} \overline{\omega_j} \frac{\partial \bar{u}}{\partial x_j} = \underbrace{\overline{\omega_x} \frac{\partial \bar{u}}{\partial x}}_{\textit{mean stretching }\overline{S_x}} + \underbrace{\overline{\omega_y} \frac{\partial \bar{u}}{\partial y} + \overline{\omega_z} \frac{\partial \bar{u}}{\partial z}}_{\textit{mean tilting }\overline{T_x}}. \end{equation}
Volumetric average contribution of vorticity stretching, tilting and diffusion. Viscous diffusion was found to be less than  $2\,\%$ in all directions.

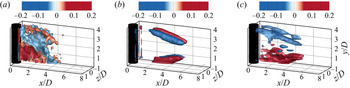
The distributions of  $\overline {T_x}$ and
 $\overline {S_x}$ are presented as isosurfaces in figure 7(a,b). High values of
 $\overline {T_x}$ and
 $\overline {S_x}$ are concentrated along the vortex cores corresponding to the quadrupole. The tilting terms act to increase the magnitude of
 $\overline{\omega _x}$ in the recirculating region, and the magnitude of
 $\overline {T_x}$ decreases rapidly downstream (
 $x/D > 4$). The stretching term
 $\overline {S_x}$ in figure 7(b) mainly amplifies
 $\overline{\omega _x}$ in the region
 $3 \leq x/D \leq 5$, which coincides with the end of the recirculation where
 ${\partial \bar {u}}/{\partial x}$ is largest. High values of
 $\overline {S_x}$ are concentrated along the poles.
Time-averaged isosurfaces of (a)  $\overline {T_x} D^{2}/U_{\infty }^{2}$, (b)
 $\overline {S_x}D^{2}/U_{\infty }^{2}$ and (c)
 $\overline {T_z}D^{2}/U_{\infty }^{2}$, for
 $H/D = 4$,
 $\delta /D = 0.98$.

Figure 7(c) shows the tilting term contribution to  $\overline{\omega _z}$ (i.e.
 $\overline {T_z} = \overline{\omega _x} ({\partial \bar {w}}/{\partial x}) + \overline{\omega _y} ({\partial \bar {w}}/{\partial y})$); note that
 $\overline {S_z}= \overline{\omega _z} ({\partial \bar {w}}/{\partial z})$ is significantly smaller. The dominant contribution to
 $\overline{\omega _z}$ is due to reorientation of the vertical vorticity component
 $\overline{\omega _y}$ in the regions of the quadrupoles, resulting in an increase in the magnitude of
 $\overline{\omega _z}$ as seen in figure 6(c).
Based on mean field observations, it is possible to infer the influence of the tilting terms on the spatial evolution of the shed vortices. The process is illustrated with a simplified schematic in figure 8. The roll-up of the separated shear layer over the free end results in a region of predominantly  $\overline{\omega _z}$ vorticity. Similarly, along the cylinder sides, the roll-up of the separated shear layer results in regions of predominantly
 $\overline{\omega _y}$ vorticity. Satisfying the solenoidal condition on the vorticity field, these high-vorticity regions are connected and observed as a continuous arch structure terminating at the ground. During the formation process, shown for
 $z>0$ in (8), the core of the forming vortex along the cylinder sides moves downstream. Along the arch legs of predominantly
 $\overline{\omega _y} > 0$ in figure 8(a),
 $\overline {T_x}>0$ in the base junction region, leading to the generation of
 $\omega _x > 0$; thus, the vorticity vector tilts downstream. Similarly, towards the free end,
 $\overline {T_x} < 0$, leading to the generation of
 $\omega _x < 0$, so that the vorticity vector tilts upstream.
Schematic showing influence of tilting terms on mean vortex structure for  $x/D \leq 4$ (only near side of wake is shown). (a) Perspective view showing influence of
 $\overline {T_x}$; (b) planar view showing influence of
 $\overline {T_z}$.

Near the free end, a small region of  $\overline {T_x}>0$ reduces the magnitude of
 $\omega _x < 0$. From figure 8(b), in this region
 $\overline {T_z}<0$, so that the magnitude of
 $\omega _z<0$ increases and the vorticity vector is reoriented towards
 $z=0$, thereby satisfying the solenoidal condition. In the base region,
 $\overline {T_z}>0$ and the vorticity vector is slightly oriented towards
 $z=0$. The reorientation process occurs in the recirculating region,
 $x/D < 4$, before the structures are fully formed and shed.
The schematic illustration in figure 8 shows similarities to the model proposed by Wang & Zhou (Reference Wang and Zhou2009) for finite cantilevered square cylinders deduced from instantaneous PIV observations. That model implies that the upwash and downwash result in the bending of the spanwise (side) structures at the tip and base. Comparing figures 4 and 7(a), however, the present results indicate that the action of the tilting terms occurs upstream of the region of strong downwash/upwash. Moreover, it is observed that the magnitude of the tilting terms is insensitive to the downwash or upwash strength.
The mean field analysis and resulting schematic in figure 8 are representative of  $4 \leq H/D \leq 7$. For
 $H/D = 3$, the mean field trends underlying figure 8 appear less clearly defined. Closer inspection of the temporal evolution of the wake shows that over most of the observation window, the vortex shedding process qualitatively matches that observed for
 $4 \leq H/D \leq 7$. However, there exist some short and irregularly occurring intervals over which the shedding process is characterized by much weaker vortices or is even suppressed. Consequently, the mean field imprint for
 $H/D = 3$ is still a quadrupole, but the instantaneous dynamics show strong modulations. This observed shedding modulation at
 $H/D=3$ is similar to that observed by Palau-Salvador et al. (Reference Palau-Salvador, Stoesser, Fröhlich, Kappler and Rodi2010) for thin turbulent boundary layers and higher Reynolds number,
 $\delta /D \approx 0.5, Re = 46\,000$, and
 $H/D=2.5$. Palau-Salvador et al. (Reference Palau-Salvador, Stoesser, Fröhlich, Kappler and Rodi2010) observed intervals of regular shedding interspersed with periods of weak and irregularly shed symmetric vortices or suppressed periodicity, suggesting that the present case
 $H/D = 3$ exhibits the inception of features related to lower-
 $H/D$ regimes.
3.3. Unsteady wake development
The time-resolved velocity field data were analysed using proper orthogonal decomposition (POD) in order to educe coherent structures from a low-dimensional representation of the flow. The method has been successfully applied for the analysis of tomographic PIV data (Morton, Yarusevych & Scarano Reference Morton, Yarusevych and Scarano2016; Zhu et al. Reference Zhu, Wang, Wang and Wang2017). The five most energetic modes were selected for the low-order representation of the flow. These modes consist of the first and second harmonic pairs as well as a slow-varying mode which is commonly observed in bluff body wakes (Hosseini, Martinuzzi & Noack Reference Hosseini, Martinuzzi and Noack2015). These modes account for 50 % to 75 % of the turbulent kinetic fluctuation energy (TKE) for the present cases. To evaluate the relative energy content in each 3D-3C POD mode for varying  $H/D$, the total TKE was calculated for the first 100 modes. The results are plotted for
 $H/D = 3 - 7$ in figure 9. Studies which have examined the TKE distribution of the 2D square and circular cylinder have found that the first two POD modes make up a majority of the total TKE contribution (Van Oudheusden et al. Reference Van Oudheusden, Scarano, Van Hinsberg and Watt2005) and have been associated with vortex shedding. The present results show that as
 $H/D$ increases, the relative energy content of the first two modes increases. The results for
 $H/D = 5 - 7$ are similar to those for the 2D cylinder, with approximately 60
 $\%$ of TKE captured in the first mode pair (Van Oudheusden et al. Reference Van Oudheusden, Scarano, Van Hinsberg and Watt2005). The results show that
 $H/D$ strongly influences the relative energy content of the first two modes. The present results suggest that for the range of
 $H/D$ and
 $\delta /D$ values studied herein, the full 3D shedding topology always exhibits anti-symmetric Von Kármán shedding; however, the energy contributions of the modes associated with these structures become gradually weaker with decreasing aspect ratio. For these cases, this results in a shift in energy content to higher mode numbers.
Distribution of TKE in the first 100 POD modes for  $H/D = 3 - 7$ and
 $\delta /D = 0.98$.

Figure 10(a) displays the POD temporal coefficients of modes 1 and 2. Modes 1 and 2 show strong periodic behaviour and are separated by a phase angle of  ${\rm \pi} /2$, forming a mode pair. Analysis of the power spectral density (PSD) functions for these modes (figure 10b) shows a peak at the shedding frequency
 $f_{sh}$ corresponding to
 $\textit {St} = f_{sh}D/U_\infty = 0.16$, which is consistent with previous experimental studies for finite wall-mounted circular cylinders (Kuwamura et al. Reference Kuwamura, Hiwada, Hibino, Mabuchi and Kumada1984; Sumner et al. Reference Sumner, Heseltine and Dansereau2004).
(a) POD temporal coefficients of modes 1 and 2 for  $H/D = 4$ and
 $\delta /D = 0.98$. (b) PSD function of first and second temporal coefficients for modes 1 and 2. The quantity
 $t^{*} = t\cdot f_{sh}$ corresponds to the number of vortex shedding cycles.

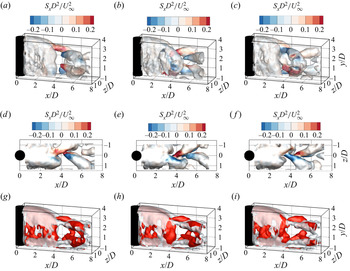
Figure 11 shows isosurfaces of  $Q=0$, coloured by
 $S_x$, and illustrates the topology of the shed structures for three time instances of a representative shedding cycle. The wake structure is found to be qualitatively similar for all cases studied herein. The figure shows that vortices are shed alternately from opposing sides of the cylinder. The ends of the shed vortex bend upstream. These ‘legs’ connect to the opposing vortex, forming a full loop, similar to the structures reported for cantilevered finite square cylinders (Bourgeois et al. Reference Bourgeois, Sattari and Martinuzzi2011; Hosseini et al. Reference Hosseini, Bourgeois and Martinuzzi2013). The full-loop structures appear to originate within the arch vortex, which grows streamwise as they are formed and eventually pinch off at
 $x/D \approx 4$. At this location, the poles are first identified emerging from the time-averaged arch vortex in figure 5.
Flow structures are visualized with isosurfaces of  $Q = 0$, coloured by
 $S_x$ in (a–f) and overlaid with mean field in (g–i). (a–c) Isometric view, (d–f) top view, (g–i) mean field (grey) and POD reconstruction (red) overlay. Results correspond to a finite cylinder wake for
 $H/D = 4$,
 $\delta /D = 0.98$, with (a)
 $t^{*} = 0$, (b)
 $t^{*} = 0.35$, (c)
 $t^{*} = 0.70$, (d)
 $t^{*} = 0$, (e)
 $t^{*} = 0.35$, (f)
 $t^{*} = 0.70$, (g)
 $t^{*} = 0$, (h)
 $t^{*} = 0.15$ and (i)
 $t^{*} = 0.30$.

Supplementary movie files show POD-based low-dimensional reconstructions of the shedding process. The  $Q=0$ isosurfaces are coloured by
 $S_x$ (see supplementary movie 1, available at https://doi.org/10.1017/jfm.2021.904) and
 $T_x$ (see supplementary movie 2) to illustrate the spatial evolution of stretching and tilting. The stretching terms exhibit maxima at locations where structures pinch off from the arch vortex. Maxima in the tilting terms occur at locations where the legs of the full-loop structures bend back. These terms are largest for
 $x/D < 4$, and decrease rapidly in magnitude for
 $x/D > 4$. This behaviour is qualitatively shown in the reconstructed shedding sequence in figure 11, where much of the vortex reorientation is seen to occur for
 $x/D > 4$. These observations further support the view that the upwash, observed downstream of the arch vortex, is a result of the time-averaged signature of the passage of the vortex legs. The streamwise stretching term,
 $S_x$, is largest along the legs of the shed full loops in the region
 $4 < x/D < 5$. In this region, the spacing between subsequent vortices increases (i.e. the convective velocity has increased in the region as vortices are shed). However, the vortex legs must connect to subsequent vortices – so they become longer (i.e. are stretched). The time-averaged field and POD reconstruction are overlaid in figure 11, showing that the legs of the full-loop structures bend back along the poles of the time-averaged quadrupole (supplementary movie 3).
4. Conclusions
A tomographic PIV study of vortex shedding from cantilevered cylinders is presented for  $Re = 750$,
 $\delta /D \approx 0.98$ and
 $3 \leqslant H/D \leqslant 7$. For the full range of
 $H/D$ values studied herein, the 3D time-averaged and low-order reconstruction topology is similar to that of the finite square cylinder (Hosseini et al. Reference Hosseini, Bourgeois and Martinuzzi2013). The time-averaged topology is of quadrupole type, consisting of four streamwise vorticity concentrations extending downstream behind the tip and base. The low-order model topology consists of a series of alternately shed full-loop structures which bend back at the tip and base. For all cases, the full-loop structures are shed periodically.
The formation of the quadrupole involves a 3D reorientation and subsequent stretching process which mainly occurs before the full-loop structures detach from the separated shear layer ( $x/D \approxeq 4$ for
 $H/D = 4$,
 $\delta /D = 0.98$). At the cylinder tip and base,
 $\overline{\omega _x}$ is formed due to the tilting of
 $\overline{\omega _y}$ and
 $\overline{\omega _z}$. At the cylinder base,
 $\overline{\omega _z}$ is formed due to the tilting of
 $\overline{\omega _y}$. The resulting
 $\overline{\omega _x}$ concentrations are then amplified by streamwise stretching encountered downstream. The present results suggest that the poles are indeed imprints of the shed full-loop structures on the time-averaged field. This model satisfies the solenoidal condition on both mean and instantaneous vorticity fields. The quadrupole forms as a consequence of the reorientation which occurs upstream and permits the full-loop topology to develop.
Supplementary movies
Supplementary movies are available at https://doi.org/10.1017/jfm.2021.904.
Declaration of interests
The authors report no conflict of interest.