INTRODUCTION
Sugar beet is a major crop in Europe and the factors influencing sugar yield have been studied intensively (Scott & Jaggard Reference Scott and Jaggard2000). Fast leaf area development during early growth stages is important for yield formation (Scott et al. Reference Scott, English, Wood and Unsworth1973; Jaggard et al. Reference Jaggard, Wickens, Webb and Scott1983) because it determines the amount of radiation energy absorbed and thereby the crop growth rate (Jaggard & Werker Reference Jaggard and Werker1999). Spring-sown sugar beet often reaches full canopy cover when irradiation is already near its maximum value and therefore yield potential is clearly below theoretical potentials (Jaggard et al. Reference Jaggard, Qi and Ober2009; Hoffmann & Kluge-Severin Reference Hoffmann and Kluge-Severin2010).
Canopy closure may be reached earlier for autumn-sown sugar beet or ‘winter beet’ because it may have intact leaf area produced in autumn and/or it may use assimilates stored within the beet for fast re-growth in spring. Autumn-sown sugar beet is grown in Mediterranean countries with mild winters using bolting-resistant genotypes (Rinaldi & Vonella Reference Rinaldi and Vonella2006), but in temperate climates conventional beet genotypes become vernalized due to prolonged exposure to cold temperatures over winter and start bolting in spring. Despite these practical difficulties, possible yield advantages of winter sugar beet in temperate climates have been of interest for several years. The first field trials with bolting winter beet were conducted by Wood & Scott (Reference Wood and Scott1975) and newer studies for bolting winter beet were conducted by Hoffmann & Kluge-Severin (Reference Hoffmann and Kluge-Severin2010, Reference Hoffmann and Kluge-Severin2011). Jaggard & Werker (Reference Jaggard and Werker1999) tried to quantify potential yield advantages of non-bolting winter beet by simulation modelling: it has since been estimated to be 26% (Hoffmann & Kluge-Severin Reference Hoffmann and Kluge-Severin2010) or up to one-third (Jaggard et al. Reference Jaggard, Qi and Ober2009). Recent insights into the genetic control of bolting in sugar beet (Pin et al. Reference Pin, Benlloch, Bonnet, Wremerth-Weich, Kraft, Gielen and Nilsson2010, Reference Pin, Zhang, Vogt, Dally, Büttner, Schulze-Buxloh, Jelly, Chia, Mutasa-Göttgens, Dohm, Himmelbauer, Weisshaar, Kraus, Gielen, Lommel, Weyens, Wahl, Schechert, Nilsson, Jung, Kraft and Müller2012) may open new options for developing non-bolting sugar beet cultivars.
The specific leaf area (SLA), being the ratio between leaf surface and leaf mass, is an important factor for leaf growth and productivity of crops in early growth stages. Studies for different plant species show that the SLA depends on a number of abiotic factors. Evans (Reference Evans1989) and Reich et al. (Reference Reich, Ellsworth, Walters, Vose, Gresham, Volin and Bowman1999) reported a negative correlation between SLA and light intensity and a positive one for SLA and temperature. Lee & Heuvelink (Reference Lee and Heuvelink2003) estimated the SLA for cut chrysanthemums in the glasshouse by a linear model dependent on temperature and radiation. Besides abiotic environmental factors, intrinsic biotic factors also influence SLA. Reich et al. (Reference Reich, Ellsworth, Walters, Vose, Gresham, Volin and Bowman1999) reported a general decrease of SLA with time for different species, due to leaf maturity. This was also confirmed for sugar beet by Rinaldi (Reference Rinaldi2003). Ratjen & Kage (Reference Ratjen and Kage2013) found a positive effect of leaf area index (LAI) on SLA development of single leaves in the lower canopy of wheat due to mutual shading of leaves in later growth stages.
Different studies have described the SLA dynamics of sugar beet under varying environmental conditions. Rinaldi (Reference Rinaldi2003) identified sowing time (spring-sown v. autumn-sown sugar beet) and irrigation as factors affecting SLA but proposed that constant values for the whole growth period could be used to model SLA. In contrast, Donatelli et al. (Reference Donatelli, Bellocchi, Criscuolo and Maestrini2006) identified a positive correlation between temperature (up to 20 °C) and SLA of sugar beet for northern Italy; they proposed a dynamic approach to simulate SLA depending on the daily mean air temperature. Tsialtas & Maslaris (Reference Tsialtas and Maslaris2008) fitted quadratic functions for leaf water content and individual leaf mass on SLA data and concluded that the leaf water content could be used to predict SLA.
Although many results show that SLA is a dynamic value and different approaches have been made to describe SLA over time, no studies are available examining SLA dynamics for sugar beet under temperate climate conditions including autumn sowing dates. A high degree of environmental change (temperature, radiation, etc.) can be expected during the growth period for autumn-sown sugar beet in particular, which may have strong effects on SLA and therefore early biomass accumulation.
The objectives of the present study were therefore: (i) to describe the average canopy SLA dynamics of (winter) sugar beet before and after winter and (ii) to develop an empiric approach to describe SLA dynamics over time under varying environmental conditions.
MATERIALS AND METHODS
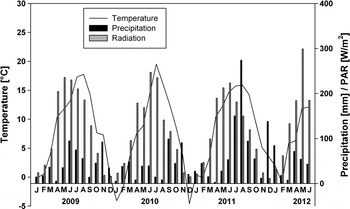
Field trials were carried out from 2009/10 to 2011/12 at the Hohenschulen research farm of Kiel University (54°18′N, 9°58′E, 30 m a.s.l.) to analyse the growth of winter sugar beet. The soil is sandy loam (Luvisol) with a plant available water-holding capacity of c. 160 mm at up to 1 m depth. The annual average air temperature is 8·5 °C and the annual precipitation is c. 750 mm, distributed quite evenly throughout the year (Fig. 1).
Monthly average values of temperature and PAR as well as monthly precipitation sum for the years 2009–2012 at the research farm Hohenschulen, North Germany.

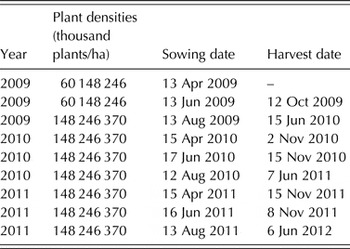
The experiments were split-plot designs (four replications) with the main plot sowing date and the sub-plots plant density, each with three factor levels. The sowing dates were mid-April, mid-June and mid-August to achieve a large variation in radiation and temperature environment. Crops were manually thinned at the 2–4 leaf stage, growth stage (GS) 12–14 on the BBCH scale (Meier Reference Meier1997), from denser stands (seed distance 3 cm) to the target plant density. The three plant densities were 148 000, 246 000 and 370 000 plants/ha, resulting in average distances between plants in a row of 15, 9 and 6 cm, respectively. The plant densities were higher than usual commercial practice (>100 000 plants/ha) to test the effect of plant density on overwintering success and biomass yield of bolting winter beet. Therefore, the two early sowing dates of the first experimental year (April and June 2009) had a lower plant density (60 000 plants/ha) instead of the highest plant density (370 000 plants/ha) (Table 1). In the following years the lower plant density was omitted in favour of the higher plant density (370 000 plants/ha).
Overview of the sowing and last sampling dates for the field experiments used in this study

The August-sown beet was harvested in the following spring at the onset of flowering (beginning of June). This was necessary to prevent seed production, which leads to problems with weed beet plants. Therefore, the maximum LAI achieved was limited due to bolting and the early harvest.
Plots were 4 m long with six rows 45 cm apart. The variety Theresa (KWS, Einbeck, Germany) was cultivated and 60 kg N/ha was applied to the soil as calcium ammonium nitrate (CAN) shortly after sowing. Additionally 100 kg N/ha was applied to the soil as CAN in the following spring for the autumn-sown beet. Appropriate plant pesticides protected the crop from weeds, pests and diseases. If necessary, additional hand weeding was carried out. Weather data were recorded by a weather station at the farm.
Dry matter yield of each plot was determined by harvesting 12 plants per plot from the four inner rows out of the six-row plots by taking three adjacent plants per row. The sampling area was recorded for each plot to determine the soil surface from which the samples were taken and the measured values subsequently calculated/m2 soil surface to correct for different distances between plants. The plants were separated into storage root, petioles and leaves, washed with cold water, dried by air or in cloths and weighed. Leaf and petiole surface was measured by a LAI 3100 device (LI-COR, Lincoln, NE, USA) considering only the green surface area and using sub-samples if appropriate. The samples or sub-samples of petioles and leaves were then dried at 65 °C for 72–96 h and additionally for 4 h at 105 °C to determine the dry matter content.
Leaf area index (dimensionless) was calculated from the measured values of leaf surface and soil surface.
Specific leaf area (m2/kg) was calculated as the ratio of the total measured leaf area (m2/m2) to the corresponding leaf dry matter (kg/m2) representing the average of the 12 sampled plants. The petiole was not considered in the calculations. The data shown for LAI and SLA are the mean values of the four replications for each plant density. Daily air temperature and photosynthetic active radiation (PAR) were averaged over 10 days before the plant sampling dates (T mean, PARmean) according to Kage et al. (Reference Kage, Alt and Stützel2002). Temperature sum (T sum) was calculated in °C from the sowing date, assuming a base temperature of 3 °C, which is required for growing processes in sugar beet according to Milford et al. (Reference Milford, Pocock and Riley1985).
Statistical analysis
Statistical analysis was done with the statistical software ‘R’ version 2.15·1 (R Core Team 2012), using the ‘lm’ and ‘anova’ functions to test for differences in LAI and SLA depending on plant density.
The regression analysis started with a model including the four factors mentioned above (T mean, T sum, PARmean and LAI) and their interactions, subsequently eliminating all non-significant parameters and interactions. Finally, only significant parameters (P < 0·05) (T mean, PARmean and log (T sum)) (Eqn 1) remained in the model following the procedure of Faraway (Reference Faraway2004): the log of T sum was used because it provided a better linear correlation than T sum. Therefore, all data of all sowing times and plant densities were used.
This procedure resulted in the following regression equation:
 $${\rm SLA} = a + b \times T_{{\rm mean}} + c \times {\rm PAR}_{{\rm mean}} + d \times T_{{\rm mean}} \times \log \,(T_{{\rm Sum}} )$$
To test the regression model separately for both beet types (summer and winter), two datasets were built. The summer beet dataset contained sowing dates in April and June while the August sowing time was built into the winter beet dataset. However, due to frost kill that affected the beet sown in April and June, only the August-sown winter beet was included post-winter measurements.
Cross-validations for the regression model were conducted using the data from 1 year for calibration and the two remaining years as validation data, to evaluate the robustness of the parameterization and the predictive power of the regression for dynamic modelling.
RESULTS
There was partial snow cover in the winters and minimum daily mean temperatures were −9·9, −10·5 and −13·9 °C for 2009/10, 2010/11 and 2011/12, respectively. Due to severe frosts in all three winters, only the August-sown plants survived and started to re-grow in the following spring. Therefore, plants sown in April and June are only considered until the beginning of winter. The April-sown crop in 2009 (uneven establishment) and the plant density of 60 000 plants/ha were excluded from further analyses.
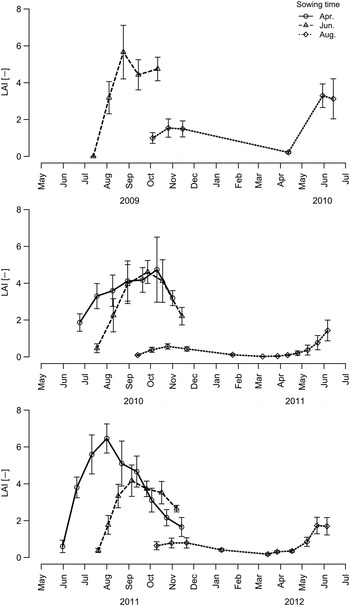
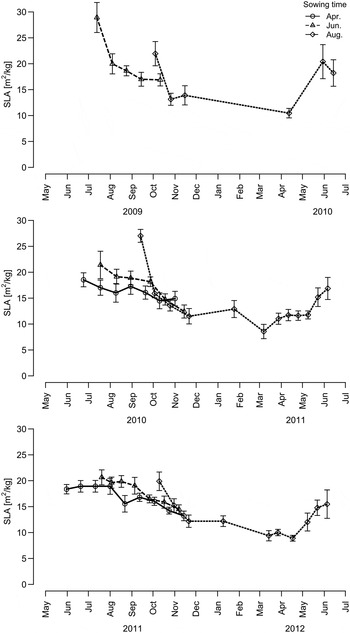
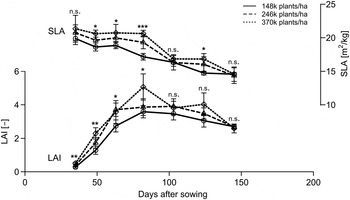
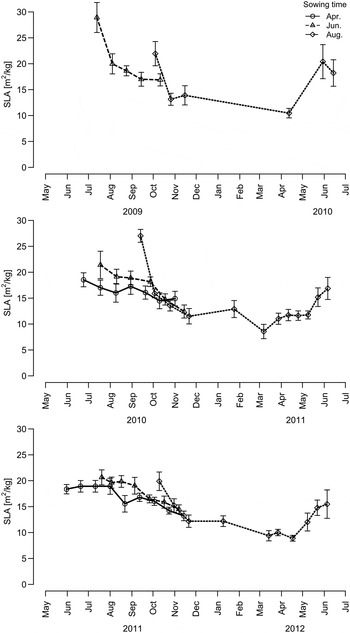
The dynamics of LAI depended on both sowing time and plant density. Autumn-sown sugar beet achieved the highest LAI of 2–3 after winter, but never exceeded the LAI of beet sown in April or June, which had LAI values up to 6 (Fig. 2). In all years and treatments, SLA distinctly decreased, from 20–30 m2/kg shortly after emergence down to 10–15 m2/kg before winter (Fig. 3). After winter, SLA increased; however, the slope varied between treatments and years. At the first measurement dates, it was found that both LAI and SLA tended to increase with increasing plant density. However, after reaching the maximum LAI the differences between plant densities for LAI and SLA were not significant for most measurement dates (Fig. 4). Since LAI and plant density are positively correlated, plant density is not considered separately in the following steps.
Time course of the LAI for three different sowing times for the years 2009–2012 (error bars indicate the sd). The values for each sowing time are averages of all three plant densities. Data for sowing time April 2009 are not shown.

Time course of the SLA for three different sowing times for the years 2009–2012 (error bars indicate the sd). The values for each sowing time are averages of all three plant densities. Data for sowing time April 2009 are not shown.
Time course of LAI and SLA for three plant densities for sowing time June 2011. Asterisks indicate the significance level of differences between the plant densities (*P 0·05, **P 0·01, ***P < 0·001) (ANOVA).

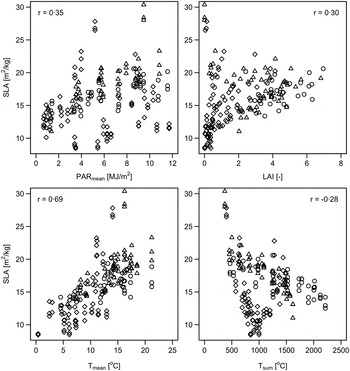
Four dependent climatic variables and their interactions with the SLA dynamics were investigated: mean PAR over 10 days (PARmean), LAI, mean temperature over 10 days (T mean) and temperature sum (T sum). Each of these factors correlated positively with SLA, except for T sum (Fig. 5). The strongest correlation was found between T mean and SLA (r = 0·69); the weakest between T sum and SLA (r = −0·28).
Correlation of SLA depending on mean photosynthetic active radiation over 10 days before measurement (PARmean), LAI, mean temperature over 10 days before measurement (T mean) and temperature sum since sowing (T Sum). Different sowing times are represented by different symbols for April (O), June (∆) and August (◊). All found correlation coefficients are significant (P < 0·001).

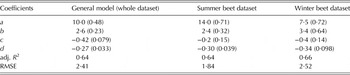
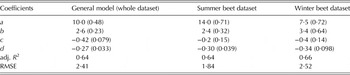
A multiple linear regression model including the four previously identified factors and their interactions was fitted to the dataset, resulting in an adj. R 2 of 0·8. Log (T sum) was used instead of T sum because it showed a better linear correlation with SLA. Subsequently, all non-significant factors were omitted from the model. In the end, T mean and PARmean as well as the interaction between T mean and log (T Sum) remained in the model (Eqn 1). Since this model consists only of factors which can be calculated from weather data, the factor log (T sum) may indirectly account for the changing crop status. The regression parameters show a positive correlation between SLA and T mean, while negative parameters were found for PARmean and the interaction between T mean and log (T sum). This relationship was found over the different datasets used (Table 2). The intercept was estimated to be higher for summer beet than for winter beet, while the effects of temperature and radiation (coefficients b and c) have a stronger influence on SLA for winter beet than for summer beet.
Coefficients for the linear regression model SLA = a + b T mean + c PARmean + d T mean log (T sum) (s.e. in brackets). Every estimated coefficient is significant (P < 0·05). Root mean square error (RMSE) and adj. R 2 are given for the comparison between simulated and measured values
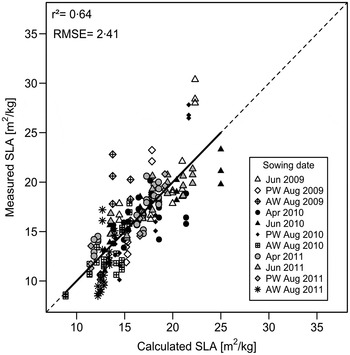
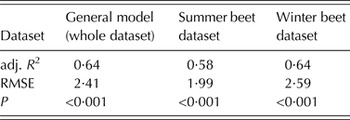
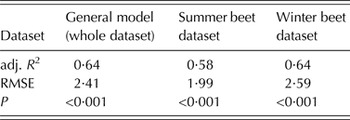
For the general model the coefficient of determination was 0·64 and there were no obvious systematic deviations of single sowing times or years, indicating that both pre-winter and post-winter development of SLA can be described by one model (Fig. 6). The performance of the general model for the summer beet dataset and the winter beet dataset also showed no bias towards any one beet type (Table 3).
Calculated and measured mean SLA for three sowing times in the years 2009/10–2011/12 (Apr. 2009 is not shown). PW, pre-winter measurements; AW, after-winter measurements.

Performance of the general model for the whole dataset, summer beet dataset and winter beet dataset (RMSE, root mean square error)
High SLA values (>23 m2/kg), originating from the first measurements of each sowing time at BBCH GS18–31 (Meier Reference Meier1997), indicated an underestimation of early values by the model.
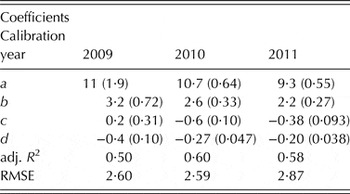
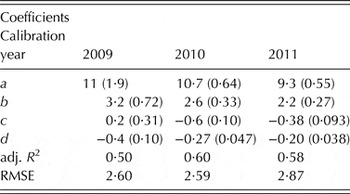
The results for cross-validation of the regression model for all beet types are summarized in Table 4. Using data from 2009 instead of 2010 or 2011 for calibration resulted in a lower adjusted R 2, presumably because the dataset of 2009 only included the sowing dates of mid-June and mid-August while the mid-April sowing date was missing. The parameter c describing the influence of PARmean is positive for the calibration year 2009 while it is negative for the calibration years, 2010 and 2011.
Results for cross-validation for different years in the dataset (s.e. in brackets). The data of 1 year were used for calibration and the two remaining years as validation data. Coefficients are given for the calibration data. Root mean square error (RMSE) and adj. R 2 are given for the validation dataset
DISCUSSION
The main objective of the present study was to study average canopy SLA dynamics of (winter) sugar beet in autumn and spring under the climate conditions of northern Germany and to develop an approach for its prediction within the framework of a crop growth model.
Specific leaf area reached its highest values directly after emergence and decreased until leaf growth stopped due to low temperatures in winter. These high initial values of SLA in the first weeks after emergence were most probably due to a pre-determined development pattern, affected only slightly by environmental factors. A similar pattern has been shown to be typical for the early growth stages of many crops (Asch et al. Reference Asch, Sow and Dingkuhn1999; Lafarge & Hammer Reference Lafarge and Hammer2002; Liu et al. Reference Liu, Zhang, Yang, Wu, Xie, Zeng, Yin and Liu2009), since the crops can absorb more radiation for further growth by developing as much leaf area as possible and also profit by suppressing the growth of competing plants, e.g. weeds.
Many studies have shown a negative correlation between SLA and radiation intensity (Reich et al. Reference Reich, Ellsworth, Walters, Vose, Gresham, Volin and Bowman1999; Evans & Poorter Reference Evans and Poorter2001). Accordingly, the linear regression model used in the present study included a negative effect of PARmean (negative parameter c; Table 2). During autumn growth with decreasing radiation, an increase in SLA might therefore be expected. However, the data clearly showed a strong decrease in SLA in late summer and early autumn. Several mechanisms may be responsible for this.
Generally, there is a trend towards decreasing SLA during the growth period. As the single leaf expands in size during its life-cycle, the amount of structural plant tissue required to stabilize the leaf increases and, therefore, as the leaf gets thicker, SLA decreases. Such a general decrease of SLA with time due to leaf maturity has been reported by Reich et al. (Reference Reich, Ellsworth, Walters, Vose, Gresham, Volin and Bowman1999) and Rinaldi (Reference Rinaldi2003). These effects are accounted for by the influence of log (T sum) in the regression model so that simulations using the model also show a decrease of SLA throughout the growing period.
Both LAI and SLA tended to increase with increasing plant density, indicating a mutual shading effect. The SLA increases due to lower average radiation intensity for the whole canopy with higher LAI. This possible effect of plant density will occur as long as it has an effect on LAI. After reaching the maximum, differences in LAI between plant densities disappear and the effect can no longer be found. For winter wheat, the effect of mutual shading and the influence on SLA was shown by Ratjen & Kage (Reference Ratjen and Kage2013).
Lower temperatures, especially at the beginning and the end of the growing season, affect the expansion rates of sugar beet leaves. Milford et al. (Reference Milford, Pocock and Riley1985) showed a linear increase of the expansion rate of single sugar beet leaves in a temperature range of 3–20 °C; however, they did not determine the SLA, so it can only be assumed that a change in the leaf area expansion due to temperature changes is also correlated with SLA changes. Evans (Reference Evans1989) and Reich et al. (Reference Reich, Ellsworth, Walters, Vose, Gresham, Volin and Bowman1999) reported a positive relationship between SLA and temperature. For wheat, Hotsonyame & Hunt (Reference Hotsonyame and Hunt1998) described the positive effect of temperature on SLA. A decrease of SLA due to low temperatures can also be found in other plant species, e.g. in legumes (Hekneby et al. Reference Hekneby, Antolín and Sánchez-Díaz2006), and is generally seen as a typical adaption (Armstrong et al. Reference Armstrong, Logan and Atkin2006; DeRidder & Crafts-Brandner Reference DeRidder and Crafts-Brandner2008). For sunflower, Tardieu et al. (Reference Tardieu, Granier and Muller1999) found that SLA increases if the environmental conditions suppress expansion rate more strongly than the photosynthesis rate and vice versa. The current findings indicate a larger effect of mean temperature on SLA dynamics for winter sugar beet than radiation intensity.
The decrease in SLA at temperatures >20 °C, as found by Donatelli et al. (Reference Donatelli, Bellocchi, Criscuolo and Maestrini2006) and Hotsonyame & Hunt (Reference Hotsonyame and Hunt1998), could not be confirmed by the current findings, as these temperatures were reached only once in the current measurements. Therefore the assumed positive linear correlation of T mean and SLA seems justified in the regression model for the climatic conditions of northern Germany.
During spring growth after overwintering, SLA changes were different from those in autumn because SLA increased only slightly. At the final harvest, SLA achieved a level of 15–20 m2/kg. Corresponding with the current findings, Rinaldi (Reference Rinaldi2003) found higher SLA values for spring-sown beet than for autumn-sown beet. Many new leaves appear due to increasing temperature, resulting in an increase of SLA. This pattern could be explained by different base temperatures for leaf appearance (1 °C) and leaf expansion (3 °C) (Milford et al. Reference Milford, Pocock and Riley1985). Assuming that this also applies to bolting beet, the cells of the new leaves are not fully expanded due to the comparatively low temperatures in April, which decreases SLA values. With higher plant densities, competition effects may interfere with this mechanism.
The SLA in the present study was determined at the canopy level, whereas many other studies analysed the SLA dynamics for single leaves. Assuming a constant SLA for older leaves (Rinaldi Reference Rinaldi2003), variation of the SLA in the canopy is mainly caused by newly grown leaves. Therefore, SLA response to environmental changes at the canopy level is slower, as it includes older as well as younger leaves. Measurements at the canopy level also include the effects that leaves higher up the plant have on lower ones, for example self-shading, while single-leaf measurements avoid this effect.
The second aim of the present study was to develop an approach to predict the SLA dynamics during the growth period, a prerequisite for successful simulation of the yield potential of overwintering sugar beet.
To describe the SLA dynamics, a linear regression model was used showing the best fit if T mean, log (T sum) and mean photosynthetic active radiation (PARmean) were included. In contrast to spring-sown sugar beet, winter sugar beet experiences a high degree of environmental changes (temperature, radiation etc.), which can strongly affect SLA dynamics (parameters b and c) during the growing period. The SLA and mean temperature revealed the strongest correlation. Donatelli et al. (Reference Donatelli, Bellocchi, Criscuolo and Maestrini2006), describing the effect of temperature on SLA for sugar beet in northern Italy, proposed a dynamic approach to simulation of SLA depending on the mean air temperature. The fact that the regression model also works for the post-winter development in spring indicates a similar underlying process of SLA dynamic before and after winter.
The cross-validation revealed that the parameters for the general linear regression model are fairly stable except for the influence of PARmean when using the 2009 data for calibration. This is probably due to the fact that the 2009 data contain sowing dates in June and August only, implying decreasing radiation throughout the growing period except for the very few measurements after winter. Therefore, decreasing radiation goes along with increasing leaf maturity in this case. A broadening of the database for a further parameter estimation including contrasting sowing dates and different overwintering conditions would be desirable.
Currently the only feasible approach to evaluate potential yield advantages of winter sugar beet is to use a simulation model, because conventional biennial beet will start to bolt in spring after overwintering. A bolted sugar beet, however, is of limited value for the sugar industry, since sugar content decreases. Although non-bolting varieties have not been developed until now, the genetic mechanism to control bolting is known (Pin et al. Reference Pin, Benlloch, Bonnet, Wremerth-Weich, Kraft, Gielen and Nilsson2010, Reference Pin, Zhang, Vogt, Dally, Büttner, Schulze-Buxloh, Jelly, Chia, Mutasa-Göttgens, Dohm, Himmelbauer, Weisshaar, Kraus, Gielen, Lommel, Weyens, Wahl, Schechert, Nilsson, Jung, Kraft and Müller2012) and could in principle be used to develop such varieties.
The transition from (leaf) biomass to LAI via SLA is a sensitive step in dynamic crop models, as erroneously estimated SLA values (e.g. constant) will affect further radiation absorption and therefore biomass production of the plant. Some models which use SLA to determine the LAI from multiplying leaf dry matter by SLA (SUBEMOpo (Vandendriessche Reference Vandendriessche2000), SUCROS (Van Laar et al. Reference Van Laar, Goudriaan and Van Keulen1997), CropSyst (Stöckle et al. Reference Stöckle, Donatelli and Nelson2003) could easily implement the current approach taking the SLA dynamics over time into account. This approach also allows simulation of leaf area formation and therefore yields in order to evaluate the potential advantages of (winter) sugar beet. The regression model only includes factors that can be obtained easily from weather data. It avoids error-prone feedback loops that may arise from using model-calculated values of LAI to predict SLA in a dynamic crop growth model.
CONCLUSION
The relationships found describe the average canopy SLA dynamics of sugar beet from spring to autumn and the re-growth period of overwintering sugar beet in the next spring. The current findings suggest that average canopy SLA dynamics are mainly temperature-driven. In order to apply these findings in dynamic growth models, a regression model is proposed that might improve the prediction of these models in terms of leaf area, light absorption, dry matter production and yield formation.