


Introduction
At its maximum extent (September-October), Antarctic sea ice covers an area of approximately 19 x 106km2 (Reference Gloersen, Campbell, Cavalieri, Comiso, Parkinson and ZwallyGloersen and others, 1992). Leads, or linear openings, are largely ephemeral, and open and close with changing synoptic conditions. Polynyas, on the other hand, which are non-linear areas of open water or thin ice up to 0.3 m thick (WMO, 1970), tend to be persistent and even recurrent features which remain partially or totally ice-free in areas normally expected to be ice-covered (Reference Smith, Muench and PeaseSmith and others, 1990).
Two types of polynya occur: (i) sensiblc-hcat polynyas, where ocean turbulence and the upwelling of relatively warm deep water prevent or inhibit sea-ice formation, and (ii) lalent-heat polynyas, where new ice is removed by winds and ocean currents as it forms (Reference PeasePease, 1987; Reference AndersonAnderson, 1993). Here, we concentrate on latent-heat polynyas, which in Antarctica are almost exclusively coastal. For a discussion of sensible-heat polynyas in East Antarctica, see Reference Comiso and GordonComiso and Gordon (1987, Reference Cotton and K. J.1996), Reference Takizawa, Ohshima, Ushio, Kawamura and EnomotoTakizawa and others (1994) andWakat-suchi and others (1994).
Latent-heat polynyas can have a large impact on regional air—sea-ice interaction processes. Air-water temperature differences of-20°C can occur in polynyas, causing ocean atmosphere heat fluxes in excess of 500 Wm−2 in winter (Reference Fahrbach, Augstein, Olbers and HempelFahrbach and others, 1994). This is 1-2 orders of magnitude greater than estimated through the thicker ice cover surrounding the polynya (Reference Worby and AllisonWorby and Allison, 1991). Potter (1995) estimated from a high-tenxporal-rcsolution study of the Cape Darnley polynya that the average heat flux from the polynya is about 430 wm −2 For this reason, polynyas may dominate the regional heat flux, particularly in winter (Reference Adolphs and WendlerAdolphs and Wendler, 1995), in spite of comprising only a small area of the pack. The resultant heat and water-vapour transport from the open water surface can also lead to significant local climatic modifications (Takizawa and others, 1994). Due to the importance of polynyas in regional heat budgets, interannual changes in polynya characteristics may be sensitive indicators of climate change (Reference Mysak and HuangMysak and Huang, 1992). For this reason, it is vital to understand the natural interannual variability in the occurrence of polynyas.
Particularly rapid sea-ice formation and export occurs where strong and persistent katabatic winds emerge from the continent via valleys in the ice-sheet topography, often associated with outlet glaciers. Polynyas in such locations are thought to be sites of significant water-mass modification due to the high salt flux into the ocean associated with enhanced ice growth. This acts as a negative buoyancy source near the coastal boundary, producing lateral densit) currents in the shelf waters which drive a baroclinic circulation Reference Garwarkiewicz and ChapmanGarwarkiewicz and Chapman, 1995). The cold, dense water also contributes in certain locations to the production of Antarctic BottomWater (Gordon, 1982; Reference FosterFoster, 1995). Polynyas can also form oases for biological activity (Massom, 1988). Although the degree to which regional productivity and biomass at higher trophic levels in winter are dependent on the presence of polynyas is largely unknown, the latter are considered to be a critical component in the ecology of certain species (Stonchouse, 1967; Massom, 1988). Through the removal of CO.? to the deep ocean, via biological cycling and gas absorption at the ocean surface, polynyas may be significant high-latitude carbon sinks, and as such may provide a negative feedback to the greenhouse effect (Reference Yager, Wallace, Johnson, Smith, Minnell and DeiningYager and others, 1995). For these reasons, coastal polynyas may play a significant role in determining the large-scale dynamics, thermodynamics and chemical characteristics of the global ocean and atmosphere.
Locations ofcoastal polynyas in East Antarctica from 40-160°E. The approximate maximum extent of each polynya as observed during the study period is marked. The base map is of predicted streamlines of near-surface gravity drainage winds over the Antarctic continent (from Reference Parish and BromwichParish and Bromivich, 1987). After Potter (1995) and Worby and others (1997).

The occurrence of polynyas in East Antarctica has been noted since the early expeditions, but their overall distribution was not known until the advent of polar-orbiting satellites. Using early Nimbus satellite visible and infrared images, Reference Knapp and KarlssonKnapp (1972) concluded that short-term variability in the Cape Darnley and Dibble Iceberg Tongue polynyas (Fig. 1) was related to prevailing synoptic systems. Reference Zwally, Comiso, Gordon and S. S.Zwally and others (1985) related polynya opening and closing to changes in synoptic wind forcing in eight regions of East Antarctica, and estimated total ice production and salt fluxes in all polynyas around Antarctica. Reference Cavalieri, Martin and JacobsCavalieri and Martin (1985), also using passive-microwave data but over a 3 month period, calculated that six coastal polynyas between the Shackleton Ice Shelf and the Mertz Ice Tongue (Fig. 1) produced about 10 m of ice per season per unit ana, compared to 1 m of ice growth for adjacent fast ice. Reference Cotton and K. J.Cotton and Michael (1994) showed a strong relationship between katabatic winds and polynya occurrence offshore from Law Dome Williamson Glacier and Vincennes Bay) using advanced very high-resolution radiometer (AVHRR) data. Adolphs and Wendler (1995) also used AVHRR imagery to investigate polynya behaviour in response to katabatic winds oil Ierre Adélie and King GeorgeV Land. For a treatment of the complex mechanisms that affect the size of coastal polynyas, the reader is referred to Pease (1987) and Reference Darby, Wilmott and SomervilleDarby and others (1995).
In this study, we use satellite passive-microwave data to identify polynyas in East Antarctica between 40° and 160°Ε, and quantify seasonal and interannual variability in the polynya spatial characteristics. We then evaluate the primary mechanisms responsible for polynya formation and maintenance at each site. A summary of sca-icc conditions in the same region is represented by Worby and others (1998).
Data and Methods
Sea-ice concentration
The location and spatial and temporal variability of polynyas were determined from ice concentrations derived from special sensor microwave/imager (SSM/I data using the algorithm of Cavalieri and others (1984), and mapped to a standard polar stcrcographic grid (NSIDC, 1996). Sources of error relate to the difficulty in distinguishing open water and new ice from low concentrations of thick ice, compounded by mixing effects due to the presence of various ice types with in the large (25 x 25 km) pixel. Contamination of coastal pixels by the adjoining ice sheet may occur, although this effect is minimal for larger polynyas. Moreover, overestimates of ice concentration may occur in large polynyas clue to the effects of wind-roughening of open water on the emis-sivity (Reference Steffen and SchweigerSteffen and Schweiger, 1991). in order to minimise these effects, this study uses monthly-averaged data.
Delineation and location of polynyas
Polynyas were initially identified and delineated by applying a 75% ice-concentration threshold to the SSM/I monthly images. The number of pixels was counted for three ice-concentration ranges: 75-66%, 65-56% and ≤55%. An assessment was then made of the persistence, recurrence, maximum area, average area and minimum ice concentration of each area. Only data for June-October were analyzed, for the years 1987-94, as sea ice typically retreats to the coast at other times. The efficacy of the 75% threshold was determined through an interactive analysis of lest winter images oxer a wide range of values at 5% increments; at lower thresholds, il was difficult to distinguish certain polynyas from the marginal ice zone. Although Gloersen and others (1992) estimate that the average concentration for the total winter seasonal sea-ice zone is 79%, this is weighted to a large extent by the low concentrations in the marginal ice zone. Higher concentrations occur in the ice surrounding coastal polynyas in winter.
Bathymetry and icebergs
Possible bathymétrie controls on polynya location were examined using data derived primarily from the predicted sca-floor topography for the Southern Ocean (Smith and Sandwell, 1994) and ETOPO-5 (NOAA, 1988). in addition, the General Bathymetrie Chart of the Oceans (GEBCO), 5th edition, sheet 18 (circum-Antarctic) (Reference Vanney, Johnson and JacobsVanney and Johnson, 1985), was used to determine the bathymetry at the sites of polynyas.
Large icebergs, grounded on shoals, can have a significant localised effect on sea-ice distribution. Iceberg locations and fast-ice extent were derived from weekly sca-icc concentration charts produced by the U.S. National Ice Center. These charts record the position and size of icebergs with a major axis greater than 27 km. During the 8 year study period, the movement of five icebergs was monitored. These icebergs became grounded on 200-500 m deep banks and remained at fixed locations for periods of up to 8 years.
Meteorological data
Polynya locations were compared with katabatic outflow patterns as derived by Parish and Bromwich (1987). in the coastal areas, katabatic drainage is typically funnelled by ice-sheet topography and often associated with outlet glacier valleys (Fig. 1). Based upon observations from drifting buoys (Worby and others, 1997), mean synoptic wind and current directions in the near-coastal belt are taken to be predominantly to the west with in the East Wind Drift. Although synoptic winds play a significant role in the short-term opening and closing of polynyas, such changes are not resolved in the current study, which uses monthly average SSM/I data.
Results and Discussion
Locations of polynyas
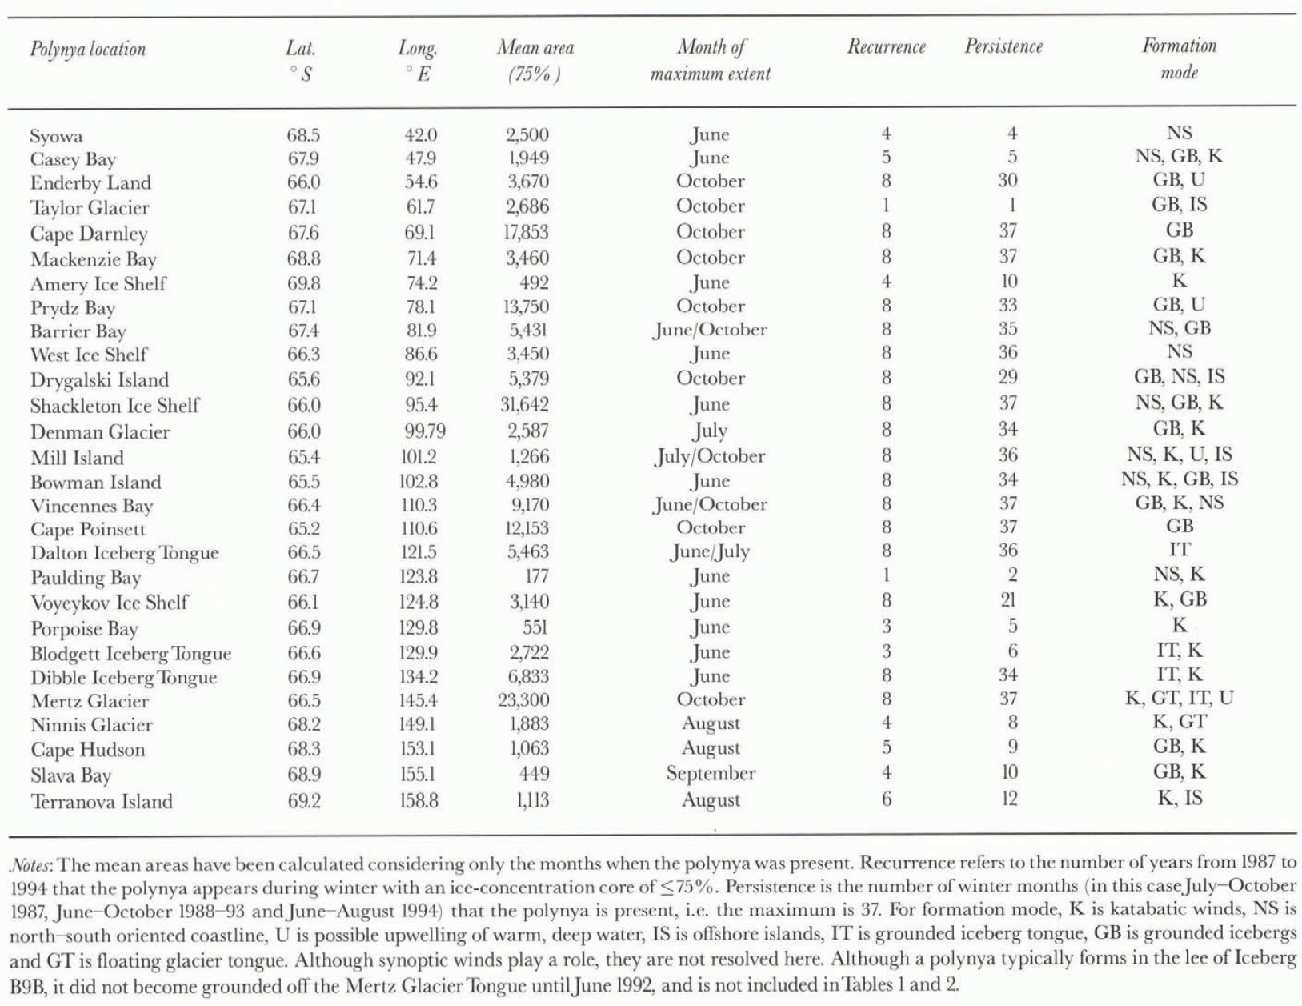
Of the 28 polynyas identified, 26 are in the lee of protruding coastal features, iceberg tongues or icebergs grounded on shallow banks (Table 1, all except the Amcry Ice Shelf and Porpoise Bay), which inhibit the westward advection of the pack near the coast. A good example is the large polynya west of the Mertz Glacier Tongue, which extends northward approximately 100 km from the coast into the pack in the vicinity of 145° Ε (Wendler and others, 1996). The formation of fast ice around a line of grounded icebergs on a shoal directly north of the glacier (marked Β in fig. 2a) effectively extends the meridional blocking by about a further 100 km, and as such has a significant effect on the polynya size. figure 2b shows the correspondence between grounded icebergs and regions of relatively shallow water. The terminus and iceberg locations were determined from a U.S. Defense Meteorological Satellite Program Operational Linescan (OLS) image from 23 November 1996 (courtesy of the U.S. National Ice Center). The line of icebergs emanating from Mertz Glacier and other north-south-trending series of grounded icebergs may form semi-permanent blocking features. Another example is the Dibble Iceberg Tongue which, although not strictly a continuous tongue oficebcrgs, forms a significant barrier to the westward ice drift at approximately 134° E, contributing to polynya formation to the west.
locations and areal characteristics ofcoastal polynyas (in km) from 40 160° E, based upon the 75% ice-concentration threshold, mean timing of maximum polynya areal extent and modes information
(a) An AVHRR channel 4 image of the Mertz Glacier Tongue and associated polynya on 8 August 1995, collected at Casey Base. Iceberg B9B is also visible under cloud. B is Jast ice around grounded iceberg. The Mertz Glacier, Ninnis Glacier and Cape Hudson polynyas are marked N, and CH, respectively. Image courtesy of the Commonwealth Scientific and Industrial Research Organisation (CSIRO) Division of Marine Research, (b) A schematic of the Mertz Glacier Tongue, grounded icebergs and approximate polynya location (based upon (a)) overlying the bathymetry as derived from ETOPO-Sdata (NOAA, 1988). The bathymetrie contour units are in metres, and the resolution is 5 min x 5 min.

Bathymetry thus provides an important control on polynya formation and maintenance. The continental shelf off East Antarctica is characterised by Glaciol troughs, often deeper than 1000 m, the deepest being the Lambert Glacier Trough with a depth of 3400 m (Morgan and Budd, 1974). These troughs are situated near the coastal boundary and may be either parallel or normal to the coast. They are often flanked by shallow banks which rise to within 200 m of the sea surface (Wright and others, 1983). Large icebergs become grounded on these banks and may remain in the same location for a number of years, having a significant effect on the regional sea-ice distribution. Iceberg B9B is one such feature (fig. 2a and b); it became grounded off the Mertz Glacier Tongue injurie 1992 (Reference KeysKeys, 1994).
The areal extent of the Mertz Glacier polynya as a function of time for the winter months of 1987 94, as determined by applying three ice-concentration thresholds to the SSM/I data.
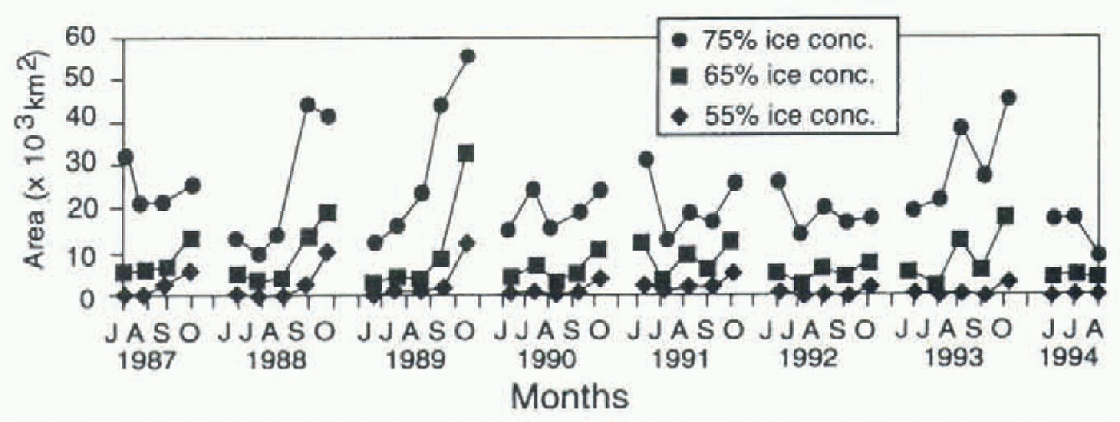
The formation of the Mertz polynya is also related to persistent katabatic winds channelled through the valley of Mertz Glacier. Katabatic winds in this region of the Terre Adélie coast are the strongest anywhere in Antarctica (Adolphs and Wendler, 1995). Plotting the areal extent of the Mertz Glacier polynya as a function of time (Fig. 3) shows it to be a persistent and recurrent feature that typically attains its largest size fairly consistently in October each year, at the approximate time of the maximum pack-ice extent (Worby and others, 1997). This polynya has an average size of over 23000 km−2 in winter (table 1) and extends about 200 km offshore. It is present in all of the months examined, and consistently has a large core of ice concentrations of < 65%.
Katabatic winds are thought to contribute at least partially to the formation and maintenance of 18 of the 28 polynyas identified (Table 1; Fig. 1). Such strong, cold winds have a significant effect on ice formation and removal in that they can persist for up to 9 months a year (Parish, 1988). Their influence can extend up to 120 km offshore (Adolphs and Wendler, 1995), although a more typical extent is a few tens of km (Bromwich and Kurtz, 1984). Cavalieri and Martin (1985) showed that prevailing easterly winds poleward of the circumpolar trough in winter play a dominant role in the variability of polynya extent. They ascertained that polynyas form to 1 he west ofcoastal protrusions when zonally-propagating storms pass to the north. Areas of open water may quickly freeze following a cessation of the strong winds, or intermittent polynya closure may occur because of a reversal in wind direction. Adolphs and Wcndler (1995) suggested that prolonged, strong winds may act to break up the ice cover, facilitating the formation or expansion of open water by subsequent wind events. These polynyas may then persist in a near-steady-state condition through simultaneous ice production and wind-driven ice-divergence processes. Their size is controlled by the balance between the production and export of sea ice (Pease, 1987; Darby and others, 1995).
Variability in polynya size, recurrence and persistence
Eight of the smaller polynyas are detected only occasionally. The Syowa, Taylor, Amery, Paulding Bay, Porpoise Bay, Blodgett Iceberg Tongue, Slava Glacier and Terra Nova Island polynyas were all present for 4 years or less out of the 8 year dataset (table 1). They are considered to be marginal in the sense that they represent semi-recurrent areas of open water and low ice concentration.
Average annual winter polynya areal extents f in km−2), based upon the <75% ice-concentration threshold, for June-October 1987-93 and June-August 1994
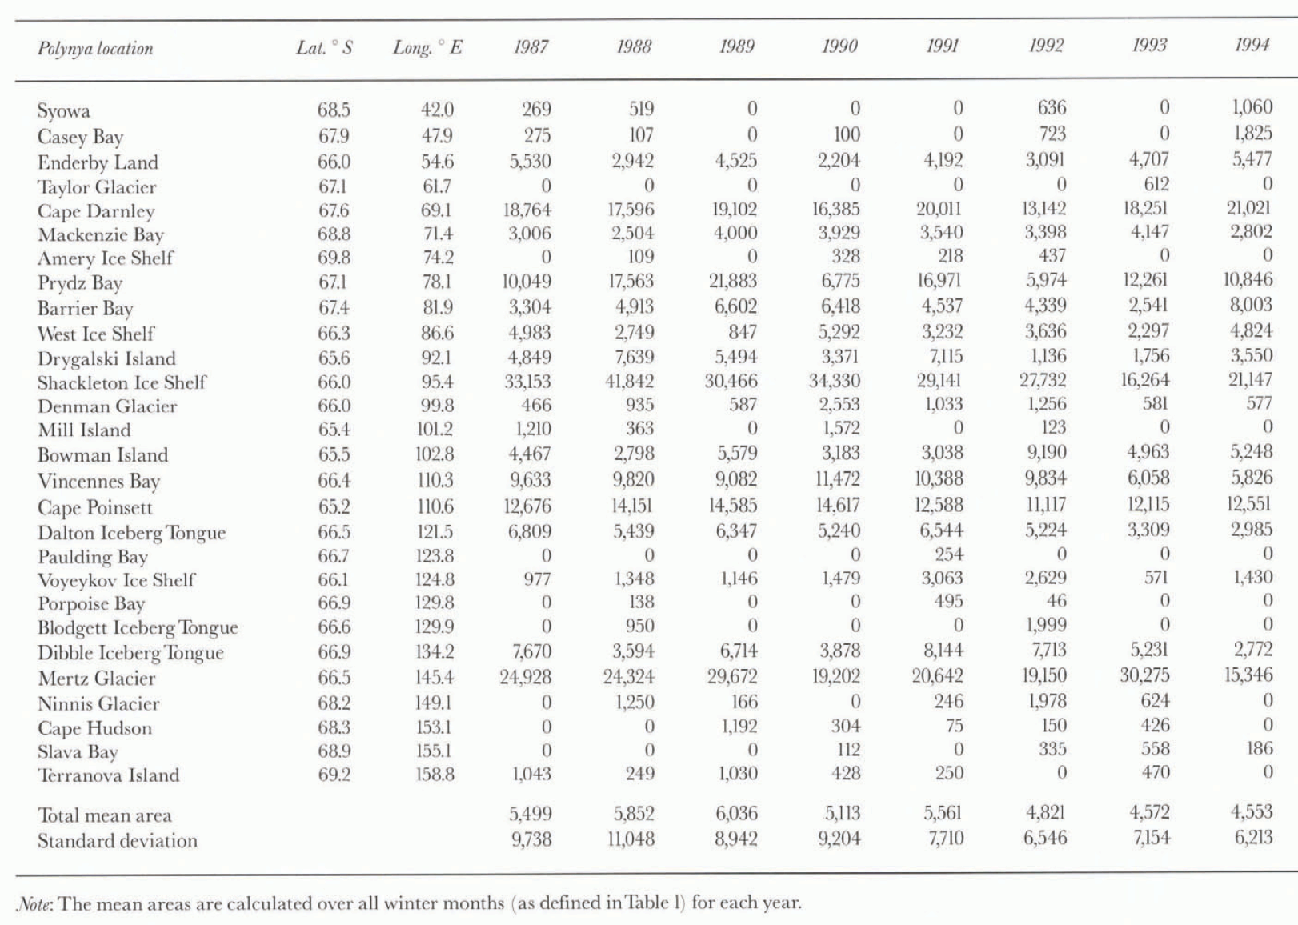
The other 20 polynyas are considered to be recurrent and were present for at least 5 of the 8 years. Their average size over the study period varies greatly, however, ranging from ~ 1000 km2 for the Cape Hudson polynya to ~23 000 km2 for the Mertz Glacier Tongue polynya (based on the 75% ice-concentration threshold). The large area and persistence of some polynyas is likely significant in terms of the regional heat budget and meteorology.
Based upon interannual changes in mean areal extent (table 2), it is apparent that significant differences occur in the average size of the more marginal polynyas. This possibly reflects interannual changes in zonal wind patterns (Cavalieri and Martin, 1985), although no Antarctic circumpolar wave-like phenomena are readily apparent. Annual variations in the mean and standard deviation of total polynya area, shown inTable 2, indicate a slight decreasing trend over the 8 year study period. Larger polynyas, with an average area of > 5000 km2 (e.g. the Cape Darnley, Prydz Bay, Shackleton Ice Shelf, Vincennes Bay and Cape Poinsett polynyas), tend to be more stable in areal extent than smaller polynyas, with the latter showing a higher degree of variability. Large polynyas also have a core consisting of a lower ice concentration, ranging between 55% and 65% and rarely falling below 45%.
The mean timing of maximum polynya extent, given in Table 1, varies froinjune to October. It may allow determination of the potential role of upwelling warm water from the deep ocean in polynya formation (personal communication from S. Rintoul, 1998). Further research is required to establish possible links and their variability.
Polynyas as sites of enhanced melt
Polynyas are not only sites of enhanced ice formation; in spring and summer, they are also regions of enhanced melt with in the pack. Given the narrow width of the pack in East Antarctica, polynyas join with the melting, marginal ice zone to form large regions of reduced ice concent ration. By this process, the pack melts in regions to the south as well as receding poleward. An example is the significantly reduced concentration that typically occurs around 160° E, associated with the shallow plateau at the confluence of the Southeast Indian Ridge and the Macquarie Ridge complex. Similarly, a large embaymenl in the ice ecfge at 145° Ε sometimes encroaches far enough to merge with the large coastal polynya which forms off Mertz and Ninnis Glaciers by October. This connection is not regular, occurring in only ß of the 37 monthly winter images examined. By November, however, the embayment becomes much larger, and is generally joined with the polynya. The polynya increases rapidly in size with the onset of the austral summer, and the embayment usually reaches the coast by December.
Relationship of coastal polynyas to emperor penguin rookeries
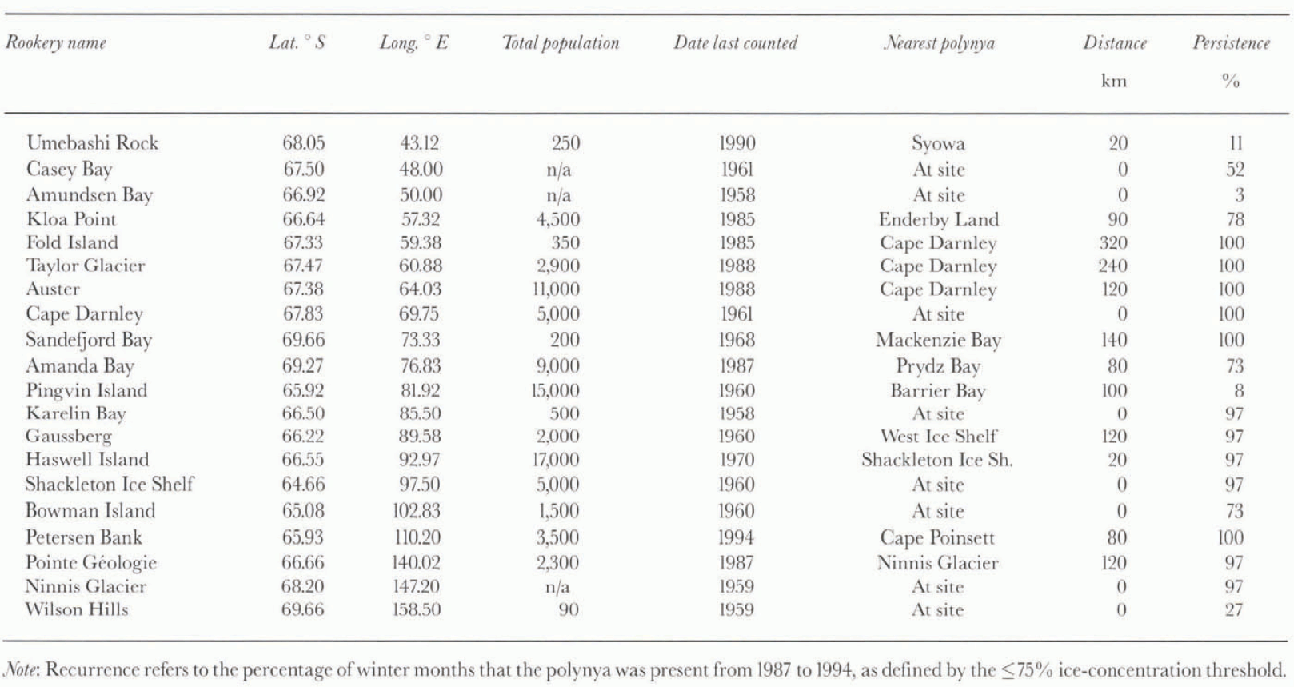
Emperor penguins (Aptenodytesforsteri) have the most southerly breeding distribution of any penguin (Wbehler, 1993). Non-breeding and immature birds have a wide distribution (Massom, 1988), whilst breeding pairs are confined to colonics near the Antarctic coast. These penguins breed during winter, with the male remaining stationary for about 4 months. There are 20 known emperor penguin breeding sites with in the study area (table 3). The most important physical characteristics of the rookeries appear to be stable fast ice, proximity to open water and fresh snow, and shelter from the wind (Reference KooymanKooyman, 1993). Half of the rookeries are located within 20 km of polynyas, and the majority of the remaining colonies are within 150 km of polynya locations, well with in the reported foraging range of this species ( Anee! and others, 1992).
Locations of Emperor penguin (Aptcnodytes forsteri) rookeries relative to pohnyas in the study region (after W)
Conclusions
Through analysis of SSM/I-derived sea-ice concentrations, 28 polynyas were identified around the East Antarctic coast (29 including that in the lee of Iceberg B9B from June 1992 onwards). The areal extent of each polynya was quantified for each winter month from 1987 to 1994. The results suggest that larger polynyas have lower ice concentrations and are more stable spatially. There may be some bias with in the smaller polynyas towards higher concentrations, however, due to the coarse resolution of the data; this would lead to an underrepresentation of the actual variability in ice concentration. One way of counteracting this in a future study may be to employ a technique similar to that of Reference Markus and BurnsMarkus and Burns (1993) to better resolve narrow (i.e. sub-pixcl-scale) polynyas. This technique uses 37 and 85 GHz data successively to take advantage of the higher resolution at 85 GHz, and is based on simulating microwave images of polynya events by convolving an assumed brightness-temperature distribution with the satellite antenna pattern.
The polynyas tend to reduce in size during the colder mid-winter months. This is thought to be related to an increase in ice production associated with colder temperatures, along with a relatively constant rate of ice advection (Pease, 1987; Darby and others, 1995). As a result, several marginal polynyas disappear during the winter months. An analysis of annual winter totals of areas with ice concentrations of < 75% shows no trends in total polynya areal extent over the period 1987-94. The timing of maximum polynya extent may be significant, but future research is necessary.
This study suggests that polynyas are formed as the result of the complex interaction between several processes. Very few coastal polynyas are attributed solely to katabatic outflow. Meridional coastal protrusions, in the form of headlands and floating ice shelves and glacier tongues, block the mean near-coastal westward ice advection. Shallow banks provide a grounding zone for large icebergs, which also act as a barrier to ice drift. Katabatic winds lead to both heavy ice formation and removal of ice from the lee of these barriers. Synoptic winds also play a significant role in polynya formation and maintenance, but are not resolved by this study of monthly variability. Large outlet glaciers act as conduits for katabatic winds from the continent, and consequently a large proportion (66%) ofcoastal polynyas are associated with the front of these features.
The study has shown that known emperor penguin rookeries occur in close proximity to coastal polynyas. This supports the hypothesis that access to a polynya is an important factor controlling their breeding location and success (Reference StonehouseStonehouse, 1967).
Retrospective studies at greater resolution may be possible if recent attempts to produce an automated ice-classification algorithm for AVHRR data (Reference Zibordi and van WoertZibordi and Van Woert, 1993; Nunez and others, in press) prove successful, although cloud cover remains a serious limitation to visible to thermal infrared sensors. Future studies will also benefit from the launch of improved passive-microwave radiometers such as the advanced microwave scanning radiometer ( AMSR) on board ADEOSII and EOS PM-1 by the turn of the century, and also the enhanced coverage offered by Radarsat synthetic aperture radar.
Acknowledgements
SSM/I data were provided by the Earth Observing System Distributed Active Archive Center (DAAC) at the U.S. National Snow and Ice Data Center, University of Colorado, Boulder; the authors are very grateful to C. Hanson and others at User Services, and toV Dirita (Antarctic CRC) for developing software to display and analyze the data. We are also very grateful to our colleagues at the Australian Bureau of Meteorology, S. Pcndlebury, R. Jar-dine and R. Lurz, and at the CS1RO Division of Marine Research, P. Tildesley, K. Badcock and K. Suber, for supplying AVHRR data. Thanks are also due to C. Parkinson (NASA Goddard Space Flight Center) and an anonymous reviewer for helpful review comments, N. Young and G. Hyland (Antarctic CRC) for help in the processing of the AVHRR data, and S. Jacobs (Lamont Doherly Geophysical Observatory), I. Allison, A. Worby and M. Wall (Antarctic CRC), S. Ushio (Japanese National Institute of Polar Research), S. Rintoul (CSIRO Division of Marine Research) and H. Keys (Department of Conservation, New Zealand) for useful suggestions. This paper is based on the Honours thesis work of M. Potter while at the Institute for Antarctic and Southern Ocean Studies (Potter, 1995). We thank N. Bindoff of the Antarctic CRC for help in analysis of the ETOPO-5 data.



