In 2013, the Centers for Disease Control and Prevention (CDC) National Health Safety Network (NHSN), implemented the ventilator-associated event (VAE) surveillance algorithm definition.Reference Magill, Klompas and Balk 1 The VAE definition replaced prior surveillance for ventilator-associated pneumonia (VAP), with 3 tiers of conditions: ventilator-associated condition (VAC), infection-related ventilator-associated complication (IVAC), and possible VAP (PVAP). The definition was designed to rely on objective and potentially automatable criteria; its features were expected to improve reliability and efficiency of surveillance by utilizing data extractable from the electronic health record (EHR).Reference Klompas 2 , Reference Klompas, Magill and Robicsek 3
Since that time, approaches to VAE surveillance using extracts from EHRs have been described,Reference Mann, Ellsworth and Huda 4 – Reference Nuckchady, Heckman and Diehl 7 with varying levels of automation. Here, we report the development and validation of an automated electronic surveillance system using real-time extraction of bedside physiological monitor data, with clinical and demographic data. The performance of the tool demonstrates the advantages of automation, as well as common failures of surveillance, which relies on human review of patient records. Automated surveillance provides opportunities for the implementation of rapid-cycle quality improvement interventions among patients in real time.
METHODS
Setting and Cohort Identification
This retrospective cohort study was conducted at Massachusetts General Hospital (MGH), a 1,056-bed, tertiary-care hospital in Boston, Massachusetts. Patients admitted any of 4 intensive care units (ICUs) during January–March 2015 and January–March 2016 were included in the development and validation cohorts, respectively. The ICUs included a medical ICU (18 beds), a surgical ICU (20 beds), a neurosurgical/neurology ICU (22 beds), and a medical-surgical ICU (18 beds).
Surveillance Methods and Application of VAE Definition
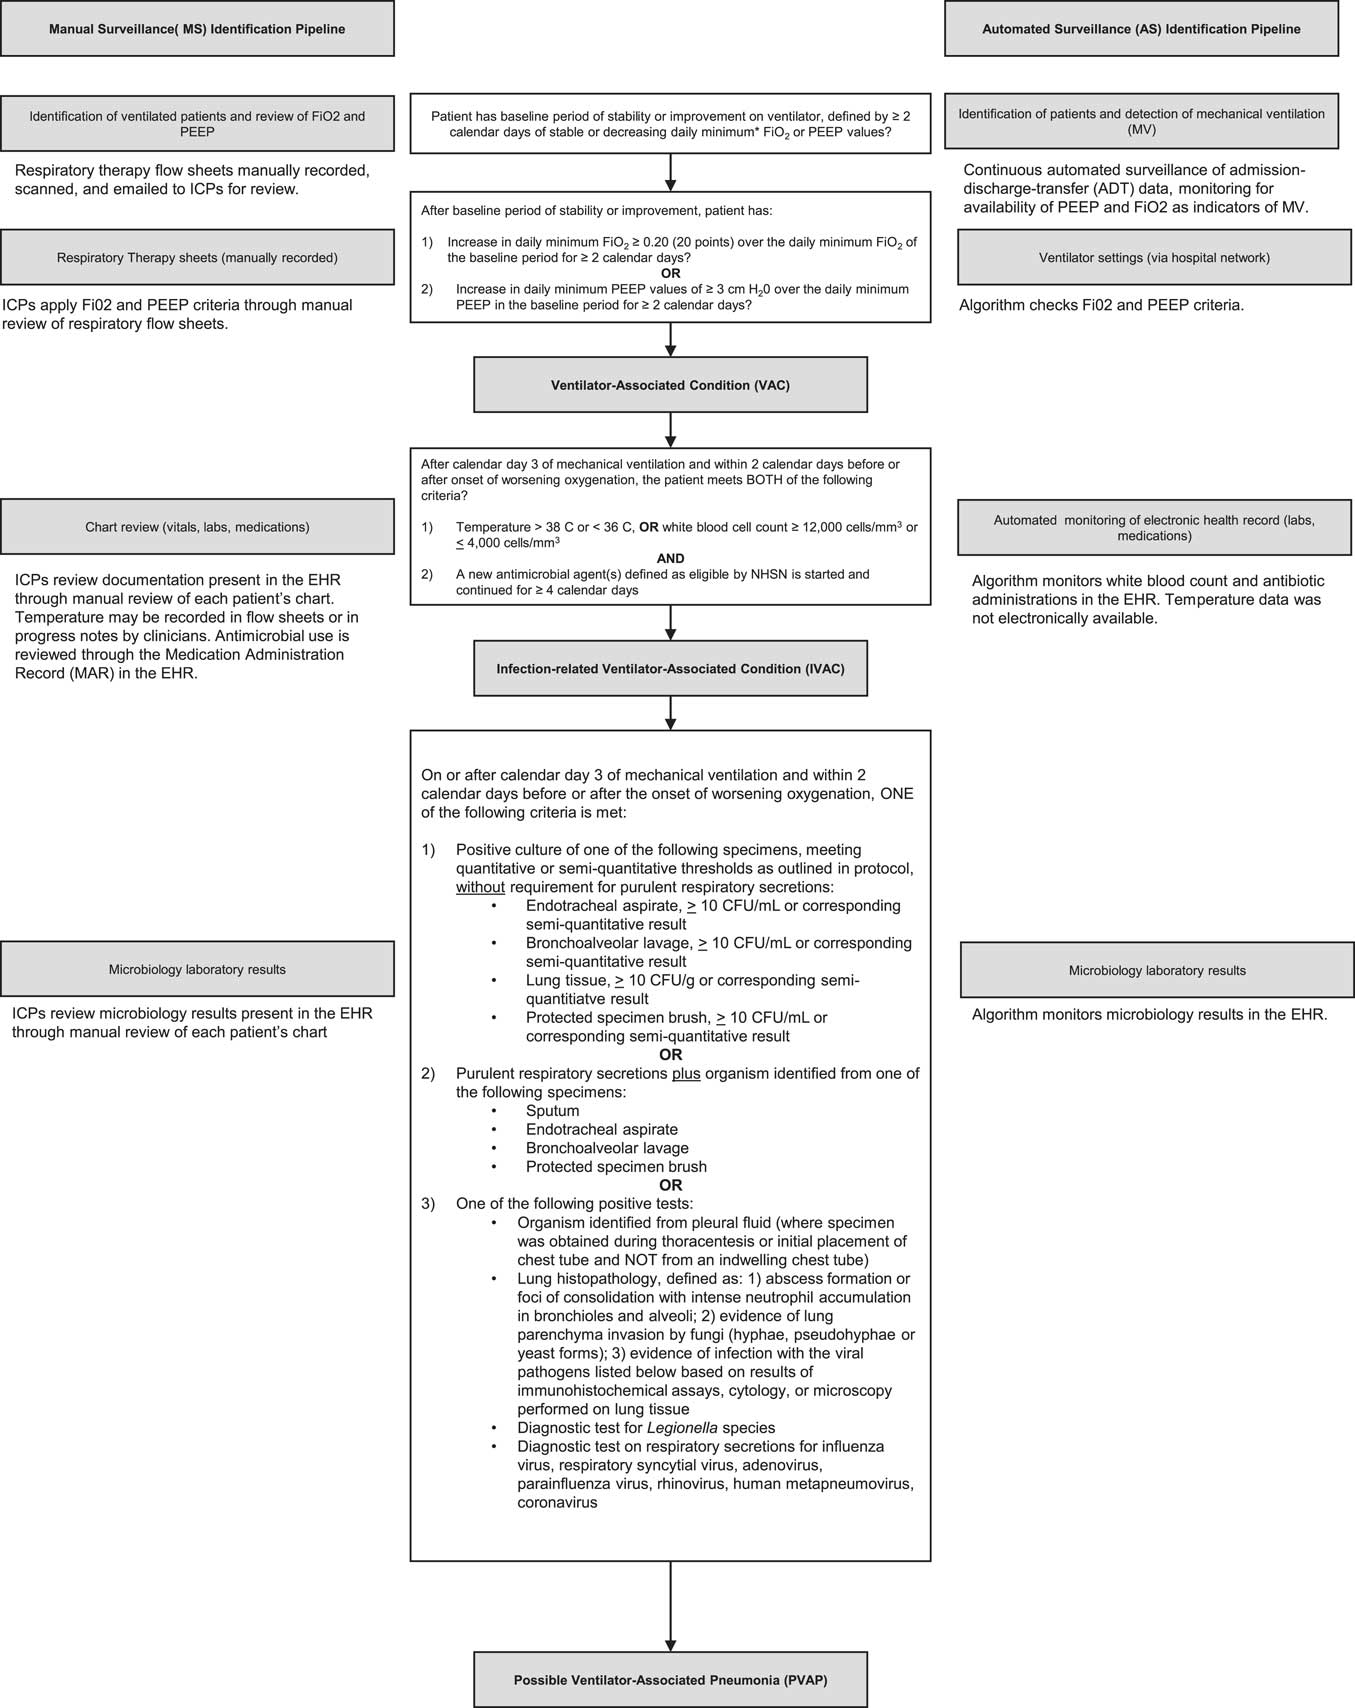
Both manual surveillance and automated surveillance applied the 2017 NHSN VAE definition. 8 The work flow for manual surveillance and automated surveillance with respect to the VAE definition is depicted in Figure 1, which provides the elements required to meet VAE criteria in the middle column.
Pipeline for manual surveillance (MS) versus automated surveillance (AS). Between the pipelines is the 2017 Centers for Disease Control and Prevention National Health Safety Network (CDC NHSN) definition for ventilator-associated events (VAEs).

Manual surveillance
Manual surveillance was conducted by certified infection control (IC) staff with a combined 30 years of experience, based in the MGH Infection Control Unit. Staff received a listing of all ventilated patients along with daily positive end-expiratory pressure (PEEP) and fraction of inspired oxygen (FiO2) data that had been entered into an Excel spreadsheet manually by respiratory therapy staff caring for ventilated patients. Respiratory therapy staff recorded the minimum values once every 12 hours, then they compared the values to those recorded during the prior shift. If the VAE criteria were met, the data were provided to the IC staff to review. Using these data, the IC staff applied the VAE definition to determine whether VAC criteria were met. If VAC criteria were met, the IC staff assessed IVAC criteria by reviewing the EHR for white blood cell count (WBC). If the case did not meet criteria based on WBC, the IC staff reviewed electronic progress notes to determine whether the IVAC temperature criterion was met. During the study period, temperature was not recorded in electronic flow sheets. The IC staff subsequently reviewed the electronic medication administration record (EMAR), which included all medications administered to patients (along with notations if the medications were held and if so, for what reason) to assess administration of antibiotics eligible for inclusion. If criteria for IVAC were met, the IC staff would proceed to review microbiological and pathology data in the EHR to determine whether the case met PVAP criteria. The EHR during the study period included a combination of locally developed and commercial products inclusive of all progress notes, laboratory, radiology, pathology, operative notes, admission, and discharge documentation, for both inpatient and outpatient visits. At the end of the process, the IC staff entered the event into the CDC’s online VAE calculator 9 to confirm ascertainment, and they documented the final classification as well as the event date. IC staff were aware of the study during both the development and validation periods.
Automated surveillance
The automated surveillance component of the study was accomplished using computer code developed in-house, written in Python version 3.5 software (http://www.python.org) and Matlab version R2016b software (Natick, MA), as well as a proprietary software provided by Excel Medical (Jupiter, FL). The first step in automated surveillance was tracking patient entry and exit times from ICU rooms. This step was accomplished by continuous monitoring of the hospital’s admission–discharge–transfer data log. The second step was to determine which patients were on ventilators, which was accomplished by continuous monitoring of ICU monitor data over the hospital network, using BedMaster software (Excel Medical, Jupiter, FL). For this study, our team had direct access to the streaming BedMaster data. Patients for whom ventilator settings were available were identified as being on mechanical ventilation. For patients on mechanical ventilation, the algorithm monitored second-to-second ventilator settings: PEEP and FiO2. For each ventilator day, the minimum daily PEEP and FiO2 values were computed as the lowest value of PEEP and FiO2 during a calendar day that was maintained for at least 1 hour after any given change in PEEP or FiO2 setting, respectively. These daily minimum values were used to determine whether conditions were satisfied for a VAC event, and if so, to calculate the VAE window within which conditions for IVAC or PVAP events were subsequently checked. Having detected a VAC event and VAE window, conditions were next checked for an IVAC event. For this determination, time-stamped chemistry results and antibiotic administration records were extracted from the EHR. The WBCs within the VAE window were compared with leukopenia and leukocytosis thresholds (Figure 1). Antibiotics given were compared with the NHSN list of eligible antibiotics, and the timing of antibiotic initiation and the number of qualifying antibiotic days were determined. In events qualifying as IVACs, the algorithm further checked whether PVAP conditions were met. The PVAP conditions were checked by extracting microbiology results, including sputum specimens, lung histopathology, and urine testing for Legionella. The algorithm further checked whether combinations of conditions were met regarding identity of microorganisms, specimen type, purulence, and amount of growth.
Determination of gold standard
All “positive” detections (detection of VAC, IVAC, or PVAP), either by the algorithm during automated surveillance or by the IC staff during manual surveillance, were manually reviewed by senior IC staff to determine the reference standard. Instances of discordance between the reference standard and either manual surveillance or automated surveillance were iteratively discussed and rechecked by a subset of the authors (E.S.S., E.S.R., M.B.W., E.E.R., N.S.), who were aware of the automated surveillance and manual surveillance interpretations, until consensus was reached. The reasons for each final determination were summarized and presented to senior IC staff. Adjudicated classification of each VAE event had to be signed off by senior IC staff before being considered final. Errors detected during the development cohort through the process of determination of the gold standard resulted in algorithm programming updates. The updated algorithm was then applied to the validation cohort.
Reported Outcomes
Clinical and demographic characteristics of the study population were extracted from the EHR, including age, gender, admitting diagnosis, duration of mechanical ventilation, and length of stay. Confusion matrices and 2×2 tables comparing manual surveillance and automated surveillance to adjudicated classifications were created. The sensitivity, specificity, and PPV of manual surveillance and automated surveillance compared to adjudicated classifications were calculated.
For detection errors generated by manual surveillance, study staff categorized the errors by type: missed events (failure to detect the VAC, IVAC, or PVAP); misclassified events (detected but misclassified VAE), which was further classified as underclassification (eg, classified an IVAC event as VAC) or overclassification (eg, classified an IVAC event as PVAP); and false detections (ie, manual surveillance detected a VAE that did not meet the NHSN definition).
The automated surveillance system produced a visualization of each VAE that provided ease of interpretation for how criteria were met.
RESULTS
Cohort Characteristics
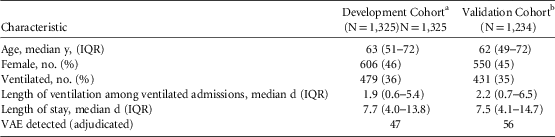
There were 1,325 and 1,234 admissions to the 4 ICUs during the development and validation periods, respectively. The cohort characteristics are summarized in Table 1. The cohorts were similar in age and gender. Among ventilated patients in the development cohort (N=1,325), the median duration of ventilation was 1.9 days. Among ventilated patients in the validation (N=1,234) cohort, the median duration of ventilation was 2.2 days. The length of ICU stay was 7.7 days in the development cohort and 7.5 days in the validation cohort (Table 1). During the development period, a total of 47 VAEs were identified in the development cohort, including 28 VACs (60%), 12 IVACs (26%), and 7 PVAPs (15%). During the validation period, a total of 56 VAEs were identified in the validation cohort, including 44 VACs (79%), 12 IVACs (21%), and no PVAPs.
Cohort Characteristics

Note. IQR, interquartile range; VAE, ventilator-associated events.
a January–March 2015.
b January–March 2016.
Performance of Manual and Automated Surveillance
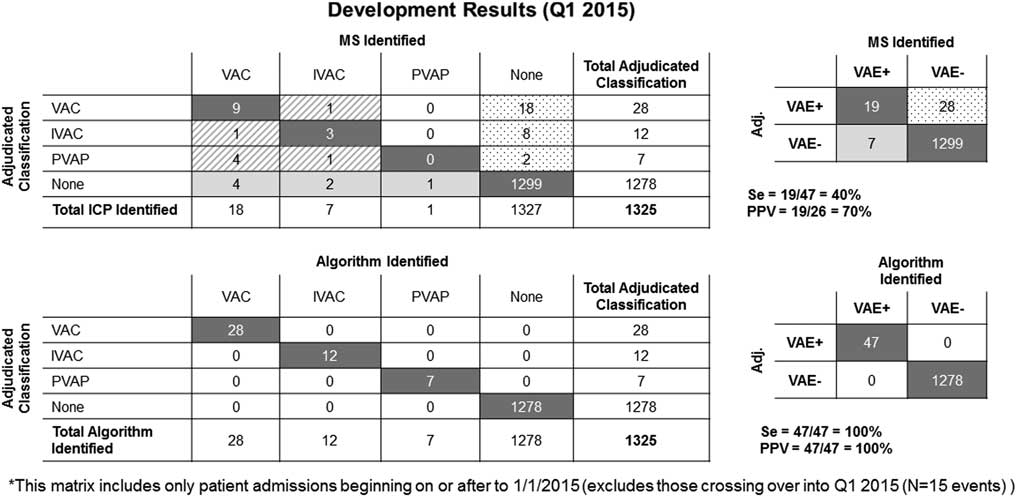
In the development cohort, for manual surveillance, sensitivity was 40%, specificity was 89%, and PPV was 70%. For automated surveillance sensitivity was 100%, specificity was 100%, and PPV was 100% (Figures 2A and 2B).
Development results (January–March 2015). Shown are both the adjudicated classifications by ventilator-associated event (VAE) type, as well as a summary 2×2 table with the calculated sensitivities, specificities, and positive predictive values for both manual surveillance (MS) and automated surveillance (AS).

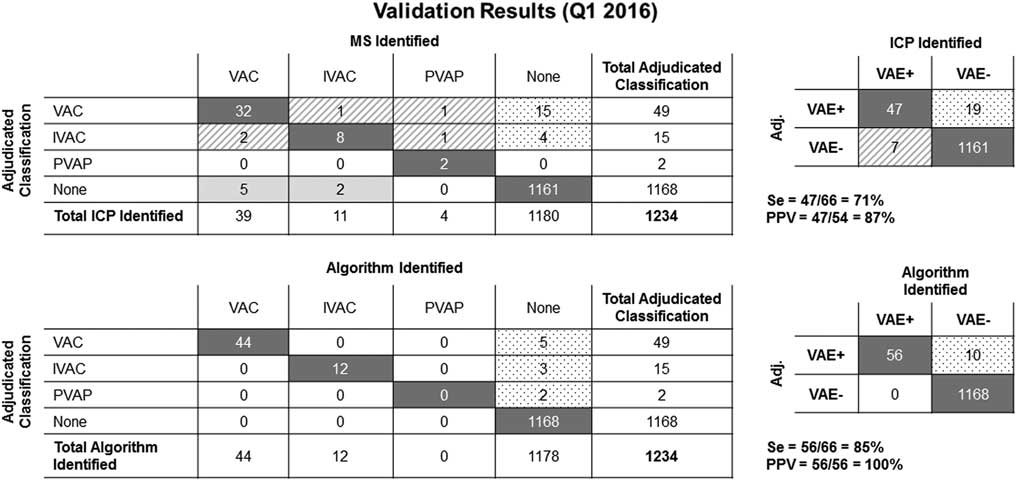
In the validation cohort, for manual surveillance, sensitivity was 71%, specificity was 98%, and PPV was 87%. For automated surveillance, sensitivity was 85%, specificity was 99%, and PPV was 100% (Figures 3A and 3B). During the validation period, a temporary interruption of data archiving occurred, resulting in loss of data. In all cases with data available, the algorithm made no errors.
Validation results (January–March 2016). Shown are both the adjudicated classifications by ventilator-associated event (VAE) type, as well as a summary 2×2 table with the calculated sensitivities, specificities, and positive predictive values for both manual surveillance (MS) and automated surveillance (AS).

Classification of Detection Errors
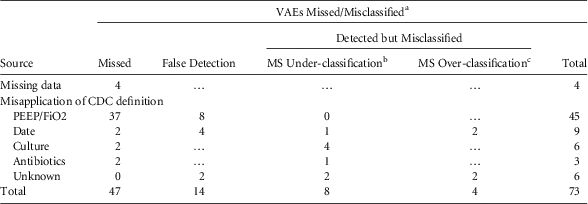
Manual surveillance yielded 73 detection errors in the combined development and validation cohorts. Of these, 47 (64%) were missed detections; 12 (16%) were misclassifications, and 14 (19%) were false detections. Among the missed detections, 37 of 47 (79%) were due to misapplication of the PEEP or FiO2 criterion. Among misclassifications, 8 of 12 (67%) were underclassified and 4 of 13 (33%) were overclassified. Among false detections, 8 of 14 (57%) were due to errors in applying the PEEP/FiO2 criterion (Table 2). “Misapplication” refers to the incorrect application of VAE definitions rather than errors arising from missing data.
Manual Surveillance Detection Errors With Root Cause Attribution (Combined Development and Validation Cohorts)

Note. MS, manual surveillance; CDC, Centers for Disease Control and Prevention; PEEP, positive end-expiratory pressure; FiO2, fraction of inspired oxygen; IC, infection control. VAC, ventilator-associated condition; IVAC, infection-related ventilator-associated complication; PVAP, possible VAP. Shown are the categories of missed and misclassified VAEs, as well as the source of error within each category. Misapplications of the CDC definition marked as “unknown” refer to errors of misclassification or detection for multiple criteria required to categorize a single VAE.
a An additional 10 VAEs were missed by the algorithm, all of which were due to missing data. These misses are not reflected in this table. There were no VAEs detected but misclassified or falsely detected by the algorithm.
b Manual surveillance underclassification refers to VAEs that were classified at a lower level by IC staff compared to the adjudicated classification (ie, manual surveillance classified a VAE as a VAC that should have been classified as an IVAC or PVAP).
c Manual surveillance overclassification refers to VAEs that were classified at a higher level by IC staff compared to the adjudicated classification (ie, manual surveillance classified a VAE as a PVAP that should have been classified as an IVAC or VAC).
Case Detection Visualization
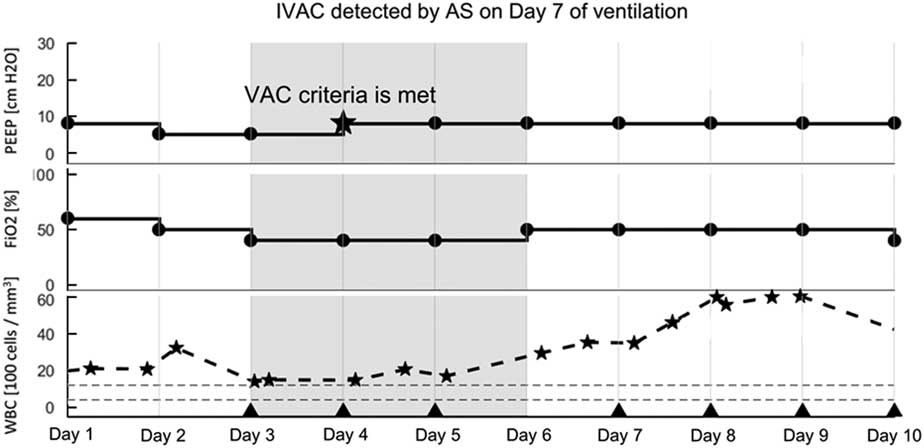
Each case reviewed by automated surveillance produced a detection visualization. These figures provided a visual depiction of the criteria used by the algorithm to detect and classify cases. An example of automated surveillance detection of an IVAC case is provided in Figure 4.
Visualization of ventilator-associated event (VAE) detection and classification by automated surveillance. The grey band highlights the start and end of the VAE window as specified by the NHSN VAC criterion. The example shown is an IVAC: There is an increase in PEEP after 2 days of stability (from 5 to 8; marked by a star), WBC counts are abnormally elevated (indicated by stars), and a new qualifying antimicrobial agent is started within an appropriate period and continued for ≥4 calendar days. Days of administration are indicated by triangle markers.

DISCUSSION
We found that completely automated surveillance, relying on physiologic data streamed live from bedside monitors, combined with clinical data available in the EHR, was superior to manual surveillance conducted by experienced IC practitioners. With the exception of a technical data lapse during the validation period when physiologic data were not available, automated surveillance performed with perfect sensitivity and specificity. Manual detection was subject to human error, including missed cases, misclassifications of detected cases, and false detections. The use of data visualization techniques to summarize results of the automated process made interpreting and verifying findings during automated surveillance straightforward, which increased the efficiency of the surveillance process.
Our findings are consistent with those of others who have reported on efforts to transition from manual to partially automated VAE surveillance, with some important differences. Stevens et alReference Stevens, Silva and Gillis 6 conducted a retrospective review of all admissions to any of 9 ICUs at a single hospital over a 6-year period. The algorithm extracted all data elements from the EHR, but the data used to identify mechanically ventilated patients as well as ventilator settings were based on manual entry to the EHR by respiratory therapists, a process that introduces the possibility of data entry error. Notably, “misapplication” refers to incorrect application of VAE definitions, rather than errors arising from missing data. The algorithm was sensitive (93.5%) and highly specific (100%) compared to manual surveillance. Mann et alReference Mann, Ellsworth and Huda 4 developed an automated VAC detection algorithm that also outperformed manual surveillance. While their algorithm was applied to data extracted from the EHR, similar to Stevens et al, mechanical ventilation data, though extracted from the EHR, were manually entered into the EHR. The algorithm was developed to be run weekly on an EHR extraction; thus, results were not available in real time. Klein Klouwenberg et alReference Klein Klouwenberg, van Mourik and Ong 5 compared prospective manual surveillance for VAP to detections using a fully automated VAE algorithm. While the algorithm did use data extracted from mechanical ventilators, these researchers did not report on its performance compared to manual surveillance for VAE; rather, the algorithm was compared to manual surveillance for VAP. Nuckchady et alReference Nuckchady, Heckman and Diehl 7 describe a partially automated surveillance algorithm that relied on extraction of mechanical ventilation data, temperature, and WBC—all entered manually into the EHR on a daily basis. In this study, antimicrobial administration was not available for electronic review; thus, the algorithm could only report VAC and possible IVAC but not PVAP.
Our study has several limitations. It was a single-center study, and although 4 different adult ICUs were included, the results might not be generalizable to other facilities. During the study period, which occurred just prior to transition to a new EHR, temperature was not recorded in an extractable electronic format. To account for this limitation, the algorithm was programmed to not reject VAEs that did not meet the WBC criterion; these cases were allowed to flow through the algorithm during which the remainder of the VAE definition was applied, so that patients who did not meet the WBC criterion could be considered at the next stage of the VAE definition. Despite this limitation, no instances were observed in which the temperature criterion was required to detect a VAC. In all instances, the criterion was met using the WBC criterion. In fact, during this time, the work flow of IC staff performing manual surveillance was to first check the WBC because these data were readily available in the EHR. Only in instances in which the case did not meet the WBC criterion did the IC staff perform a manual review of clinical notes to identify temperature >38°C. With the caveat of a limited sample size, this observation suggests that WBC alone might be sufficiently sensitive and specific. Since the completion of the study, our institution has transitioned to a new EHR in which vital signs, including temperature, are documented electronically; thus, temperature data have been added to the algorithm.
Interestingly, we observed an increase in the sensitivity of manual surveillance between the development and validation cohorts. It is possible that this difference is due to accumulated experience by IC staff in conducting VAE surveillance, which was split temporally into the development and validation data sets, as well as the involvement of the IC staff in the adjudication discussions during the development period. This process likely improved IC staff knowledge with respect to VAE application as they accumulated experience and received feedback on the types of errors generated.
Our study relied on specialized software for the continuous monitoring of ventilator data (BedMaster; Excel Medical, Jupiter, FL). Similar software systems are not part of the standard of care at present, which limits the number of hospitals that will be able to duplicate the implementation of an automated surveillance system like ours. On the other hand, the high-temporal resolution ventilator data that our system provides is not strictly necessary for the VAE detection, which summarizes all ventilator data by the daily minimum (ie, the lowest PEEP and FiO2 values that were maintained for at least 1 hour). Thus, it should be possible to achieve similar automated surveillance results using ventilator data from an EHR, collected as hourly “snapshots.” This work is currently in process at our institution to deploy automated surveillance at other hospitals in our hospital network. Finally, the failure of automated surveillance during a brief period of data loss highlights the reliance of the algorithm on data streams and the importance of data archiving.
With the revision of VAP surveillance in 2013 to the VAE definition to include only objective elements available in EHRs, completely automated surveillance for these events became possible. The extent to which facilities have the resources to implement automated surveillance, however, remains to be determined.Reference Halpin, Shortell, Milstein and Vanneman 10 – Reference Furuno, Schweizer, McGregor and Perencevich 15 Automated surveillance presents many advantages.Reference Sips, Bonten and van Mourik 16 , Reference Klompas and Yokoe 17 These advantages include consistent application of the NHSN criteria, which can be updated through recoding as definitions change over time, without the possibility of human errors, and reduced time and effort required for manual surveillance. Electronic approaches to surveillance require maintenance: In addition to definition changes, any alterations in coding of components of the definition in the local EHR must be known in advance and updated to maintain a robust surveillance tool.
In the case of the algorithm described here, a further advantage afforded by utilization of live-streaming clinical data is that surveillance can be conducted in real time to enhance both timing of reporting as well as, and perhaps more importantly, to use these data to identify opportunities to target quality improvement interventions, and to assess the impact of these interventions. Traditional manual surveillance, and even automated surveillance that relies on retrospective data from the EHR, results in reporting well after patients leave the ICU, limiting the impact of feedback to clinicians who are no longer caring for the affected patients. The automated surveillance can be programmed to generate alerts to frontline providers and can be expanded to include opportunities for improving clinical care. For example, the automated surveillance algorithm can be configured to generate electronic alerts to providers based on changes in PEEP and FiO2 that precede the establishment of a VAE, prompting clinicians to re-evaluate the patient’s ventilator settings and clinical status. Another possible intervention could include automated alerts at the time antimicrobials are initiated to provide evidence-based recommendations for whether antimicrobials are indicated as the VAE surveillance definition captures noninfectious events, as well as guidance on the choice of empiric antimicrobials. At this time, implementation of the algorithm to perform hospital-wide VAE surveillance, which will require validation on new EHR data streams, has been prioritized, and it will include an assessment of the impact of automated surveillance on IC workflow. Prior studies have demonstrated substantial improvements in the infection-preventionist time-effort using even partially automated surveillance tools.Reference Resetar, McMullen, Russo, Doherty, Gase and Woeltje 18 Initial discussions have begun regarding potential quality improvement interventions using the algorithm.
In summary, we have developed a fully automated VAE surveillance system with opportunities for increased accuracy of surveillance, the potential to improve patient care processes and outcomes, and the assessment of interventions aimed at enhancing care and reducing complications of mechanical ventilation.
ACKNOWLEDGMENTS
The authors acknowledge Irene Goldenshtein, Lauren West, and Susan Keady of the MGH Infection Control Unit, and Keith Jennings, Karina Bradford, and Christopher Fusco of the Partners Healthcare Information Systems for their valuable assistance in creating and reviewing the VAE data for this project.
Financial support: This work was supported by the National Institute of Allergy and Infectious Diseases of the National Institutes of Health (grant no. K01 AI110524 to E.S.S.); the National Institute of Neurological Disorders and Stroke of the National Institutes of Health (grant no. 1K23 NS090900 to M.B.W.); the Andrew David Heitman Neuroendovascular Research Fund, (to M.B.W.); The Rappaport Foundation (to M.B.W.); the MGH Infection Control Unit Funds (to E.S.S., E.E.R., D.S., N.S., and D.C.H.); and the MGH Neurology Departmental Funds provided to the MGH Clinical Data Animation Center (to E.S.R., Y.P.S., S.B., M.G., M.J.V., M.B.W.).
Potential conflicts of interest: All authors report no conflicts of interest relevant to this article.