From old social risks to new social spending: a concern for redistribution?
Recent literature on welfare state change has identified – at least in discourse if not yet in practice – a shift from social-welfare state to social investment state and from passive protection to activation. Parallel to this discourse, there is evidence that common challenges across European Union member states have pinpointed the need to focus on new social risks as opposed to old ones. Social risks are defined as circumstances that result in greater financial burden (Pintelon et al., Reference Pintelon, Cantillon, van den Bosch and Whelan2011: 20); in addition to old social risks, such as old age or unemployment, these risks nowadays include, for example, care responsibilities or the lack of education. Post-industrial transition and other recent trends have changed the nature of social risks, putting more emphasis on human capital, adaptability and flexibility (Bovenberg, Reference Bovenberg2007). This kind of social investment is considered to be beneficial for society in the long term.
While the two concepts, social investment and new social risks, are often used almost interchangeably, and their policy implications are partly overlapping, the underlying rationale of new social-risk policies is more related to the immediate changes in post-industrial societies than an ideological discourse of social investment. The emergence of new risk groups, such as the young, the low-skilled and women,Footnote 1 has obliged welfare states to ruminate again about traditional social policies aimed at protecting male breadwinners from such risks as unemployment or illness (Bonoli, Reference Bonoli, Armingeon and Bonoli2006). Family instability and difficult reconciliation of work and family life have become major policy issues as they increase the incidence of poverty for families with children, especially for lone-parents. Other contingencies typical to modern society have sometimes rendered employment income insufficient to uphold adequate living standards. While there are no significant signs that spending on new social risks is crowding out spending on traditional risks, these changes and demographicFootnote 2 pressures have benefited areas such as education, childcare and elderly care that are able to support greater participation in the labour market. Van Kersbergen and Hemerijk (Reference Van Kersbergen and Hemerijk2012) emphasise that we need to raise the question of whether the adoption of the social investment paradigm/new social-risk policies has led to a relative neglect of redistributive policies – the topic addressed in this article.
The first contribution of this article is to examine how public spending on old and new categories of welfare has changed during the last two decades in Europe. Secondly, the extent to which such possible shifts have actually disturbed or altered the redistributive character of the welfare state is examined through an analysis of the distribution of cash and in-kind benefits in Denmark, France, the Netherlands, Slovenia, Spain and the United Kingdom. These countries were chosen to represent different welfare state regimes in Europe and in order to examine whether the differences that occur are connected to the type of welfare state in question. In other words, what is investigated is how increased public spending on new social policies is distributed among income quintiles in comparison to spending on old social policies and what implications such spending has for a household's final budget.
I use the notion ‘old’ spending when referring to traditional protective spending against old social risks (unemployment, sickness, disability, breadwinner's death, retirement and having children). This kind of spending includes cash benefits that compensate for decreased earnings (as in the case of retirement or unemployment) or increased financial burden (as in the case of having children). On the contrary, ‘new’ social spending aims at offering labour-market opportunities for care-givers and care for dependant elderly people, or aims at investing in the future. This is achieved through public services, especially childcare, education and elderly care. Public healthcare is also taken into account in the analyses. While spending on healthcare can be considered a desirable social investment, and at least some parts of it, such as prevention or occupational healthcare, certainly improve people's labour-market attachment, it is here taken as part of the ‘old risks’ group. It can be argued that on a conceptual level, it is not different from sickness benefits. Active labour-market policies are an integral part of the social investment ideology. While the spending on various activation programmes has increased all around the EU in recent years, it still represents only a marginal share of social budgets. Furthermore, it cannot be regarded as a benefit such as free or subsidised childcare because in many cases it actually manifests as an obligation or even a sanction. It does not have a market equivalent as the other in-kind benefits taken into consideration here. Therefore, active labour-market policies are not included in the scope of the analysis in this article. Another category omitted from the analyses is higher education, which would necessitate an article of its own due to the complexity of the empirical exercise. However, we know from earlier studies that it is mostly pro-rich or pro-middle class (Vaalavuo, Reference Vaalavuo2011).
Redistribution of economic resources lies at the very heart of the development and expansion of the modern welfare state. However, the paramount role of redistributive social policies has been called into question by the discourse of social investment especially prevalent in the Third Way ideology in the United Kingdom and the European Union. Faced with economic pressure and criticism against an extensive welfare state, sceptics of neo-liberalism have asserted the ‘productive’ side of social spending (Jenson and Saint-Martin, Reference Jenson and Saint-Martin2003: 82; Vandenbroucke et al., Reference Vandenbroucke, Hemerijk and Palier2011). However, research has not reached a consensus on the shifts in actual policy implementation: Van Kersbergen and Hemerijk (Reference Van Kersbergen and Hemerijk2012) and Morel et al. (Reference Morel, Palier and Palme2009) assert that European welfare states have been following a social investment logic in their recent reform agendas. In contrast, Hudson and Kühner (Reference Hudson and Kühner2009) find only weak evidence of a shift from protective to productive social policy when studying education and labour-market training.
The social investment state is supposed to move beyond left and right ideologies by integrating economic and social objectives (Perkins et al., Reference Perkins, Nelms and Smyth2004). At the EU-level, discussions of social problems in economic terms have been a standard procedure since the Treaty of Rome. Yet, it has become more explicit with the Treaty of Amsterdam (1999) and the Lisbon Strategy (2000) that aimed at full employment, social cohesion and improved competitiveness (Perkins et al., Reference Perkins, Nelms and Smyth2004: 9). Taylor-Gooby notes (Reference Taylor-Gooby2003: 550): ‘In all areas of EU policy-making, attempts to tackle welfare-related issues directly have tended to be ineffective, while policies that advance social ends as an adjunct to more directly economic and labour-market policies have enjoyed greater success.’ Former British Prime Minister Gordon Brown has employed such rhetoric by envisioning an enabling and empowering role for the government through expanded educational, employment and economic opportunities (Brown, 2002, cited in Lister, Reference Lister2003: 429).
Rather than reduce income inequality, new social-risk policies aspire to an active society with economic participation and social inclusion through the redistribution of opportunities and investment in human capital. Social policies that used to help people in distress are now considered inadequate; instead, the causes of poverty and other social problems should be solved by changing the economic and social conditions in which we live and work. According to Jenson and Saint-Martin (Reference Jenson and Saint-Martin2003: 86), social protection is no longer a sufficient source of security since economic invulnerability will increasingly demand the capacity to adapt to changes (see also Giddens et al., Reference Giddens, Diamond and Liddle2006). Such capacity needs to be built during a healthy childhood and through life-long learning, both major targets of social investment policies. Likewise, Martin and Pearson (Reference Martin and Pearson2005) express the necessity not only to support those in need but also to invest in minimising future social breakdown. The look towards the future – often implying a focus on children – is the central aspect of social investment policies. In contrast to these rather optimistic assessments of the new social policies, Bea Cantillon has called into question the poverty reduction aspect of the social investment state. According to her analysis, social redistribution has become less pro-poor with the investment paradigm. Her concern that ‘“new policies budgets” . . . tend to flow to the higher income groups’ needs to be studied carefully, as done in this article. She bases her concern on two assumptions that will be partly contested here: first, new policies are work related and, second, services are considered to be less redistributive than cash transfers (Cantillon, Reference Cantillon2011).
The next section addresses the idea of redistribution in general and, within it, the role of public services in particular. It sketches hypotheses based on existing literature. The third section discusses methodological issues and challenges related to the imputation method. The results based on the quantitative analyses are presented in the fourth section with statistical evidence on the relative importance of old and new public spending. The article ends with some concluding remarks on the political relevance of the research.
Previous literature and hypotheses: inequality, redistribution and public services
Although the social investment state aims at redistributing opportunities rather than income, it does not preclude the impact on income inequality. As part of the new social policy agenda, responding to new social risks and focusing on social investment, public spending on non-compulsory education, childcare and elderly care has increased in many countries. The focus of this article is the redistributive character of these services in comparison to traditional social protection: how is this new spending distributed across income classes? Accordingly, the monetary value of these services is added to households’ disposable income in order to examine their budgetary implications at the household level. As a rule, countries diverge greatly regarding the amount of these publicly provided goods; likewise, regarding the balance between in-cash and in-kind transfers. Nordic countries have traditionally spent more on services than any other welfare state models, earning the moniker ‘service states’, while some conservative welfare states and the United Kingdom have been latecomers in providing public childcare and/or elderly care. The Nordic countries have responded to such risks with a comprehensive social service system earlier than most other countries. They have relied on dual-breadwinner families and transferring care responsibilities from the private to the public sphere before ‘new social risks’ were even recognised in academic jargon (see also Hudson and Kühner, Reference Hudson and Kühner2009).
The prevalent view of the post-war period was that the state had a paramount role in ensuring, for its citizens, as a matter of right, a certain minimum standard of living, economic welfare and security. This discourse was supported by expectations that social disadvantages would be erased by the measures (Kennett, Reference Kennett2001: 8). Many scholars have agreed that the welfare state is a means for the state to fulfil its obligations to its citizens, and access to welfare services is part of the practical status of citizenship (Salter, Reference Salter1998: 12). Necessarily, programmes of social policy pursue many goals simultaneously and the redistributive function of public services has usually been assigned a secondary role. Although these programmes have not been designed to equalise income distribution, they may benefit some income classes more than others, and therefore serve as a redistributive instrument. In this article, the concern with the emphasis on education, childcare and elderly care is thus its egalitarian implications. With the focus on new social risks, are welfare states renouncing their commitment to equality and redistribution towards the poor as the benefits are going to more targeted groups?
Lately, studies on income distribution have shown growing interest in the impact of public services on income inequality (Smeeding et al., Reference Smeeding, Saunders, Coder, Jenkins, Frtzell, Hagenaars, Hauser and Wolfson1993; Marical et al., Reference Marical, Mira D'ercole, Vaalavuo and Verbist2006; Vaalavuo, Reference Vaalavuo2011). The focus on a household's disposable income seems increasingly inadequate as people's living standards are not only affected by cash transfers from the welfare state but also in-kind benefits. Le Grand was greatly sceptical about the egalitarian potential of public services and revealed their failure to reduce any inequality. On the contrary, he claimed that public services are largely pro-rich. In his book The Strategy of Equality (1982), he demonstrates that the expenditure on healthcare, education, transport and housing in Britain has gone, for the most part, to the better-off rather than to the poor. Thus, according to his analysis, no equality is achieved through public spending on these services. His conclusion about the failure of the welfare state has, however, been contested. Many studies have empirically found public services to be more equal than Le Grand leads us to believe. For example, the UK Office of National Statistics publishes an annual overview of income distribution that takes into account public expenditure on education, housing, healthcare and transport (Jones, Reference Jones2008). Only subsidies to bus and train companies proved to be pro-rich as they were imputed on the basis of the ‘need to travel to work’, and hence benefited economically active persons. Otherwise, bottom income quintiles receive the greatest benefits from public services. Likewise, the Australian Bureau of Statistics (2007) includes in-kind benefits from education, healthcare and housing in its studies on income distribution. As with the UK, social transfers in kind decreased as levels of household income rose, therefore reducing the level of income inequality in Australia. These studies indicate that public services can smooth out the gaps in income distribution. However, childcare or elderly care services have not been included in previous analyses and no comparison has been made between the benefits received from old and new social spending in household's budget.
The connection between public services and redistribution can be very complex, and, given the presence of externalities, it is difficult to determine who is really benefiting. Obviously, these externalities form the basic rationale behind the social investment state, but the existence of such indirect effects complicates an exact assessment of the impacts of public services on income distribution, as they make problematic the identification of benefiting households in the long run. In this article, the focus is on the social distribution of old and new social benefits at one point in time only, assuming away the possible externalities. Another important assumption underlying this study is about needs. Health, care or educational needs are not integrated into the empirical analysis of this study. It could be argued that healthcare services only compensate for ill-health and there cannot be any monetary benefit in the existence of healthcare. However, here the fundamental idea is to treat public healthcare, or other services, as an insurance – services for which the person does not have to pay (‘money saved’).
The welfare state's distributional impacts are manifold, including horizontal redistribution based on need, redistribution between different groups, and redistribution across the life cycle. As public services are likely to benefit certain income classes more than others, they can serve as an instrument of vertical redistribution, that is between different income groups. This kind of redistribution will be the focus of this study. Obviously, a life-cycle aspect of redistribution is natural when we analyse services targeted at children and the elderly, but this will not be examined further here as the focus is on a snapshot picture of inequalities.
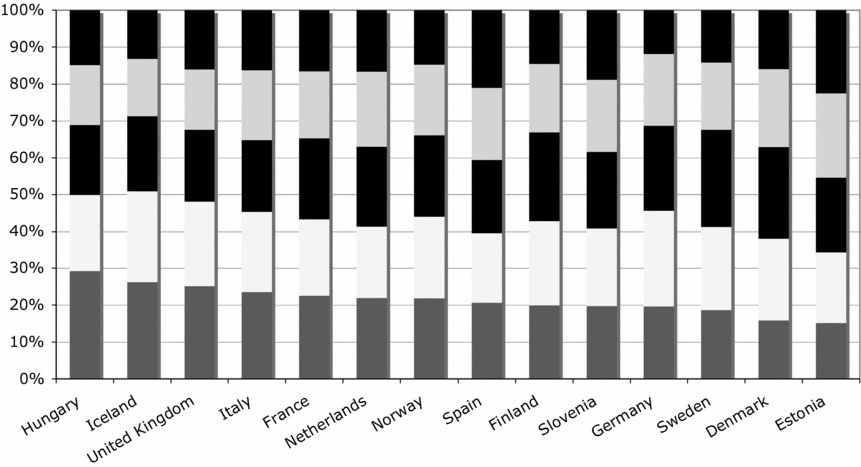
Much of the redistributive consequences of public services depend on the socio-demographic structure of the society and the distribution of disposable income. The main consequence of the shift from old to new social spending is the changing of the target group from the elderly to children with the exception of elderly care (see also Bradshaw and Holmes, Reference Bradshaw and Holmes2013, on the issue of generational equity in redistribution). The extent to which new social spending reduces or increases income inequality follows therefore from the economic status of different household types in the given society. For example, children between zero and six years are more heavily concentrated in the two bottom income quintiles in Iceland and Hungary (52 and 47 per cent respectively of all young children) than in Estonia and Denmark (32 and 38 per cent respectively) (Figure 1).
Distribution of children from 0 to 6 years by income quintiles
Note: Income quintiles based on equivalised disposable income.
Source: Author's calculation based on EU-SILC 2007.

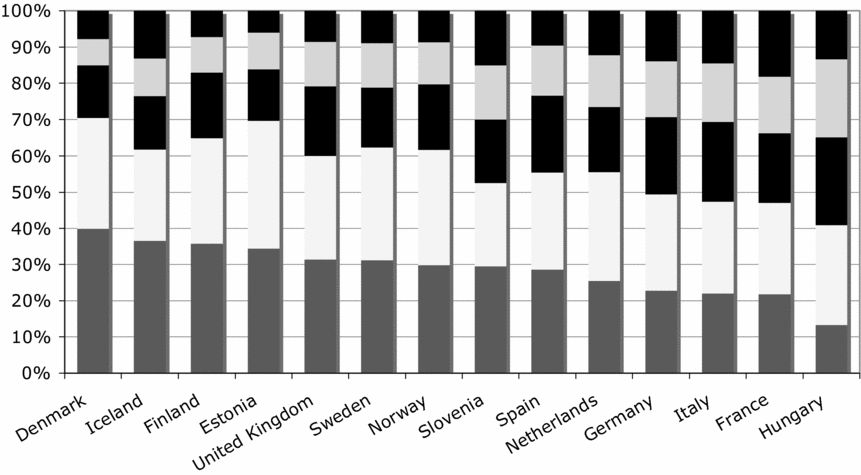
Families with children will be the net gainers of increased spending on education and childcare. Single-parent families especially (often with low disposable income) see their final income increase (relative impact). However, more affluent families (usually with both parents working) are more likely to use childcare services intensely. This is likely to result in pro-rich redistribution especially in countries that provide only few public childcare facilities (the so-called Matthew effect). This is what Cantillon (Reference Cantillon2011) refers to when she claims that the new social policies are more work related and thus less pro-poor. In general, studies on the redistributive effects of compulsory education have shown that it reduces inequality quite efficiently (Tsakloglou and Antoninis, Reference Tsakloglou and Antoninis1999; Sefton, Reference Sefton2002; Lakin, Reference Lakin2004; Marical et al., Reference Marical, Mira D'ercole, Vaalavuo and Verbist2006). Higher education is not studied in this paper but its impact would most likely be opposite because of the overrepresentation of higher income classes in tertiary education due to the inequality of access even in the most equal countries. Instead, elderly care services benefit oldest citizens the most. In most countries, the elderly households are overrepresented in the lower income deciles: the population over seventy-five years old is even more concentrated in the bottom income quintiles (e.g., in Denmark, 71 per cent of the seventy-five plus population belongs to the first and second quintiles), resulting in redistribution towards the lowest income classes via elderly care benefits. Here, a life-cycle approach could reveal that the elderly people living the longest are often the highly educated and the wealthier, who eventually benefit more from services at later stages of life. In conservative welfare states with generous pension systems, the elderly usually enjoy a higher economic status when disposable incomes are compared (Figure 2). A large part of the social spending, pensions, elderly care and healthcare, benefits the elderly and thus their relative position in society determines to a large extent the efficiency of the overall distributional system (or, to be more correct, their economic position is shaped by the pension system as they usually have a very modest market income). While not taken into account here, the indirect impacts of these services may be considerable, especially for women who have traditionally taken care of children and frail parents or spouses at home.
Distribution of population over 65 years by income quintiles
Source: Author's calculation based on EU-SILC 2007.
Data and methodological design
Imputation method
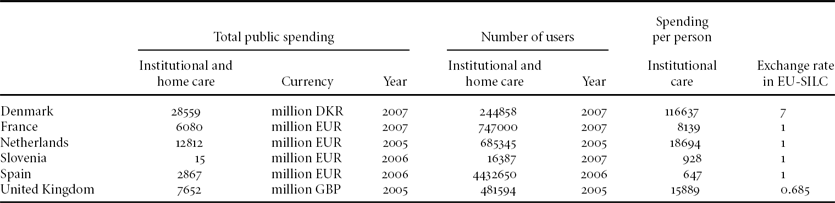
The analyses are based on micro-level data from EU-SILC (European Union Statistics on Income and Living Conditions) for 2007 (income reference year 2006). It contains data on household income as well as socio-demographic information at both the household and individual levels. OECD statistics provide information about the cost of production for healthcare and education. Information for childcare and elderly care was acquired mostly through national statistical offices (see Appendix). This might influence the comparability between countries but allows access to more detailed (and sometimes the only existing) data. However, we should be cautious with the monetary value received from cost of production: for example, economists often argue that in-kind transfers are less valuable to their recipients than an equivalent amount in cash that entails the liberty to consume the money as wished (Smeeding et al., Reference Smeeding, Saunders, Coder, Jenkins, Frtzell, Hagenaars, Hauser and Wolfson1993: 249; Canberra Group, 2001: 15). While acknowledging that the monetary value of in-kind transfer is not equal to in-cash transfer, this standard method offers an opportunity to compare services more systematically between countries, as well as old and new social spending.
Each service included – education, childcare, elderly care and healthcare – needs separate consideration on how to be imputed to a household's budget in the most coherent and reliable way. Imputation is not always based on the real use of public services but on the personal characteristics of individuals such as age and gender that, for the most part, determine the use of services; thus, it remains an estimation of potential use of a service. Previous studies on income distribution that have taken into account some public services (usually healthcare and education) have opened up ways to overcome these contingencies and serve as a manual for this study (see Vaalavuo, Reference Vaalavuo2011 for a more extensive literature review).
Primary and secondary education
Imputation of in-kind benefits from primary and secondary education is based on age, since there is almost 100 per cent enrolment for age groups below eighteen years in each country (OECD Education Database provides information on the exact enrolment rates for each age group; see OECD, 2008). Higher education is not taken into account in this paper even though it is an important part of the social investment ethos. As the categories of pre-primary education and childcare sometimes overlap in OECD and national data, pre-primary education is studied together with childcare; in addition, the focus of new social policies on young children will make this grouping theoretically more logical.
Pre-primary education and childcare
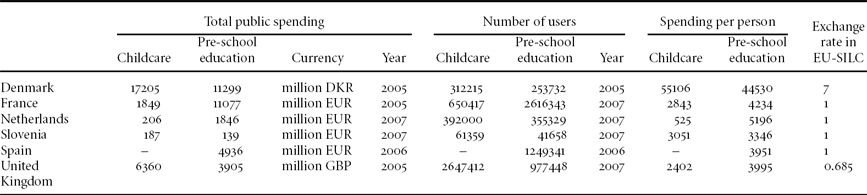
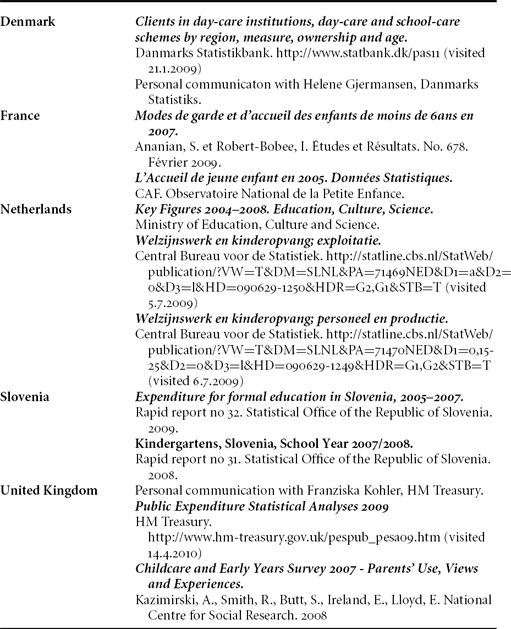
Comparable data on childcare services are still not widely available (Eurostat, 2004). Many different categories exist in this sector making it difficult to acquire coherent data on both public spending and the number of users. This led to the disregarding of some subcategories. However, that proved to be the case only in minor expenditure categories (such as playground and after-school activities for children) and is unlikely to change the overall results.Footnote 3 The EU-SILC contains data on the number of hours per week a child attends formal daycare and pre-primary education. Thus, the imputation of transfers is based on real use on an hourly basis and takes into account the important distinction between part-time and full-time use that may vary according to socio-economic class (see also Ghysels and Van Lancker, Reference Ghysels and Van Lancker2010).Footnote 4 In many countries, families benefit from different types of state support; family and child allowances (here considered as old social spending) are common everywhere, while some countries prefer tax credits or fiscal benefits directed to families and parents paying for private childcare (especially in the UK and France). Such governmental support is taken into account in this study automatically as it is included in the concept of disposable income. However, no separate analysis is conducted for the measurement of the volume and relative impact of the tax system.
Healthcare
The data used for healthcare is derived from the OECD health data that estimates the distribution of expenditures across age groups. It takes into account the considerable differences between age groups in the use of healthcare services. As a consequence, in the imputation of the monetary value of healthcare, each person in the EU-SILC data is assigned a transfer according to his or her age. More detailed information, for example, considering unequal use by people from different social and income classes, was not available for the study.Footnote 5
Earlier studies allocating healthcare spending to households are also based on a similar ‘insurance approach’, in which benefits are distributed to individuals based on their age only (Smeeding et al., Reference Smeeding, Saunders, Coder, Jenkins, Frtzell, Hagenaars, Hauser and Wolfson1993; Steckmest, Reference Steckmest1996; Lakin, Reference Lakin2004; Garfinkel et al., Reference Garfinkel, Rainwater and Smeeding2005; Aaberge and Langørgen, Reference Aaberge and Langørgen2006; Aaberge et al., Reference Aaberge, Bhuller, Langørgen and Mogstad2010). The insurance value can be considered as the price of private insurance; in other words, governments provide an equivalent to funding an insurance policy in which the premium is the same for everybody within the same age category (Marical et al., Reference Marical, Mira D'ercole, Vaalavuo and Verbist2006; Smeeding et al., Reference Smeeding, Saunders, Coder, Jenkins, Frtzell, Hagenaars, Hauser and Wolfson2008).Footnote 6 The insurance principle considers healthcare services as a public good that benefits all: the possibility of its use being more important than its actual use (Ringen, Reference Ringen1987: 255). Studies based on the real consumption of healthcare services show that the lowest quintiles may benefit more because the poor report illness more often and, accordingly, also use these services more (Goddard and Smith, Reference Goddard and Smith2001).Footnote 7 Despite the differing standpoints, results based on the real use of healthcare services in the United Kingdom (Evandrou et al., Reference Evandrou, Falkingham, Hills and Le Grand1993; Sefton, Reference Sefton2002) compared to similar studies based on the insurance principle (Lakin, Reference Lakin2004) demonstrate that the differences between the approaches are insignificant.
Elderly care
The aim of social care services is to improve the living standards of people who need help and to offer relief to relatives from the burden of continuous care (Sipilä, Reference Sipilä1997: 36). Accordingly, it may be hard to judge if elderly care is benefiting the older person actually using the service, or his/her children (living in a separate household) who are no longer responsible for taking care of their father/mother. In this study, the beneficiary is taken to be the elderly person receiving the care.
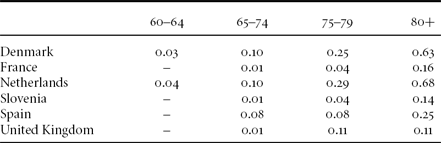
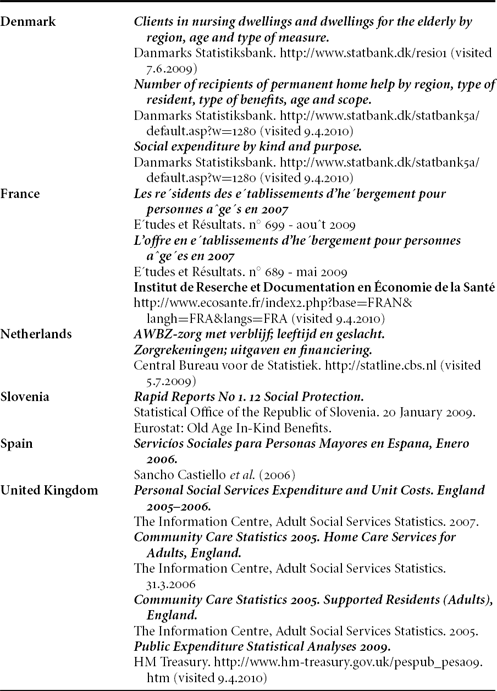
In comparison to childcare, no similar data on the use of elderly care services exist in the EU-SILC dataset. Therefore, imputation is based on the potential use of elderly care services. The probability is derived from national user profiles, that is from the real percentage of use by different age groups. Thus, each person above sixty-five years (sixty years in the Netherlands and Denmark) will be allocated an in-kind transfer but the exact amount depends on the probability of use (probability x expenditure per capita). These probabilities are presented in Table 1 together for home care and institutional care (see also Appendix). Despite the fact that people living in institutions are excluded from the EU-SILC survey, this in-kind benefit is included in the imputation. Even if no respondent in the data is actually staying in an elderly institution, this service is considered an insurance against old age and thus the possible, not real, benefit taken into account here. The rationale behind it is the same as for healthcare services. Likewise, the pattern of use resembles that of healthcare, except that the targeting is even more focused on the oldest citizens; for example, an eighty-year-old Dane has a probability of 0.63 of using elderly care services compared to the probability of 0.10 of a person in the first age group.Footnote 8 A great deal of variation can be found between countries in the use of elderly care services, varying from the Dutch 68 per cent to the English 11 per cent for the oldest age group. This reflects the varying emphasis accorded to these services across Europe.Footnote 9 In general, these services only benefit a marginal proportion of the whole population – in Slovenia public spending is too modest to make a difference to the household budget in any case.
Use of elderly care services as a share of age group
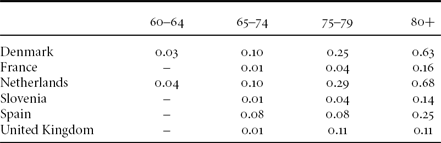
Notes: (a) Due to the lack of available data for the United Kingdom, these numbers refer only to England.
(b) Data for Slovenia include only institutional care.
(c) Age groups: in Denmark and the Netherlands the first group is 60–66, in Spain the second group is 65–79, and in the UK the third age group is 75+.
(d) Data from 2005 for the Netherlands and England, from 2006 for Spain and from 2007 for the rest.
Source: Different national sources (see Appendix).
Analysing inequality and distribution of old and new social spending
The basic unit of analysis is the household. Income is then adjusted to reflect the size and composition of the household: the equivalence scale used in the EU-SILC data assigns the first adult of the household the value of 1, the next adult 0.5 and all children under fourteen years old get the value of 0.3. The period of analysis in this study is one year.
The analyses are based mostly on the study of quintile shares of received benefits and also on the quintile share ratios for old and new social spending (income quintiles are based on weighted equivalised disposable income throughout the study). The ratio between the highest and the lowest income quintile is preferred to the Gini coefficient when one wants to assess the changes in the two extremes.
Analysis and results
Old and new social spending in Europe
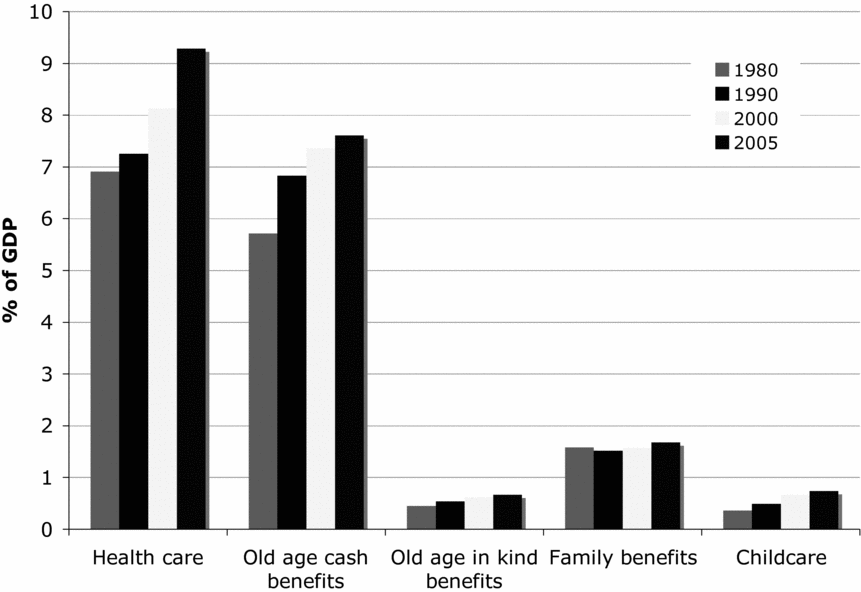
As the ageing population and the reconciliation of work and family life are the main concerns of current new social policies, Figure 3 shows the development of public spending on these domains. First, we notice that spending on elderly care (old-age in-kind benefits) and childcare make up just a small fraction of social budgets compared to spending on the old categories such as health and old-age cash benefits. Secondly, spending in all domains, expect for family benefits, has increased considerably during the last twenty years. Average spending on daycare for children (excluding pre-primary education) has more than doubled from 0.36 to 0.74 per cent of GDP, and spending on elderly care from 0.45 to 0.66 per cent according to the OECD statistics on social expenditures. Although old spending is still greatly more important than new spending, we can conclude that growth has been much faster in the latter category.Footnote 10
Average public spending 1980–2005
Note: Average of sixteen European countries for which data were available.
Source: OECD Social Expenditure Data and OECD Health Data, online: www.stats.oecd.org
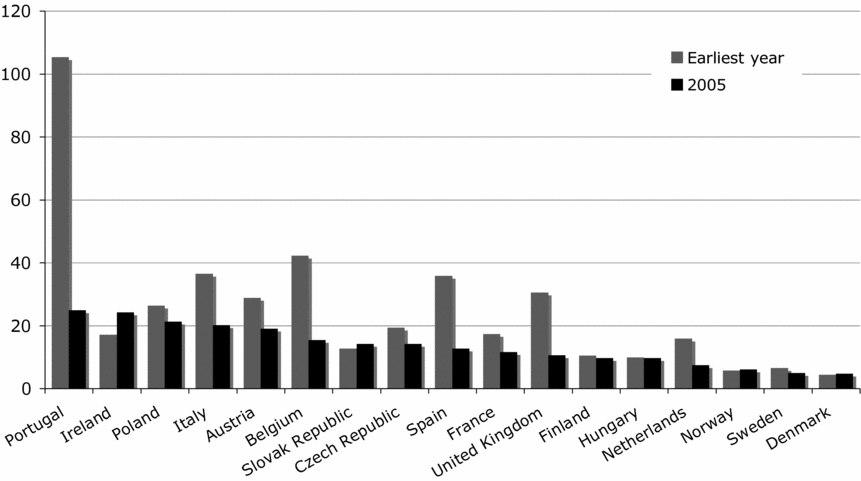
Considering other spending categories, Figure 4 illustrates the changes in the ratio between old and new social spending.Footnote 11 We observe that in the majority of European countries this ratio has decreased (on average dropping from twenty-five to fourteen), meaning an increase in the relative importance of new spending, while the differences between countries remain substantial. The decrease has been the largest in the countries which started with the highest ratios (that is, the most modest new spending), namely the Mediterranean countries, the United Kingdom and Belgium. When we look at the current ratios (for 2006), no clear welfare state clusters emerge from the figure except for the Nordic countries that unsurprisingly have the lowest ratio. In this group, the development has been quite modest as the old spending was only around ten times higher than new spending already at the beginning of the 1990s.
Ratio between old and new spending in 1990 and 2005
Notes: (a) Ratio = old spending in national currency (disability, unemployment, old-age cash, family, survivor, health and sickness) divided by new spending (old-age in-kind, child daycare, pre-primary education).
b) The first data are from the earliest possible year for each country: 2000 for Poland; 1999 for Hungary and Slovak Republic; 1995 for the Czech Republic; and 1990 for the rest of the countries.
Source: OECD Social Expenditure Data, OECD Education Data, online: www.stats.oecd.org.
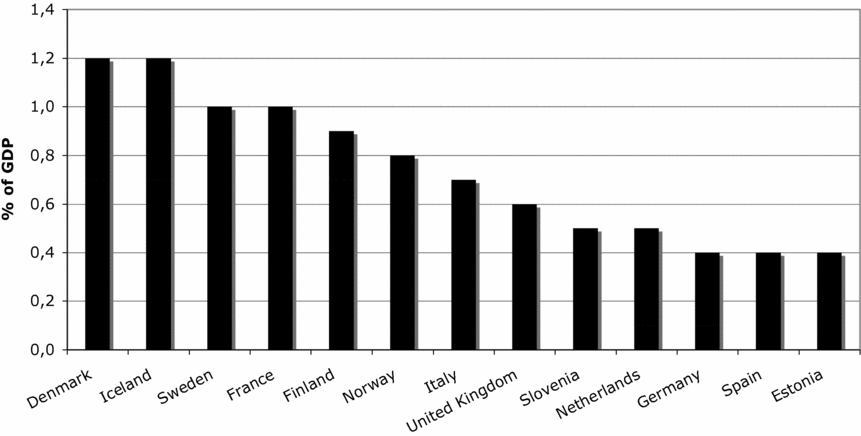
Given the importance of family-friendly objectives in many countries, it is not surprising that spending for families has grown significantly since the 1980. This has happened mostly through the in-kind part of family transfers, that is as investment in daycare and early education (as seen in Figure 3). State involvement in providing childcare will grow even further in the countries where it is now less developed. Even though (and sometimes because) the fertility rates are going down in the vast majority of countries, there is still a growing demand for public daycare services as women are participating in the labour market more than ever before. The Nordic countries unsurprisingly are the most generous spenders on early childhood education and childcare, while in Germany, Spain and Estonia these services are still largely underdeveloped (Figure 5).
Public expenditure on childcare and pre-primary education as a percentage of GDP, in 2005
Source: OECD Family Database.
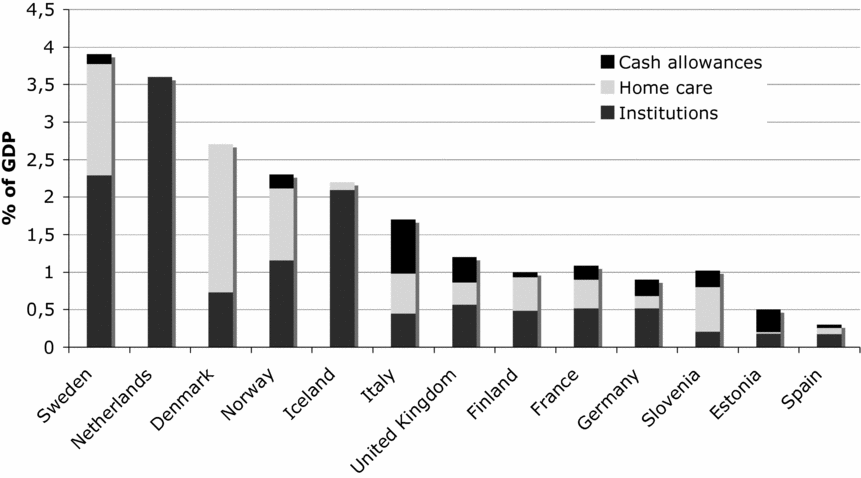
The variation in expenditure levels on elderly care services is substantially greater than for other public spending, such as healthcare (see also Jensen, Reference Jensen2008). The levels shown in Figure 6 are to change in the near future. Especially in Spain, the aim is to devote 1 per cent of its GDP on public long-term care by 2015 (Celdràn et al., Reference Celdràn, Bermejo, Puente, Pastor, Seder, Lacuesta and Pastor2009, cited in Huber et al., Reference Huber, Rodrigues, Hoffmann, Gasior and Marin2009: 98). It has already increased the public provision of elderly care services to a great extent; for example, the number of users of home help has more than doubled in the past twenty years, providing care to 4.09 per cent of the elderly population (sixty-five plus) compared to 1.67 per cent in 1990 (Sancho Castiello et al., Reference Sancho Castiello, De La Pezuela Pinto and Fernández Moreno2006). According to estimations by the European Union (EC, 2006: 157), public spending on long-term care will increase by around 1 percentage point between 2004 and 2050 in most member states.
Public expenditure on long-term care as a percentage of GDP, 2004–2008
Note: No data on different categories for the Netherlands.
Source: Huber, M., Rodrigues, R., Hoffmann, F., Gasior, K., Marin, B. (2009: 99).
Social distribution of old and new social spending
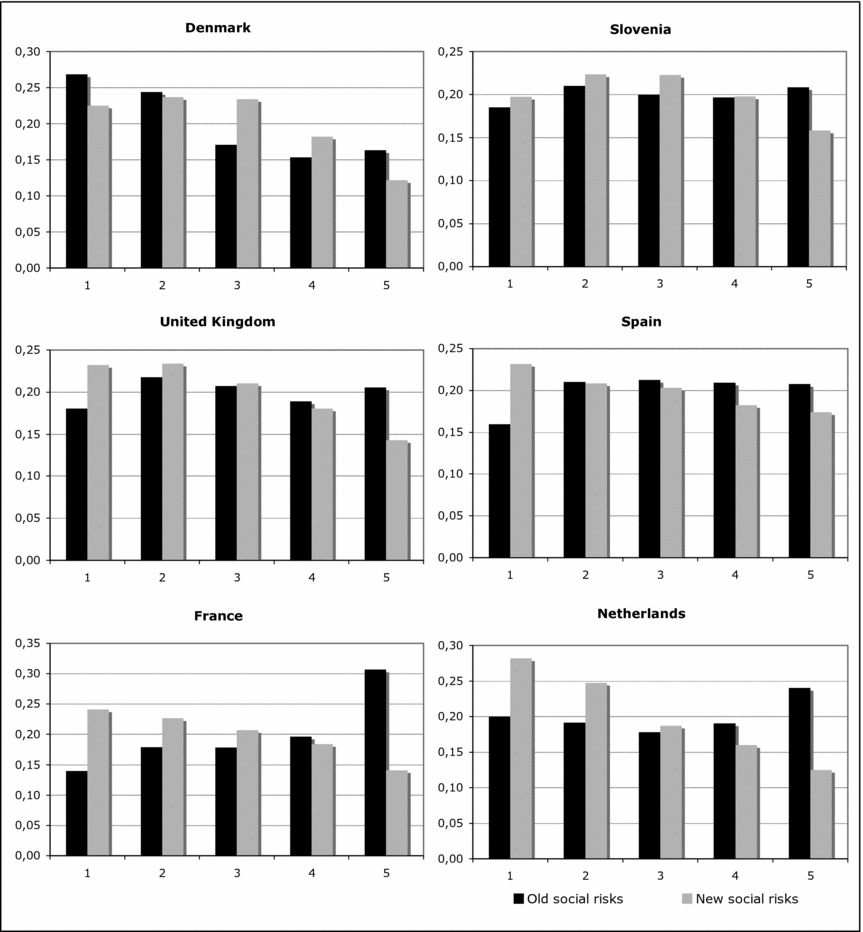
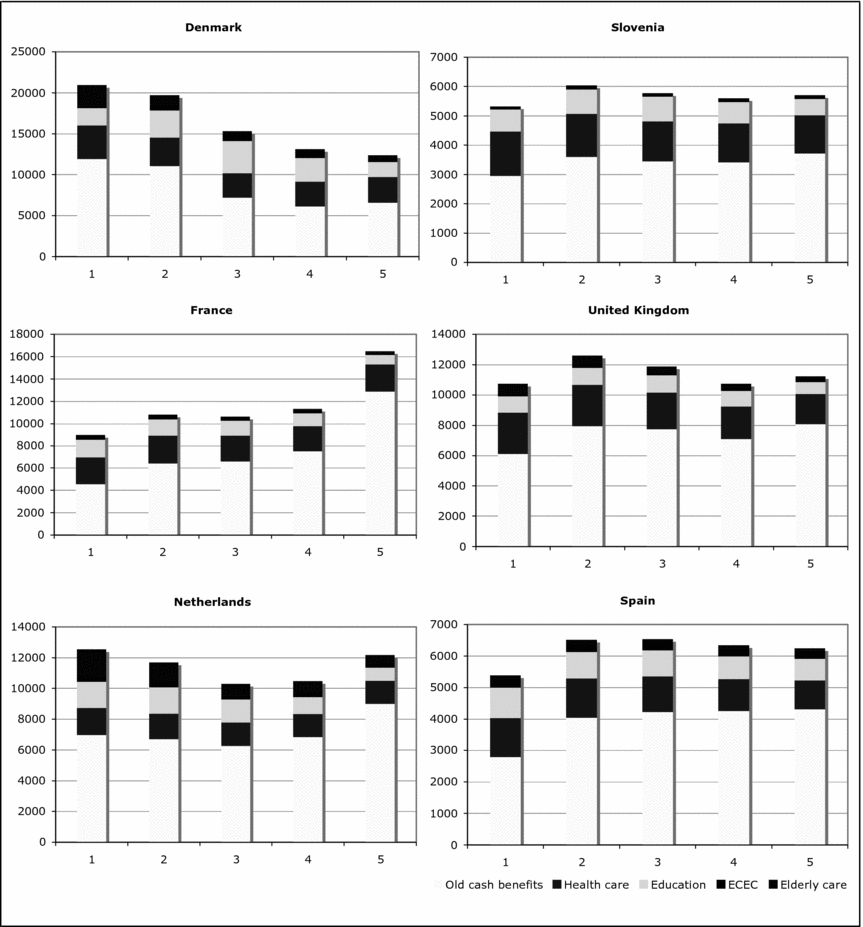
The countries studied in more detail in this article belong to different welfare state regimes. Therefore, the results show somewhat different patterns of distribution among income quintiles. However, there is no sign in any of these countries that indicates that the welfare state is retreating from its equality ambitions by shifting from old to new social spending. Figure 7 illustrates the main findings of this study: spending on new social risks, in the form of public services for childcare, education and elderly care, is generally more progressively distributed among income quintiles than transfers tackling the old social risks. Only in Denmark do the lowest income quintiles benefit more from old spending categories than from new ones. It seems that while old spending follows more clearly the traditional division between welfare state regimes, new spending forms very similar pro-poor or pro-middle class patterns in the countries studied. Healthcare, which is here considered an old social spending category, is also equally distributed in all countries and even slightly progressive (Figure 8).
Distribution of old and new spending across income quintiles as a share of total old and new spending received by quintile
Notes: (a) In all figures for the article, the in-cash benefits are gross income, so the tax at source, the social insurance contribution or both are not deducted in the cases were it is applicable.
(b) Old social risks = benefits for unemployment, old age (only cash), survivor, sickness, disability and family and health care. New social risks = childcare, pre-primary, primary and secondary education, and elderly care services.
(c) In all figures benefits are equivalised to household size.
Source: Author's calculations based on EU-SILC 2007 and imputed benefits for services.
Distribution of benefits across income quintiles
Source: Author's calculations based on EU-SILC 2007 and imputed benefits for services.
The differences between services and benefits received are shown in Figure 8. Even though spending on childcare and elderly care has increased in recent years, they make up a quite-limited resource for each income class since the number of beneficiaries is very limited. However, when compared to the disposable income of the first income quintile, elderly care is definitely non-trivial in Denmark and the Netherlands and, to some extent, in the UK as well (18, 16 and 8 per cent of disposable income respectively). Pre-primary education and childcare appear slightly important income sources only in Spain and France, representing 4 and 3 per cent of disposable income in the first income quintile. Education is a more significant in-kind transfer for all income classes. All in all, it is evident that old cash benefits are still the most important source of income for all income classes.
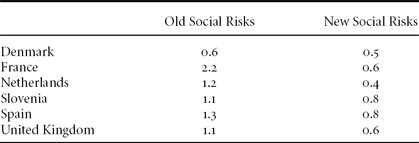
Relatively speaking, in France and in the Netherlands new spending is significantly less pro-rich than the protective social policies that follow the more strictly ‘conservative’ ethos of their welfare architecture. In other countries, differences between the two categories are less pronounced. Table 2 considers this aspect more clearly by examining the quintile share ratios for old and new spending. In all countries, new social spending benefits the bottom quintile more than the top quintile (shares below one), and this is especially so in Denmark and in the Netherlands where the top quintile receives only a half of the amount received by the bottom quintile. On the other hand, such pro-poor distribution is only seen in Denmark when old social spending is studied (note, however, that benefits from old spending do not include the taxes or social contributions that they can be subjected to). And, conversely, in France, the richest quintile receives more than twice as much as the poorest quintile. This finding contests Cantillon's claim that new social policies benefit the richer income groups more than the others.
Quintile share ratios (Q5/Q1) for old and new spending
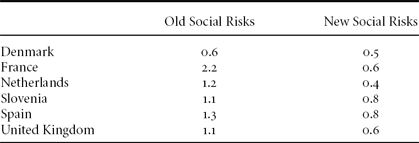
Source: Author's calculations based on EU-SILC 2007 and imputed benefits for services.
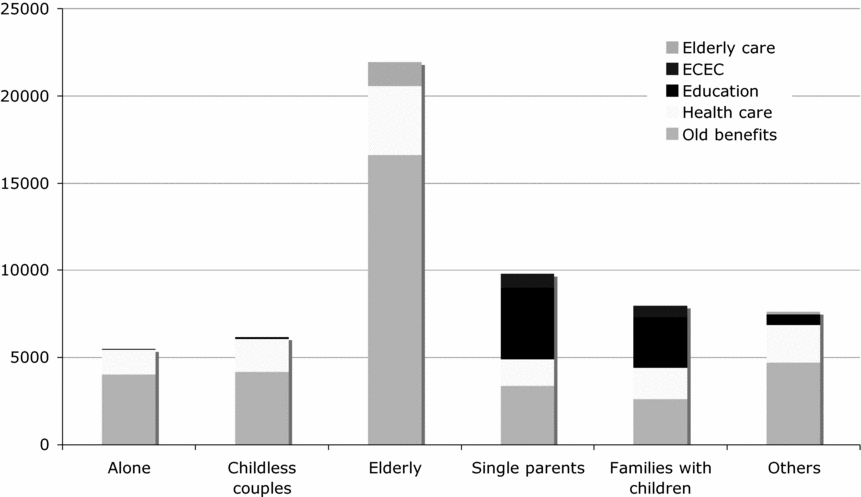
Finally, Figure 9 visualises how different household types benefit from cash and non-cash transfers. Elsewhere in this study, healthcare has been considered part of ‘old spending’ but in this figure, for the sake of clarity, it is shown separately from cash benefits. Although the figure illustrates the distribution of public transfers in the United Kingdom only, the pattern is common across the rest of the countries: while the benefits received for elderly care and childcare vary from non-existent (Slovenia) to modest (rest of the countries), the relative height of the pillars remain the same. The elderly gain the most from the traditional protective welfare state through pensions and the healthcare system. The increased attention paid to social investment and new social risks has not altered the picture; unemployment, disability, sickness, family, survivor's and old-age benefits and healthcare services still remain the largest expenditure categories in modern welfare states. But, as the new rhetoric goes, families with children benefit considerably from the new spending categories: the benefits from childcare and education equal the old social benefits in their household budget. Hence, there is evidence for a shift from supporting (only) the elderly to investing in youth and promoting the labour-market attachment of both parents. This finding goes, to some extent, against the concern of Esping-Andersen and Sarasa (Reference Esping-Andersen and Sarasa2002) that population ageing would mean higher spending on the retired at the expense of children (see also Bradshaw and Holmes, Reference Bradshaw and Holmes2013). If activation and re-training, important new spending categories, had been taken into account, households not benefiting much in these analyses (people living alone, childless couples, and others) might benefit as well.
Distribution of benefits by household types in the United Kingdom
Source: Author's calculations based on EU-SILC 2007 and imputed benefits for services.
5 Conclusion
As new social policies have prioritised the redistribution of opportunities over the redistribution of income, there is a concern that such a focus on the future or on employment growth will undermine current endeavours to reduce existing inequalities. In this article, I have analysed the social distribution of benefits in cash and in kind and the possible (in)egalitarian consequences of the shift from spending against traditional risks such as unemployment to spending against new social risks such as the reconciliation of work and family life.
As seen above, in the majority of European countries, welfare state budgets have placed relatively more emphasis on new social spending, while both the new and old categories have grown during the last two decades in absolute terms. However, there is no evidence that focusing on social investment and new social risks disturbs the egalitarian ambitions of the welfare states in any of the six countries studied. Neither can we find great variance between welfare state regimes in this matter: the most significant differences are caused by social spending on old social risks – the initial variance (meaning disposable income or benefits from old spending here) in the patterns of distribution is not greatly affected by the inclusion of education, childcare and elderly care. However, in each country, the inclusion of public services reduces inequality. Public services clearly function as a means of redistribution towards the bottom income quintiles, and new social spending is generally more equally distributed among income quintiles than old social spending. This is especially the case in France and the Netherlands, where the insurance system against traditional risks follows the ideals of conservative welfare states whilst new social spending does not.
As hypothesised, the socio-demographic structure determines the results in each country: I have demonstrated that the new social spending benefits, on the one hand, families with children and single-parent families the most, and, on the other hand, elderly households receive the greatest benefit from the old social spending. Thus, the distribution of household types among income classes shows how the focus on one or the other might influence inequality. In the Nordic countries where children most often belong to middle-class households, new social spending translates into pro-middle class spending, while in the countries with higher levels of child poverty, such spending can efficiently smooth the income gap between the extremes if access to services is equal. More research should be conducted on the different use of public services vis-à-vis cash benefits or tax credits by social classes. According to Morgan (Reference Morgan, Michel and Mahon2002), unified childcare policy in France is vulnerable to the libre choix ethos as parents from different social classes have diverging interests in the kind of system they prefer: higher-income parents, essential for the funding of public system, are opting out and choosing cash benefits instead of services. For poorer families, it might be impossible to benefit from tax credits the same way or purchase a private service with equal relative cost.
From a political point of view, these findings are critical to the formulation of reforms in the public-service sector and the design of new welfare architecture. We should bear in mind that even if vertical redistribution from the rich to poor may only be one rationale of social action, it should not be overlooked when directing the shift from protective social policies to new ones based on activation, or from insurance to investment. Even more importantly, we should finally look beyond Le Grand's (Reference Le Grand1982) outdated analysis of the pro-rich character of publicly provided services that does not seem to hold any longer in European countries. New social risks hit people with low incomes the hardest, therefore targeting more resources on mitigating the challenges of increased costs, or reduced income leads to redistribution to the bottom income classes. However, it is imperative to guarantee an equal access to services and make sure that different policies cater to the needs of different income classes equally. As cash benefits may be substituted for public services, and vice versa, we should study carefully the distributional impacts of different policy alternatives.
Appendix
ECEC services: spending and users
Childcare: data sources
Elderly care: spending and users
Elderly care: data sources