Introduction
In developing countries worldwide, collection and conservation of crop genetic resources to maintain genetic diversity has been of high priority for decades to contribute to achieving food security, particularly for those countries with a fast-growing population (Upadhyaya et al., Reference Upadhyaya, Laxmipathi Gowda and Dvssr2007; Upadhyaya and Gowda, Reference Upadhyaya and Gowda2009). However, as the size of collections increases, so does the cost of conservation and evaluation (Fao/Ipgri/Onu, 2014). There is thus a need to identify a reduced number of accessions representing the whole collection, referred to as a core collection, which can be managed efficiently (van Hintum et al., Reference van Hintum, Brown, Spillane and Hodgkin2000). For maintenance of diversity and identification of valuable genes of this core subset, evaluation of germplasm is essential and should not be overlooked (Priyanka et al., Reference Priyanka, Kumar, Dhaliwal and Kaushik2021). This is particularly important for orphan crops like the indigenous edible-seeded cucurbits which are endangered and have been neglected by national research programmes (Zoro Bi et al., Reference Zoro Bi, Koffi and Djè2003; Zoro Bi et al., Reference Zoro Bi, Koffi, Djè, Malice and Baudoin2006).
Phylogenetically, bottle gourd (Lagenaria siceraria (Molina) Standl.) is close to many economically important cucurbit species including cucumber, watermelon and melon. Easily distinguished by its white flowers and great variations in fruit and seed morphology (Kalyanrao et al., Reference Kalyanrao, Tomar, Singh and Aher2016; Mashilo et al., Reference Mashilo, Shimelis and Odindo2017). According to Konan et al. (Reference Konan, Guyot, Koffi, Vroh-Bi and Zoro Bi2020), there are two varieties: the hard-shelled, used as utensils and the soft-shelled, grown for its edible seeds. Mature fruits of the hard-shelled variety, which may be toxic inside, have an extremely hard and waterproof rind when dried. They can be used as decoration, for multi-purpose containers (bowls, boxes, water jugs, cups, planters) and musical instruments etc…(Sithole et al., Reference Sithole, Modi and Mabhaudhi2016). In Côte d'Ivoire, Benin and Nigeria, the soft-shelled variety is the most cultivated oleaginous cucurbit (Achigan-Dako et al., Reference Achigan-Dako, Fanou, Kouke, Avohou, Vodouhe and Ahanchede2006; Loukou et al., Reference Loukou, Lognay, Barthelemy, Maesen, Baudoin and Zoro Bi2011) owing to its high agronomic potential. In fact, the nutritious seeds of this variety, play an important role in the social and cultural lives of several people in West Africa (Zoro Bi et al., Reference Zoro Bi, Koffi and Djè2003; Achigan-Dako et al., Reference Achigan-Dako, Fagbemissi, Avohou, Vodouhe, Coulibaly and Ahanchede2008). For example, edible oil can be taken out of the seeds, and when dried, lightly toasted and ground, they can be used as sauce thickener and served only to special guests or during special events (Zoro Bi et al., Reference Zoro Bi, Koffi and Djè2003). The oil content of kernels is about 56.5%, the protein 34.34%, crude fibre 2.6% and mineral matter 5.01% (Loukou et al., Reference Loukou, Lognay, Barthelemy, Maesen, Baudoin and Zoro Bi2011). In Botswana, Zimbabwe and South Africa this oil extract is an ideal alternative for vegetable oil (Chimonyo and Modi, Reference Chimonyo and Modi2013). The seeds are subject to transactions between urban and rural areas. In Côte d'Ivoire, extracted, washed, dried, shelled and winnowed seeds are sold at 2.5 $ per kg which is almost twice the price of coffee and is greatly exceeding cocoa price (1.44 $). L. siceraria thus represents an excellent plant model for which improved cropping systems implementation can contribute to the food security, sources of income, and alleviate the poverty of rural women who are the main producers in tropical Africa and specifically in Côte d'Ivoire (Zoro Bi et al., Reference Zoro Bi, Koffi and Djè2003).
The species is well adapted to extremely divergent agro-ecosystems and various cropping systems characterized by minimal inputs (Achu et al., Reference Achu, Fokou, Tchiégang, Fotso and Tchouanguep2005; Achigan-Dako et al., Reference Achigan-Dako, Fanou, Kouke, Avohou, Vodouhe and Ahanchede2006). Based on this advantage, in Côte d'Ivoire, the University of Nangui Abrogoua is undertaking improvement of this crop, involving the farmers and ANADER (National Agency for Rural Development Support), which has expertise in on-farm popularization and promotion and ensure the effective transfer of research results to farmers (PIC-2004, 2006). The main work done for the improvement of the crop was relative to plant material collecting and genetic characterization, improved cropping systems implementation, genetic control of yield, yield components traits for the identification of QTLs and molecular differentiation of variety (Zoro Bi et al., Reference Zoro Bi, Koffi and Djè2003; Achigan-Dako et al., Reference Achigan-Dako, Fanou, Kouke, Avohou, Vodouhe and Ahanchede2006, Reference Achigan-Dako, Fagbemissi, Avohou, Vodouhe, Coulibaly and Ahanchede2008; Zoro Bi et al., Reference Zoro Bi, Koffi, Djè, Malice and Baudoin2006; Achigan-Dako, Reference Achigan-Dako2008; Koffi et al., Reference Koffi, Anzara, Malice, Djè, Bertin, Baudoin and Zoro Bi2009; Loukou et al., Reference Loukou, Lognay, Barthelemy, Maesen, Baudoin and Zoro Bi2011, Reference Loukou, Lognay, Baudoin, Kouamé and Zoro Bi2012; Gbotto et al., Reference Gbotto, Koffi, Baudoin and Zoro Bi2015; N'Gaza et al., Reference N'Gaza, Kouassi, Koffi, Kouakou, Baudoin and Zoro2019; Konan et al., Reference Konan, Guyot, Koffi, Vroh-Bi and Zoro Bi2020). The regeneration of cucurbits in gene banks is mainly done through botanical seeds. Unfortunately, these seeds quickly lose their germination capacity and cannot be preserved for more than a year (Al-Maskri et al., Reference Al-Maskri, Khan, Iqbal and Abbas2004). Thus, regular plant regeneration is required to avoid genetic resource depletion. Also, maintaining the true plant type is constraining and very challenging, due to the numerous practical precautions required by the mating system. Specifically, for L. siceraria, the task is complicated by the creeping behaviour of the species, making appropriate harvesting tedious (Zoro Bi et al., Reference Zoro Bi, Koffi and Djè2003; Achigan-Dako et al., Reference Achigan-Dako, Fagbemissi, Avohou, Vodouhe, Coulibaly and Ahanchede2008). Dealing with a reliable core subset would help in managing L. siceraria genetic resources efficiently.
An assessment of the genetic diversity based only on morpho-agronomic traits might be biased because distinct morphotypes can result from only a few mutations while they share a common genetic basis. Therefore, a reliable core collection of crop genetic resources is usually determined by combining agronomic and molecular data (van Hintum, Reference van Hintum1994; Dahlberg et al., Reference Dahlberg, Zhang, Hart and Mullet2002; Wang et al., Reference Wang, Guan, Guan, Li, Ma, Dong, Liu, Zhang, Zhang, Liu, Chang, Xu, Li, Lin, Luan, Yan, Ning, Zhu, Cui, Piao, Liu, Chen and Qiu2006; Cunff et al., Reference Cunff, Fournier-Level, Laucou, Vezzulli, Lacombe, Adam-Blondon, Boursiquot and This2008).
Molecular markers, including amplified fragment length polymorphism (AFLP), have shown the potential to complement already existing estimations of diversity, and to be used to build core collections as a foundation for genebank management, future breeding work and inheritance studies (Vos and Kuiper, Reference Vos, Kuiper, Caetano-Anollés and Gresshoffand1997; Sorkheh et al., Reference Sorkheh, Shiran, Aranzana, Mohammadi and Martínez-Gomez2007). AFLP is a fast and reliable tool to generate a large number of discriminative molecular DNA markers (Sorkheh et al., Reference Sorkheh, Shiran, Aranzana, Mohammadi and Martínez-Gomez2007).
In this study, we used agromorphological and AFLP markers to evaluate the genetic diversity and population structure in accessions of L. siceraria. The results obtained from this characterization will be used in other studies, to build a core collection of the oleaginous bottle gourd and to define appropriate sampling strategies for the conservation of the target species' genetic resources in Côte d'Ivoire.
Material & methods
Agromorphological characterization
Plant material and collection sites
A total of 173 accessions were used in this study. Plant materials were sampled from a collection of L. siceraria maintained at the University of Nangui Abrogoua (Abidjan, Côte d'Ivoire). The seed samples were collected mainly in four agro-ecological regions (Centre, East, North and South). The sampled accessions were representative of two cultivars. The first, with round fruits is characterized by the presence of a cap on the distal side of seeds (C) while the second cultivar (SC), with elongated fruits is characterized by seeds without a cap.
Study site and experimental design
The study was carried out in the district of Abidjan, Côte d'Ivoire from September 2014 to March 2015. The experimental site was located in Nangui Abrogoua University, between latitudes 5°17′N–5°31′N and longitudes 3°45′W–4°31′W with abundant rainfall (annual average around 700 mm) and a mean temperature of 27°C.
The field layout was a completely randomized block design, with four blocks. Each block consisted of four plots, containing 50 plants (i.e., 10 accessions, each represented by five plants). The planting distance was 3 m between and within rows with 1.5 m of within rows. Two consecutive plots were spaced by 3 m. The plots were hoe weeded regularly to prevent any interaction between plant materials and weed load. Disease and pest control was done by applying a carbamate-based insecticide when necessary. No fertilizer or irrigation was applied at any time for the duration of the trial.
Data collection
The trials were regularly monitored throughout the growing season and nine agronomic characters selected from several studies on various cucurbits (Maggs-Kölling et al., Reference Maggs-Kölling, Madsen and Christiansen2000; Morimoto et al., Reference Morimoto, Maundu, Fujimaki and Morishima2005; Marr et al., Reference Marr, Xia and Bhattarai2007) were scored. For each plant, the length was measured. The number of branches from the central taproot (BN) was counted. Five data types were collected, comprising fruit weight (FWE), length (FL), width (FWI), seed cavity diameter (SCD) and seed number (SN). Seed traits analysed included the whole seeds weight and 100-seeds weight (100-SWE). The fruit measurements and 100-seeds weight were scored using five individuals randomly selected on each plant.
Agronomic traits data analysis
Multivariate analysis of variance (MANOVA) was performed using the SAS software package (SAS, 2004) to investigate the difference between accessions, and thereafter between collection zones. For each parameter, one-way analysis of variance was performed using the Statistica package program (StatSoft, 2005). In case of a significant difference, the least significant difference multiple range-tests were used to identify the means which differ (Dagnelie, Reference Dagnelie1998). Principal component analysis was performed to identify the discriminant parameters followed by the hierarchical cluster analysis by the unweighted pairgroup method using the arithmetic average (UPGMA). A MANOVA and a factorial discriminant analysis were performed to check the difference between the variable means for each group obtained with the clustering analysis. A confusion matrix was constructed, to check the reliability of groups as defined by the hierarchical clustering.
AFLP markers analysis
Plant material
One hundred and seventy-three accessions were evaluated using agromorphological traits. The same accessions were thereafter screened using AFLP markers. The accessions found to be polymorphic when assessed with the AFLP markers were retained, while accessions showing monomorphism were dropped from further analysis.
The retained accessions for molecular characterization represent two cultivars, similar to the ones used for the morphological characterization. The cultivar ″C″ was composed of 3 accessions while the cultivar ″SC″ comprised 145 accessions, due to seed availability in each cultivar. A complete description of these accessions is given in online Supplementary Table S1. Five seeds per accession (total 740 seeds) were analysed.
DNA isolation
Young leaves (first or second true-leaf stage), from each seedling were collected and stored at −80°C until use. To avoid co-isolation of polysaccharides, polyphenols and other secondary compounds that alter DNA quality, we used the improved procedure for DNA isolation from young leaves of watermelon (Levi and Thomas, Reference Levi and Thomas1999), with a few modifications. Young leaf (0.1 g) tissue was finely ground in 1.5 ml microtubes in liquid nitrogen and resuspended in 700 μl CTAB extraction buffer [0.1 M Tris-Base, 1.4 M NaCl, 2.5% w/v cetyltrimethylammonium bromide (CTAB), 20 mM EDTA-dissodium, 0.2% w/v sodium dodecyl sulphate (SDS), 0.5% w/v Sarkosyl, 1% w/v PVP polyvinylpyrrolidone (MW 40 (PVP-40) and 1% w/v PVP polyvinylpyrrolidone (PVP)), 5 μl of DTT (1,4-dithio-DL-threitol) to each 1 ml of extraction solution; 0.2% beta-mercaptoethanol. Each tube was mixed by gentle agitation and then incubated for 30 min at 65°C. The homogenate was extracted twice with chloroform isoamyl alcohol (24:1) and centrifuged at 3500 rpm at 25°C for 15 min. Nucleic acids in the aqueous phase were precipitated in 350 μl of isopropanol and collected by centrifugation (3500 rpm for 30 min at 4°C). The DNA pellet was washed twice with 70% v/v ethanol and dried. Then the pellet was re-suspended in low salt TE buffer (10 mM Tris-HCl (pH 8), 1 mM EDTA) containing 10 g ml−1 RNAse. The DNA solution was stored at −20°C until use. DNA concentration was measured by Nanodrop ND-1000 spectrophotometer (NanoDrop Technologies, Inc).
AFLP fingerprinting
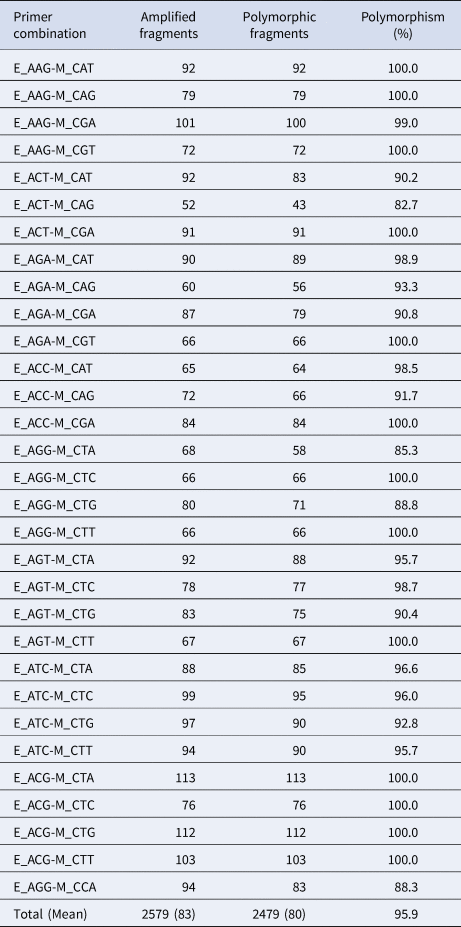
The AFLP procedure developed by Vos et al. (Reference Vos, Hogers, Bleeker, Reijans, van de Lee, Hornes, Frijters, Pot, Peleman, Kuiper and Zabeau1995) was modified using an Invitrogen commercially available kit. According to this protocol, a high-quality genomic DNA (250 ng; A 260/A 280 ratio of 1.7–2) was double-digested with EcoRI and MseI at 37°C for 2 h and 70°C for 15 min. The digested DNA fragments were ligated with EcoRI and MseI adaptators, respectively. Complete restriction of DNA was tested on 1.6% TBE agarose gels. AFLP fragments were generated according to a modified version of the procedure outlined by Vos et al. (Reference Vos, Hogers, Bleeker, Reijans, van de Lee, Hornes, Frijters, Pot, Peleman, Kuiper and Zabeau1995). Thirty-one primers (one fluorescently labelled), adaptors and sequences are provided in Table 1.
Total number of amplified and polymorphic fragments with 31 amplified fragments length polymorphism primer combinations

Enzymes and PCR components were all purchased from New England biolabs and restriction digests were simultaneously performed: The digestion included 1 μg of genomic DNA in a 40 μl reaction volume with 5U MseI and EcoR1 enzymes each, 1X enzymatic buffer and 0.1 mg ml–1 BSA at 37°C for 3 h. Pre-selective PCR included 0.1 mg ml–1 BSA, 0.5 μM of the EcoRI + 0/MseI + 0 primers 0.25 U Taq DNA polymerase and 5.0 μl of digestion ligation product) in 20 μl reactions. Selective PCR included 2.0 μl (1:10 dilution) of preamplified DNA, 0.6 nmol MseI primer, 0.5 nmol EcoRI primer, 0.2 mM dNTP mix, 0.24 mM MgCl2, 1.0 standard Taq buffer, 0.625 U Taq polymerase and 0.0024 mg ml–1 BSA in 10 μl reactions.
The PCR conditions differed depending on the nature of the selective extensions of the AFLP primers used for amplification. AFLP reactions with primers having non-selective nucleotide were performed for 30 cycles with the following cycle profile: 30s DNA denaturation step at 94°C, 1 min annealing step at 56°C and 2 min extension step at 72°C. Before and after the cycles, initial denaturation at 95°C for 3 min and the final extension at 72°C for 10 min were done respectively. AFLP reactions with primers having three selective nucleotides were performed for: (i) 15 cycles with the following cycle profile: 30 s DNA denaturation step at 94°C, 30 s annealing step, 1 min extension step at 72°C (ii) 23 cycles of 30s at 94°C, 1 min annealing step, 2 min at 72°C; followed by 10 min final extension at 72°C. The annealing temperature in the first cycle was 65°C was subsequently reduced each cycle by 0.7°C for the next 12 cycles and continued at 56°C for the remaining 23 cycles. All amplifications were performed in 384-plate GeneAmp® PCR System 9700 Thermal Cycler (Applied Biosystems).
The success of selective DNA amplification was confirmed on a 2.0% w/v agarose gel. Due to the number of fragments generated using the AFLP technique and the effect of dye quenching, only two fluorescent dyes were used and post PCR co-loading of PCR product were done based on the dye of the primer, 1.5 μl for NED, and 1.0 μl for 6-FAM (Kitavi, Reference Kitavi2015). AFLP fragments (1 μl of PCR product cocktail) were run with a GeneScan 500 LIZ internal size standard (0.012 μl) and formamide (9 μl) on an ABI Prism 3730 genetic analyser AFLP capillary at 60°C for 30 min at 15 kV, after denaturation at 95°C for 5 min and rapid cooling.
Fragment size was determined using GeneMapper version 4.1 software (PE Applied Biosystems) relative to internal LIZ-labeled GeneMapper 500 size standards from Applied Biosystems. The efficiency of discrimination was assessed in terms of number of polymorphic markers generated and the ability to generate unique genotypes, the latter represented as genotype index (McGregor et al., Reference McGregor, Lambert, Greyling, Louw and Warnich2000). To create a binary matrix, amplified fragments of 50–500 base pairs were scored as present (1) or absent (0) with GeneMapper version 4.1.
Data analysis
Each AFLP fragment was considered as a putative locus and assumed a dominant marker with two alleles. The number of monomorphic and polymorphic AFLP fragments was determined for each primer pair. Minor AFLP polymorphisms that were not uniformly amplified (e.g. were faint or not distinct in some genotypes) were discarded from the analysis.
The total number of AFLP bands present in the L. siceraria set of accessions were calculated in excel using the ‘count if’ function.
One thousand bootstrapped replicate matrices of pairwise genetic diversity and differentiation statistics among populations were calculated in AFLP-SURV v1.0 (Vekemans, Reference Vekemans2002; Vekemans et al., Reference Vekemans, Beauwens, Lemaire and Roldan-Ruiz2002). The AFLP allele data were used to realize a dissimilarity matrix between genotypes using a simple matching coefficient (Sokal and Michener, Reference Sokal and Michener1958).
The dissimilarity matrix was used for clustering the genotypes, based on unweighted neighbour-joining method (NJ). The analysis was performed using DARwin version 6.0 (Perrier et al., Reference Perrier, Flori, Bonnot, Hamon, Seguin, Perrier and Glaszmann2003).
The reliability of the generated dendrogram was also tested by bootstrap analysis 1000 times to assess the repetitiveness of genotype clustering.
A Bayesian method with a non-uniform prior distribution of allele frequencies (Zhivotovsky, Reference Zhivotovsky1999) was used to estimate the allelic frequencies, which assumed Hardy-Weinberg equilibrium. These allele frequencies were used to analyse the genetic diversity within and between accessions according to the method described by Lynch and Milligan (Reference Lynch and Milligan1994).
Comparison between genetic diversity parameter values among population were examined according to Wilcoxon test using Statistica version 7.1 (StatSoft, 2005).
Analysis of molecular variance (AMOVA) was calculated to estimate the partitioning of genetic variation at different levels and to investigate the hierarchical level upon which genetic variation can be attributed to using GenAlEx version 6.502 (Peakall and Smouse, Reference Peakall and Smouse2006). The significance of AMOVA was tested using a nonparametric permutation approach with 999 permutations. The partitioning of molecular variance within and among groups and accessions was calculated by the AMOVA as per GenAlEx (Excoffier et al., Reference Excoffier, Smouse and Quattro1992).
To infer population structure, unsupervised Bayesian clustering was performed with the software STRUCTURE version 2.3.4 (Falush et al., Reference Falush, Stephens and Pritchard2007): five independent replicates were performed for the range of clusters (K) predefined from 1 to 10 under the admixture model with correlated allele frequencies. The analysis was run based on recommendations for dominant markers and polyploid genotypes (Dufresne et al., Reference Dufresne, Stift, Vergilino and Mable2014), and by adopting the following parameter set: 100,000 Markov Chain Monte Carlo iterations following a 50,000 burn-in period, with no prior information on the population of origin (USEPOPINFO = 0) and accounting for the presence of recessive alleles (RECESSIVEALLELES = 1). The best fitting K value was identified with the Evanno et al. (Reference Evanno, Regnaut and Goudet2005) ΔK method. Permutations of the most likely results among different runs for each K were conducted in CLUMPP (Jakobsson and Rosenberg, Reference Jakobsson and Rosenberg2007). DISTRUCT (Rosenberg, Reference Rosenberg2004) was used to visualize the STRUCTURE results.
Results
Agronomical characterization
A comparative analysis within accessions was computed using multivariate analysis in order to measure 9 agromorphological traits for 173 accessions (online Supplementary Table S2).
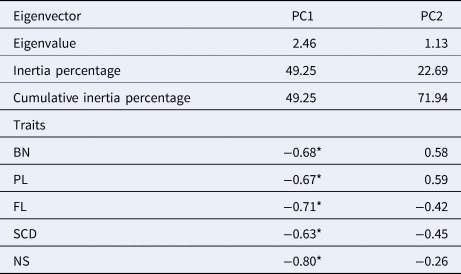
The relative discriminating capacity of the principal component (PC) axes was shown by their high Eigenvalues. The result of the PC axes (Table 2) showed that two axes had Eigenvalues greater than 1 that all together accounted for over 70% of the total variability.
Eigenvectors, eigenvalues and inertia percentage explained by the two first canonical variables for five traits analysed in 173 accessions of the oleaginous Lagenaria siceraria
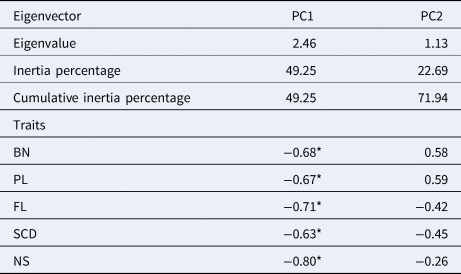
BN, number of branches; PL, plant length; FL, fruit length; SCD, seed cavity diameter; NS, number of seeds per fruit; PC1, discriminant factor 1; PC2, discriminant factor 2.
* Significant value: variables that contribute the most to axe formation.
The first two PCs accounted for 71.94% of the total variability. The first PC (PC1) accounted for 49.25%, while the second PC (PC2) accounted for 22.69%. The PC1 is loaded with the number of branches, plant length, fruit height, seed cavity diameter and the number of seeds per fruit. These five traits were negatively correlated with PC1. This axis indicated that the sturdiest plants are the most productive.
online Supplementary Figure S1 shows the position of the accessions relative to the two PCs. On the basis of their average linkage to the two axes, the 173 accessions were grouped into four aggregates. The accessions from the Northern part of Côte d'Ivoire are mostly grouped left to axis 1 (purple cluster), where the most productive and vigorous plants are found. The accessions from the southern part were mostly clustered at the right side of axis 1 (green cluster). They are opposite to the northern part where plants are weak and less productive. Accessions from East and North-East are located on both sides of axis 1 (red and blue clusters), where plants have intermediate characteristics.
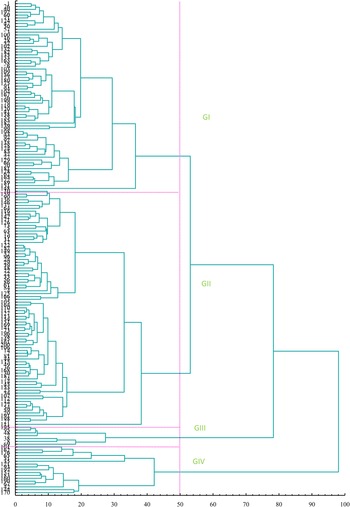
The analysis of morphological differentiation among accessions computed from a matrix of pairwise Euclidean distances displayed four major groups. The phenogram, based on the unweighted pair group method arithmetic (UPGMA), showed that these groups differ in distance by 50 (Fig. 1). All four groups had accessions from various origins and cultivar. The highest number of accessions was assembled in cluster II with 83 accessions, followed by clusters I and IV with 66 and 17 accessions, respectively. Cluster III had only 7 accessions. Comparison of groups using the MANOVA showed significant differences between the four groups (F = 29.08; P < 0.001). This difference was due to five characters (BN, PL, FL, SCD and SN) out of the nine measured. The ANOVA showed partial distinction among groups (data not shown).
Dendrogram of 173 accessions constructed using an UPGMA group analysis method based on Euclidian distance from agromorphological data GI, group I; GII, group II; GIII, group III; GIV, group IV.

Only one (NGFr) of the five parameters was able to distinguish between groups. Accessions from cluster IV showed the best agronomic characteristics. The plants had the highest number of branches, the biggest fruits with the highest number of seeds and the largest seed cavity diameters.
The composition of group II is slightly different as compared to the results displayed by the confusion matrix and the hierarchical clustering. This group contains 81 accessions instead of 83. Two accessions of this group having been reclassified in group I. The composition of the other groups is 100% similar to the hierarchical clustering groups (online Supplementary Table S3).
AFLP markers variability
Estimation of the efficiency of AFLP markers
Of the 173 accessions studied, 148 were found to be polymorphic when assessed with the AFLP markers. The 25 remaining accessions were monomorphic and were dropped from further analysis. Therefore, 148 accessions were screened using 33 AFLP primer combinations. Of these, 31 primer combinations (Table 1) were selected for further analysis based on the number of distinct reproducible fragments amplified among closely related genotypes.
The AFLP fingerprinting of 148 accessions of L. siceraria with 31 different primer combinations (Table 1) revealed a total number of 2579 clearly identifiable bands (with an average of 83 bands per primer), of which 2479 (80%) were polymorphic. A range of 52 (E_ACT-M_CAG) to 113 (E_ACG-M_CTA) bands were amplified per primer combination. Primer combinations used were highly polymorphic ranging between 82.7% (E_ACT-M_CAG) to 100% (for eight primers, e.g. E_AAG-M_CGT).
Genetic structure
AFLP analyses revealed that the pairwise genetic distances (GDs) within the population showed the highest genetic distance between Centre and North (GD = 0.173) and the lowest was between East and South-East (GD = 0.013). The accession pairwise FST values showed the highest differentiation between North and South-East (FST = 0.394) and the lowest differentiation was observed between East and South-East (FST = 0.060; online Supplementary Table S4).
AMOVA within and among the six populations (which represent geographical regions of Côte d'Ivoire) of L. siceraria studied revealed that the majority of genetic variation (72%) occurs within populations, while 28% of the variation resides among populations (Table 3). The AMOVA performed for differentiation among cultivars exhibited similar trends to the one with population, based on no prior grouping of accessions. We found more genetic diversity within cultivar (97%) than among cultivars (3%).
Partitioning of genetic variation using AMOVA on AFLP data considering (a) no prior grouping of populations; (b) no prior grouping of cultivars

PP, partitioning all population; PCu, partitioning per cultivar; df, degrees of freedom; SS, sum of square; Ms, mean square; Est. var., estimated variance and %D distribution of total variance. The probability was estimated computing 999 permutations.
Cluster and assignment analysis
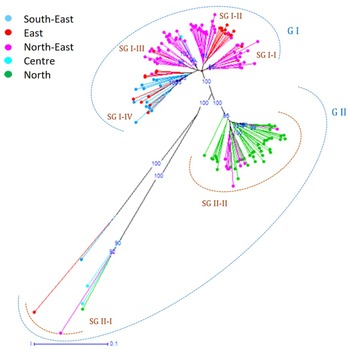
A neighbour-joining phenogram was constructed using the AFLPs datasets (Fig. 2). Trees were rooted using the oleaginous bottle gourd accessions. A cluster comprising accessions from East, North-East, North, Centre and South-East was resolved with a bootstrap value support of 100. This cluster split into four subclusters represented by regions as mentioned above. The second cluster contained accessions from different ecological zones which further split into two sub-groups.
NJ tree of 148 Lagenaria siceraria accessions using AFLPs data. Numbers shown at different nodes represent percentage confidence limits obtained by the bootstrap analysis G I, group I; G II, group II; SG I-I, subgroup I from group I; SG I-II, subgroup II from group I; SG I-III, subgroup III from group I; SG I-VI, subgroup IV from group I; SG II-I, subgroup I from group II; SG II-II, subgroup II from group II.

In the first subcluster (SG II-I), one accession originated from the South-East, two from the Centre, one from East, one from North and one from North-East. In the second subcluster (SG II-II), accessions originated from North and North-East (Fig. 2). This sub clustering was supported with a bootstrap value of 100. The analysis of the dendrogram also showed that accessions in the second subcluster (SG II-II) (except those from the Centre) were grouped separately according to their geographical distribution.
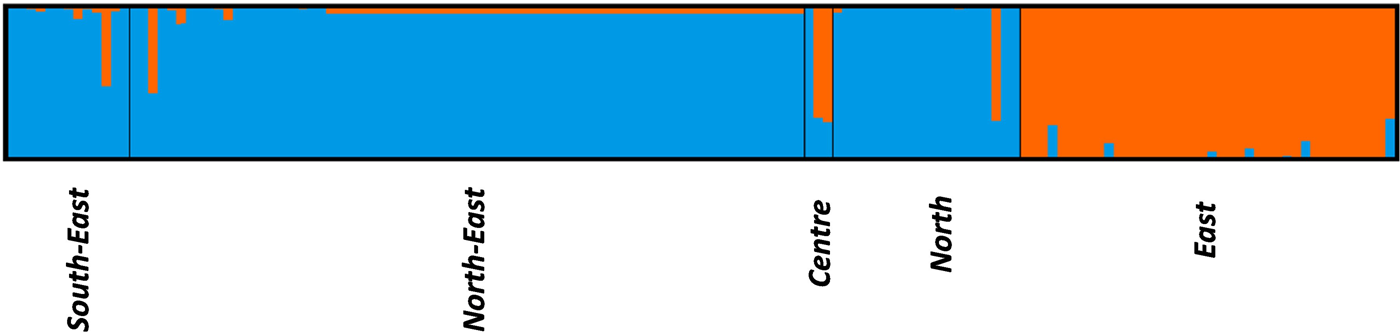
To further test the population structure, a model-based clustering method was run using STRUCTURE (Pritchard et al., Reference Pritchard, Stephens and Donnelly2000; Falush et al., Reference Falush, Stephens and Pritchard2003, Reference Falush, Stephens and Pritchard2007). Without any prior information about the populations, and under an admixed model, the estimate of the likelihood of the data (LnP(D) was the highest when K = 2. For K > 2, LnP(D) increased slightly but plateaued, i.e., ΔK reached its maximum at K = 2, suggesting that all populations fell into one of the two clusters.
The Bayesian analysis indicated the presence of two main gene pools in the entire set of accessions (Fig. 3). The estimated log probability of the data was higher under K = 2 than under K = 1 (−198,721.8 and −247,050.3 respectively).
STRUCTURE analysis of Lagenaria siceraria populations Bar plot showing clustering of individuals by Structure with K = 2. Each colour represents one cluster, each population is represented by a vertical bar, each individual is represented by a single vertical line broken into K coloured segments, with lengths proportional to each of the K inferred clusters.

The results were plotted to evaluate the geographical relationships of the accessions in different genetic clusters.
The blue-coloured gene pool covered all the populations from Centre, North, North-East and South-East whereas the orange-coloured gene pool is constituted only by populations from East. This result corroborated the clustering pattern in the NJ tree.
Discussion
Agronomical characterization
The sampling carried out across the agroecological zones of Côte d'Ivoire has offered the opportunity to collect about 300 accessions of the oleaginous L. siceraria. Among them, 173 were investigated using 9 agromorphological traits. This study revealed a low phenotypic heterogeneity between accessions. Based on seed size, two types of cultivars have been identified by farmers, confirming the results of the previous study by Zoro Bi et al. (Reference Zoro Bi, Koffi, Djè, Malice and Baudoin2006). The cultivar with big seeds is the most abundant (167 accessions). In estimating the relative contribution of the different traits in the overall phenotypic variation among the 173 accessions, the two first PCs explained 71.94% of the diversity captured by the nine selected traits. The variability explained by the first PC (49.25%) was mainly due to variations in the size of fruits and seeds. In the cucurbit family, the significant contribution of fruit and seed traits to morphological variability has been reported for watermelon (Koffi et al., Reference Koffi, Anzara, Malice, Djè, Bertin, Baudoin and Zoro Bi2009; Velazquez-Rosas et al., Reference Velazquez-Rosas, Ruiz-Guerra, Sanchez-Coronado, De Buen and Orozco-Segovia2017). Despite the high variability (>70%) explained by the two first PCs, the separation between the cultivars is not yet evident.
The low distinction between cultivars could be explained by the mass selection practiced by farmers, which is based on a small number of traits of interest and particularly focused on the seed size. In fact, to maximize yield under drought conditions, farmers select the largest seeds, which are heavy and also easy to peel (Gildemacher et al., Reference Gildemacher, Schulte-Geldermann, Borus, Demo, Kinyae, Mundia and SP2011; Haque et al., Reference Haque, Elazegui, Taher Mia, Kamal and Manjurul Haque2012). Since seed is the most vital and crucial input for crop production; if one wants to increase productivity without adding appreciably to the extent of land under cultivation, the best way is to plant a quality seed.
In addition, during planting periods, large seeds are preferred because they are more convenient for manual seeding. Throughout years of successive cultures, this practice has led to the separation of the different forms of seeds. The influence of human selection on the differentiation of taxa, varieties or cultivars has also been reported (Nicolaï et al., Reference Nicolaï, Cantet, Lefebvre, Sage-Palloix and Palloix2013; Fugère and Hendry, Reference Fugère and Hendry2018) in other Lagenaria species (L. siceraria) by Sivaraj and Pandravada (Reference Sivaraj and Pandravada2005) and in cassava by Emperaire et al. (Reference Emperaire, Gilda, Fleury, Robert, Mckey and Pujol2003). The low phenotypic heterogeneity between the accessions collected could be explained by the fact that there is a significant exchange of seeds between the actors of the crop value chain in Côte d'Ivoire involved in the production, marketing and consumption. Fruits and seeds are selected to constitute planting material for the next season. Besides, part of the harvest is sold, contributing to the movement of seeds between regions (Koffi et al., Reference Koffi, Anzara, Malice, Djè, Bertin, Baudoin and Zoro Bi2009).
In sub-Saharan Africa in general, seed exchange is very frequent because of family or ethnic ties, or simply because of the desire to test new varieties, and therefore contributes significantly to varietal selection (Lucchin et al., Reference Lucchin, Barcassia and Parrini2003; Barro-Kondombo et al., Reference Barro-Kondombo, Brocke, Chantereau, Sagnard and Zongo2008). Montes-Hernandez and Eguiarte (Reference Montes-Hernandez and Eguiarte2002) also reported that human activities, including regular and frequent exchanges between farmers, contribute to the modification of the genetic variability of cultivated species. Each population does not evolve in isolation from others, thus forming a kind of metapopulation within which some populations have more similar agromorphological characteristics than others (Bellon et al., Reference Bellon, Berthaud, Smale and Aguirre2003; Pressoir and Berthaud, Reference Pressoir and Berthaud2004). This practice contributes to increased gene flow and allows for the conservation of global genetic diversity.
A usually strong positive correlation between fruit weight and the number of seeds was observed in this study. The same positive correlation was also reported in watermelon (Goré Bi et al., Reference Goré Bi, Baudoin and Zoro Bi2011; Goré Bi et al., Reference Goré Bi, Koffi, Baudoin and Zoro Bi2012), Cucurbita moschata (Ferriol et al., Reference Ferriol, Pico, de Cordova and Nuez2004), Cucumeropsis mannii (Koffi et al., Reference Koffi, Gbotto, Malice, Djè, Bertin, Baudoin and Zoro Bi2008) and L. siceraria (Koffi et al., Reference Koffi, Anzara, Malice, Djè, Bertin, Baudoin and Zoro Bi2009; Yao et al., Reference Yao, Koffi, Ondo-Azi, Baudoin and Zoro Bi2015; Yetişir and Aydin, Reference Yetişir and Aydin2019). Therefore, the fruit weight of L. siceraria could be used as a good criterion to select individuals with a higher number of seeds. This result is also congruent with findings by Achigan-Dako et al. (Reference Achigan-Dako, Fanou, Kouke, Avohou, Vodouhe and Ahanchede2006).
Discriminant factor analysis revealed a clear separation of groups from the hierarchical ascending classification. This result confirms the weak phenotypic diversity observed in the field. This might suggest that all the accessions analysed in this study belong to a single or very few gene pools in which two types of cultivars, according to farmer selection and classification, are found. It thus appears that the deliberate and prolonged human selection, of particular characteristics, was clearly made without any regard to geographical origin (Mladenovic et al., Reference Mladenovic, Berenji, Ognjanov, Ljubojevic and Cukanovic2012). The groups obtained in this study could be good candidates of choice for accessions to be included in a core collection. However, agromorphological traits alone being not enough to capture the maximum diversity and make a final decision for the establishment of a core collection, the use of molecular markers is important (Burgos et al., Reference Burgos, Thompson, Giordano and Tomas2018).
AFLP markers variability
Estimation of the efficiency of AFLP markers
One hundred and seventy-three accessions were screened using AFLP markers. A high number of polymorphisms per primer were detected among accessions. None of the primer combinations showed monomorphic bands, suggesting a wide genetic variation between indigenous landraces of bottle gourd. A similar trend was observed in previous investigations reported by Ram et al. (Reference Ram, Sharma and Jaiswal2006) of five bottle gourd (L. siceraria) germplasms using six RAPD primers. These results also indicated high polymorphism in bottle gourd landraces. Using three SSR markers, Gbotto et al. (Reference Gbotto, Koffi, Baudoin and Zoro Bi2015) also found a high level of polymorphism even though the survey was limited by the number of markers tested.
Among the amplified fragments recorded, 82.7 to 100% were polymorphic among the 148 genotypes examined. These results indicate that the ability to detect polymorphism in bottle gourd germplasm is substantially greater with AFLPs as compared to isozyme (Zamir et al., Reference Zamir, Navot and Rudich1984; Navot and Zamir, Reference Navot and Zamir1987; Biles et al., Reference Biles, Martyn and Wilson1989; Koffi et al., Reference Koffi, Anzara, Malice, Djè, Bertin, Baudoin and Zoro Bi2009), RAPD (Hashizume et al., Reference Hashizume, Sato and Hirai1993; Lee et al., Reference Lee, Shin, Park and Hong1996; Levi et al., Reference Levi, Thomas, Keinath and Wehner2001), SSR (Gbotto et al., Reference Gbotto, Koffi, Baudoin and Zoro Bi2015) reported in previous studies investigating L. siceraria or another cucurbit species. Koffi et al. (Reference Koffi, Anzara, Malice, Djè, Bertin, Baudoin and Zoro Bi2009) found that the four allozyme markers used in their study were not powerful enough to capture the genetic basis of 30 germplasm accessions of L. siceraria. Using 14 random primers to differentiate 39 accessions, (Lee et al., Reference Lee, Shin, Park and Hong1996) found that several genotypes could not be distinguished from one or more other genotypes despite the relatively high (21%) polymorphism of RAPD detected. Similarly, 30 accessions could not be differentiated based on SSR (Gbotto et al., Reference Gbotto, Koffi, Baudoin and Zoro Bi2015). From the fourteen primer pairs tested in that study, only three were polymorphic. In contrast, the AFLP profiles were able to distinguish among all cultivars tested.
Genetic structure
A significantly low level (28%) of genetic differentiation among populations was found. The estimated genetic variation was 72% (AMOVA, P = 0.001). Gbotto et al. (Reference Gbotto, Koffi, Baudoin and Zoro Bi2015) reported the same trends (31 and 61% among and within populations, respectively) in 30 populations of L. siceraria oleaginous using SSR markers. The accession genetic structure observed in this study was also similar to that reported in a previous study (Mujaju et al., Reference Mujaju, Sehic, Werlemark, Garkava-Gustavsson, Fatih and Nybom2010) using nine SSR markers (10.8 and 89.2% among and within populations, respectively) and ten RAPD (43.7 and 56.3% among and within populations, respectively). Performing AMOVA within and among seven accessions of watermelon divided the accessions into two major groups (cow-melons and sweet watermelons). The authors demonstrated that only 0.8% of the total variation resided between the two groups, 10% between accessions within groups and 89.2% within accessions. However, the results of this study were different from the findings by Minsart et al. (Reference Minsart, Zoro, Dje, Baudoin, Jacquemart and Bertin2011), as they obtained higher variation (88%) among the three accessions of C. lanatus and lower variation (12%) within them. Differences in the two statistics could be attributed to the difference between the sampling schemes adopted. For the present study, we selected five seeds per accession and a relatively high number of accessions (148) while in the study conducted by Minsart et al. (Reference Minsart, Zoro, Dje, Baudoin, Jacquemart and Bertin2011), 20 seeds were randomly chosen per accession for only three accessions. We also used AFLP markers which are much more robust for variety discrimination (Nimmakayala et al., Reference Nimmakayala, Tomason, Jeong, Ponniah, Karunathilake, Levi, Perumal and Reddy2009) as opposed to the SSR markers used by Minsart et al. (Reference Minsart, Zoro, Dje, Baudoin, Jacquemart and Bertin2011). Such contrasted sampling schemes and the difference in marker systems used should have resulted in inverted trends in the genetic structure of the accessions as revealed by the AMOVA. Sampling more accessions should make the genetic parameters estimated in the present study more representative of the plant material examined compared to those obtained by Minsart et al. (Reference Minsart, Zoro, Dje, Baudoin, Jacquemart and Bertin2011). Overall, results from the genetic structure showed that L. siceraria maintained a high level of variability within cultivars in accordance with its mating system, coupled with farmer's seed management approaches. Indeed, at the collecting sites, seeds are usually saved from the previous harvest seasons, or obtained from neighbouring farmers or local markets. This results in the gradual depletion of genetic variability. Similar results have been reported in Cucumeropsis mannii, another oleaginous cucurbit cultivated in Côte d'Ivoire (Koffi et al., Reference Koffi, Gbotto, Malice, Djè, Bertin, Baudoin and Zoro Bi2008).
Cluster and assignment analysis
Generally, genetic distances among bottle gourd genotypes are low, reflecting the initial bottleneck during domestication, which could be modified by the inherent cross-pollinated mechanism in the crop (Montes-Hernandez and Eguiarte, Reference Montes-Hernandez and Eguiarte2002).
In this study, the lowest genetic distance (0.013) was found between the Eastern and South-Eastern parts of the country, implying that those two populations share many similar alleles. This result is confirmed by the low amount of genetic differentiation between them (0.060) and indicates that they are closely related and might have had a recent common ancestor. This result might be due to high gene flow resulting from the farmer-to-farmer seed exchange system practiced by growers, particularly within and between these two neighbouring regions. The same phenomenon was observed in North-Eastern and Eastern parts of Côte d'Ivoire, which are also neighbouring regions, showing a low genetic distance of 0.015 probably for the same reasons.
On the other hand, the highest genetic distance (0.173) was observed between the Centre and North, as well as between the Centre and South-East (0.150), indicating that those two pairs of populations are much more differentiated (0.382 and 0.339, respectively). However, these regions are also neighbouring regions and therefore not geographically far. Founder effects followed by assertive mating, i.e., the original introduction of only limited genetic diversity within fruit types, followed by matings mostly within fruit types, would lead to the patterns of genetic structure observed.
A dendrogram established based on AFLP genotyping of the 148 accessions pinpointed clustering based on geographical location. While no significant grouping pattern was observed based on cultivars in Cluster I, in Cluster II, all accessions were characterized by the absence of a cap on the distal side of seeds. This result supports findings by Gbotto et al. (Reference Gbotto, Koffi, Baudoin and Zoro Bi2015). However, according to the study by Koffi et al. (Reference Koffi, Anzara, Malice, Djè, Bertin, Baudoin and Zoro Bi2009), the UPGMA cluster analysis of morphological differentiation among cultivars of L. siceraria showed that the two cultivars were distinctly clustered. Consistent with the finding by Uluturk et al. (Reference Uluturk, Frary and Doganlar2011), morphological and molecular genetic diversity are distinct factors and must be considered separately in germplasm characterization. This is especially important for crops like cucurbits which are believed to have limited molecular genetic diversity.
The population structure pattern derived from Bayesian clustering analysis was identical to the splitting in the neighbour-joining clustering analysis and revealed two gene pools each characterizing a single geographical location. By analysing the accessions from the North-East, we detected two pools. This could suggest, by comparing the population structure pattern and the neighbour-joining tree, that the two gene pools are driven by the populations from the North-East and North. However, as far as we know, and given that the aforementioned two approaches of population structure analysis are different, the two gene pools are only due to the population from the North-East itself. This result indicates that besides forces such as exchange of genetic stock, genetic drift, spontaneous variation, natural and artificial selection, the geographical origin can largely influence the aforementioned phenomena and constitute the main driver for genetic variability and diversity (Wang et al., Reference Wang, Zhang, Liu, Lin, Liu, Peng, Lin, Huang and Luo2014).
Implications in establishing a core collection
The analysis of morphological traits is the first step in genetic diversity estimate. However, this analysis shows some deficiencies since the gene's expression can be affected by the environment. Therefore, it's not possible to make a definitive decision while building a core collection.
An assessment of genetic diversity based only on morpho-agronomic traits might be biased, because distinct morphotypes can result from only a few mutations while they share a common genetic base. Thus, molecular markers are needed to complement genetic diversity based on morpho-agronomic traits and to be used to build core collections as a foundation for genebank management, future breeding work and inheritance studies.
The mating system of the target plant was in agreement with the level of genetic diversity found within accessions and cultivars. These results also suggested that the studied accessions can be considered as potential sources of a genetic bank for ex situ conservation. Some more analysis of the genetic structure of L. siceraria accessions will help to get a clear understanding of the genetic diversity in order to understand the morphological diversity that do exist among fruits and seeds.
Comparing results from the analysis of agromorphological and molecular marker data will contribute to reflections on the best way to build a core collection from the University of Nangui Abrogoua germplasm collection. The Bayesian analysis indicated the presence of two main gene pools, both harboured by accessions from North-East. Overall, this result suggests that the highest number of individuals to constitute the core collection should be drawn from North-Eastern part of Côte d'Ivoire when building the core collection.
The next step of the current research is to build a core collection which will be an entry point to the proper exploitation of the genetic resources available in the indigenous L. siceraria gene bank maintained by the University of Nangui Abrogoua (Abidjan, Côte d'Ivoire). Germplasm utilization in such a core subset for crop improvement will undoubtedly be efficient for African oilseed bottle gourd breeders. The final outcomes of this work represent a key contribution to the food security and to alleviate poverty of rural women who are the main producers of the target species in Sub Saharan Africa and specifically in Côte d'Ivoire.
Supplementary material
The supplementary material for this article can be found at https://doi.org/10.1017/S1479262122000247.
Acknowledgements
The study was supported by the BecA-ILRI Hub, Nairobi, Kenya through the Africa Biosciences Challenge Fund (ABCF) programme, the “Direction Générale de la Coopération au Développement” (DGCD, Brussels, Belgium), the “Commission Universitaire pour le Développement” (CUD, Brussels, Belgium) and the International Foundation for Science. The ABCF Program is funded by the Australian Department for Foreign Affairs and Trade (DFAT) through the BecA-CSIRO partnership; the Syngenta Foundation for Sustainable Agriculture (SFSA); the Bill & Melinda Gates Foundation (BMGF); the UK Department for International Development (DFID) and; the Swedish International Development Cooperation Agency (Sida). The authors would like to express their heartlet gratitude to Helen Altshul for her assistance in language proof reading.