Introduction
Patients with major depressive disorder (MDD) vary substantially in illness course and treatment response. Recognition of this variation has led researchers to search for depression subtypes defined by distinctions assessed at the beginning of treatment, such as supposed causes (e.g. postnatal depression; Cooper & Murray, Reference Cooper and Murray1995; Cooper et al. Reference Cooper, Jones, Dunn, Forty, Haque, Oyebode, Craddock and Jones2007), clinical presentation (e.g. atypical or melancholic depression; Fink et al. Reference Fink, Rush, Knapp, Rasmussen, Mueller, Rummans, O'Connor, Husain, Biggs, Bailine and Kellner2007; Uher et al. Reference Uher, Dernovsek, Mors, Hauser, Souery, Zobel, Maier, Henigsberg, Kalember, Rietschel, Placentino, Mendlewicz, Aitchison, McGuffin and Farmer2011) and empirically derived (e.g. factor analysis, latent class analysis) symptom profiles (Lamers et al. Reference Lamers, Burstein, He, Avenevoli, Angst and Merikangas2012; Vrieze et al. Reference Vrieze, Demyttenaere, Bruffaerts, Hermans, Pizzagalli, Sienaert, Hompes, de Boer, Schmidt and Claes2014), in anticipation that these subtypes would tap into underlying psychopathological processes that predict treatment response or course of illness (Carragher et al. Reference Carragher, Adamson, Bunting and McCann2009; Baumeister & Parker, Reference Baumeister and Parker2012).
Although some promising results have emerged regarding significant associations of baseline biomarkers (e.g. Pizzagalli, Reference Pizzagalli2011) and psychosocial variables (e.g. Candrian et al. Reference Candrian, Farabaugh, Pizzagalli, Baer and Fava2007) with depression treatment response, subtyping distinctions based on empirically derived symptom profiles have been disappointing because of profile instability (Hasler & Northoff, Reference Hasler and Northoff2011; Baumeister & Parker, Reference Baumeister and Parker2012; van Loo et al. Reference van Loo, de Jonge, Romeijn, Kessler and Schoevers2012). However, an alternative approach to symptom-based subtyping, given the desire to predict treatment response and course of illness, would be to define subtypes using recursive partitioning (Strobl et al. Reference Strobl, Malley and Tutz2009; Zhang & Singer, Reference Zhang and Singer2010) and related machine learning methods (van der Laan & Rose, Reference van der Laan and Rose2011; James et al. Reference James, Witten, Hastie and Tibshirani2013) that search for synergistic associations of baseline measures with subsequent outcomes.
The latter methods have been useful in discovering stable synergistic predictors of clinical outcomes in others areas of medicine (Chang et al. Reference Chang, Chen, Chung and Lai2012; Chao et al. Reference Chao, Koyfman, Woody, Angelov, Soeder, Reddy, Rybicki, Djemil and Suh2012). However, other than small studies of depression treatment response (Andreescu et al. Reference Andreescu, Mulsant, Houck, Whyte, Mazumdar, Dombrovski, Pollock and Reynolds2008; Rabinoff et al. Reference Rabinoff, Kitchen, Cook and Leuchter2011; Riedel et al. Reference Riedel, Moller, Obermeier, Adli, Bauer, Kronmuller, Brieger, Laux, Bender, Heuser, Zeiler, Gaebel, Schennach-Wolff, Henkel and Seemuller2011; Nelson et al. Reference Nelson, Zhang, Deberdt, Marangell, Karamustafalioglu and Lipkovich2012; Jain et al. Reference Jain, Hunter, Brooks and Leuchter2013), we are aware of only one previous study using machine learning to search for depression subtypes in predicting course of illness. That study, by van Loo et al. (Reference van Loo, Cai, Gruber, Li, de Jonge, Petukhova, Rose, Sampson, Schoevers, Wardenaar, Wilcox, Al-Hamzawi, Andrade, Bromet, Bunting, Fayyad, Florescu, Gureje, Hu, Huang, Levinson, Medina-Mora, Nakane, Posada-Villa, Scott, Xavier, Zarkov and Kessler2014), analyzed retrospectively reported data on associations of DSM-IV MDD symptoms in incident episodes with four measures of long-term illness persistence/severity in a sample of 8261 respondents with lifetime MDD in the World Health Organization (WHO) World Mental Health (WMH) Surveys. Significant subtyping distinctions were found based on the conjunction of child/adolescent onset, suicidality, and symptoms of anxiety occurring during incident depressive episodes. Respondents in the high-risk cluster (less than one-third of respondents) accounted for 53–71% of high persistence/severity.
The predictors in the van Loo analysis were limited, however, to variables characterizing incident episode symptoms. A question can be raised about whether an expanded set of predictors might improve subtyping accuracy. In particular, information about prior lifetime co-morbidities might be especially valuable given that van Loo et al. (Reference van Loo, Cai, Gruber, Li, de Jonge, Petukhova, Rose, Sampson, Schoevers, Wardenaar, Wilcox, Al-Hamzawi, Andrade, Bromet, Bunting, Fayyad, Florescu, Gureje, Hu, Huang, Levinson, Medina-Mora, Nakane, Posada-Villa, Scott, Xavier, Zarkov and Kessler2014) found symptoms of anxiety to be powerful predictors of illness course and that evidence exists in the larger literature that co-morbidity is related to the course of MDD (Steinert et al. Reference Steinert, Hofmann, Kruse and Leichsenring2014). The current report presents an expanded WMH analysis evaluating whether information about temporally primary co-morbid disorders improves on the van Loo results.
Method
Sample
The WMH surveys are well-characterized epidemiological surveys of prevalence and correlates of commonly occurring mental disorders (Kessler & Üstün, Reference Kessler and Üstün2008; Von Korff et al. Reference Von Korff, Scott and Gureje2009; Nock et al. Reference Nock, Borges and Ono2012; Alonso et al. Reference Alonso, Chatterji and He2013) administered in six countries classified by the World Bank (2009) as high income (Israel, Japan, New Zealand, Northern Ireland, Portugal, USA), five upper-middle income (Brazil, Bulgaria, Lebanon, Mexico, Romania) and five low/lower-middle income (Colombia, Iraq, Nigeria, People's Republic of China, Ukraine). Most surveys featured nationally representative household samples, whereas two (Colombia, Mexico) were representative of all urban areas in the country, one of selected states (Nigeria) and three of selected metropolitan areas (Brazil, Japan, People's Republic of China). A total of 93 167 adults (age ⩾18 years) participated. Sample sizes ranged from 2357 (Romania) to 12 790 (New Zealand). Informed consent was obtained using procedures approved by local Institutional Review Boards. The average weighted response rate was 73.7% (range 55.1–96.2%). Weights were used to adjust for differential probabilities of selection and discrepancies with population sociodemographic/geographic distributions. Further details about WMH sampling and weighting are available elsewhere (Heeringa et al. Reference Heeringa, Wells, Hubbard, Mneimneh, Chiu, Sampson, Berglund, Kessler and Üstün2008). The subsample considered here includes 8261 WMH respondents who met lifetime DSM-IV criteria for MDD. More detailed information on the descriptive characteristics of the sample is presented by van Loo et al. (Reference van Loo, Cai, Gruber, Li, de Jonge, Petukhova, Rose, Sampson, Schoevers, Wardenaar, Wilcox, Al-Hamzawi, Andrade, Bromet, Bunting, Fayyad, Florescu, Gureje, Hu, Huang, Levinson, Medina-Mora, Nakane, Posada-Villa, Scott, Xavier, Zarkov and Kessler2014).
Measures
MDD
DSM-IV MDD was assessed with the Composite International Diagnostic Interview (CIDI), Version 3.0 (Kessler & Üstün, Reference Kessler and Üstün2004), a fully structured diagnostic interview administered by trained lay interviewers. The CIDI translation, back-translation and harmonization protocol required culturally competent bilingual clinicians in participating countries to review, modify and approve key phrases describing symptoms (Harkness et al. Reference Harkness, Pennell, Villar, Gebler, Aguilar-Gaxiola, Bilgen, Kessler and Üstün2008). Standardized procedures for interviewer training and quality control were used (Pennell et al. Reference Pennell, Mneimneh, Bowers, Chardoul, Wells, Viana, Dinkelmann, Gebler, Florescu, He, Huang, Tomov, Vilagut, Kessler and Üstün2008). The likelihood ratio positive (LR+; the relative proportions of clinical cases among respondents screened positive versus others) was 8.8, which is close to the 10.0 level typically considered definitive for ruling in clinical diagnoses from fully structured approximations (Altman et al. Reference Altman, Machin, Bryant and Gardner2000).
Respondents with lifetime DSM-IV/CIDI MDD were asked retrospective questions about age of onset (AOO), whether their first lifetime depressive episode ‘was brought on by some stressful experience’ or happened ‘out of the blue’, all DSM-IV Criteria A–D major depressive episode (MDE) symptoms for the index episode (including separate questions about irritability, weight loss and weight gain, insomnia and hypersomnia, psychomotor agitation and retardation, and about thoughts of death, suicide ideation, suicide plans and suicide gestures/attempts), ICD-10 severity specifiers, questions to operationalize diagnostic hierarchy rule exclusions, and questions about marker symptoms of (i) a mixed episode (sleep much less than usual and still not feel tired; racing thoughts) and (ii) anxious depression (feeling nervous/anxious/worried; having sudden attacks of intense fear or panic). We also included in the initial subtyping analysis a dichotomous measure of whether either of the respondent's parents had a history of major depression based on respondent reports in the Family History Research Diagnostic Criteria Interview (Endicott et al. Reference Endicott, Andreasen and Spitzer1978).
Four retrospective questions were asked about subsequent lifetime MDD persistence/severity: number of years since AOO when the respondent had an episode (i) lasting 2 weeks or longer (referred to here as ‘persistence’) or (ii) lasting most days throughout the year (referred to here as ‘chronicity’); (iii) whether the respondent was ever hospitalized for depression and, if so, the age of first occurrence (referred to here as ‘hospitalization’); and (iv) whether the respondent was currently (at the time of interview) sufficiently disabled because of their depression that they were either unable to work or had a limitation of at least 50% in the ability to perform paid work (referred to here as ‘disability’). These are the four outcomes considered here. The persistence and chronicity measures were divided by the number of years between age at interview (AAI) and AOO to create continuous outcomes in the range 0–100%, whereas hospitalization and disability were treated as dichotomies.
Prior history of other DSM-IV/CIDI disorders
The CIDI assessed 14 other lifetime DSM-IV disorders, including three other distress disorders (generalized anxiety disorder, post-traumatic stress disorder, obsessive–compulsive disorder), five fear disorders (separation anxiety disorder, specific phobia, social phobia, panic disorder, agoraphobia) and six externalizing disorders [attention-deficit/hyperactivity disorder, intermittent explosive disorder, oppositional-defiant disorder, conduct disorder, substance (alcohol or drug) abuse with or without dependence, and substance dependence with abuse]. AOO of each disorder was assessed using special probing techniques shown experimentally to improve recall accuracy (Knäuper et al. Reference Knäuper, Cannell, Schwarz, Bruce and Kessler1999).
DSM-IV organic exclusion rules and diagnostic hierarchy rules among the disorders assessed were used in making diagnoses other than for oppositional-defiant disorder, which was defined with or without conduct disorder, and substance abuse, which was defined with or without dependence. As detailed elsewhere (Haro et al. Reference Haro, Arbabzadeh-Bouchez, Brugha, de Girolamo, Guyer, Jin, Lepine, Mazzi, Reneses, Vilagut, Sampson and Kessler2006), good concordance was found in general between these diagnoses based on the CIDI and blinded clinical diagnoses based on reappraisal interviews with the Structured Clinical Interview for DSM-IV (First et al. Reference First, Spitzer, Gibbon and Williams2002).
We considered not only the 14 disorders themselves but also aggregated combinations and disaggregated subsets in predicting the course of MDD. The aggregated combinations included nested dichotomous measures of numbers of distress disorders (⩾1 and ⩾2), fear disorders (⩾1, ⩾2 and ⩾3) and externalizing disorders (⩾1, ⩾2 and ⩾3). The disaggregated subsets included child/adolescent-onset versus adult-onset cases, where child/adolescent onset was defined as AOO ⩽18 years of age. Given differences in the AOO distributions of mental disorders (Kessler et al. Reference Kessler, Amminger, Aguilar-Gaxiola, Alonso, Lee and Ustun2007), the proportion of cases with child/adolescent versus adult onsets varies across disorders.
Analysis methods
We followed van Loo et al. (Reference van Loo, Cai, Gruber, Li, de Jonge, Petukhova, Rose, Sampson, Schoevers, Wardenaar, Wilcox, Al-Hamzawi, Andrade, Bromet, Bunting, Fayyad, Florescu, Gureje, Hu, Huang, Levinson, Medina-Mora, Nakane, Posada-Villa, Scott, Xavier, Zarkov and Kessler2014) in predicting persistence and chronicity in the subsamples of respondents, where AAI/AOO was either ⩾10 years (chronicity) or ⩾15 years (persistence) based on preliminary inspection carried out by van Loo showing that outcome scores stabilized after these cut-points. The chronicity and persistence models both used a Poisson link function. Proportional hazards survival analysis was used, in comparison, to predict first hospitalization among respondents who were not hospitalized at AOO. Finally, logistic regression analysis was used to predict current disability in the total sample. The sample size used to predict the four outcomes varied widely because of these differences in the sample. Only the 2869 respondents with first onset of depression ⩾15 years prior to interview were included in the persistence analysis. Only the 3958 respondents who had a first onset of depression ⩾10 years prior to interview were included in the chronicity analysis. Only the 6465 respondents who were not hospitalized in conjunction with their incident episode of depression were included in the analysis of subsequent first hospitalization. By contrast, all 8261 respondents were included in the analysis of current disability.
The analyses were carried out in two steps designed to generate optimal prediction equations for the outcomes using several different machine learning search methods. In the first step, regression trees were estimated to find important interactions among the temporally primary co-morbid disorders and between these disorders and the symptoms of MDD in incident episodes. The WMH weights were used in generating these trees. To minimize risk of overfitting, 100 trees were estimated, each in a separate bootstrapped pseudo-sample (Hastie et al. Reference Hastie, Tibshirani and Friedman2009; Strobl et al. Reference Strobl, Malley and Tutz2009; Zhang & Singer, Reference Zhang and Singer2010). The R-package rpart (Thernau et al. Reference Thernau, Atkinson and Ripley2012) was used for this purpose. Inspection of the frequencies with which unique terminal interactions (i.e. subsamples defined by the conjunction of the dichotomous predictors selected to optimize prediction of the outcome) occurred across the 100 trees was inspected, and further analysis was limited to the subset of interactions that appeared in at least 10% of trees.
In the second step, a separate dummy variable for each temporally primary co-morbid disorder, a dummy predictor for each of the terminal interactions found in 10% or more of trees, and an offset term for the predicted values of the outcome from the models estimated in the earlier analysis by van Loo et al. (Reference van Loo, Cai, Gruber, Li, de Jonge, Petukhova, Rose, Sampson, Schoevers, Wardenaar, Wilcox, Al-Hamzawi, Andrade, Bromet, Bunting, Fayyad, Florescu, Gureje, Hu, Huang, Levinson, Medina-Mora, Nakane, Posada-Villa, Scott, Xavier, Zarkov and Kessler2014) were used to predict each outcome in multiple regression analyses. The central difficulty in estimating second-step models was that the predictors were highly intercorrelated, leading to coefficient instability when all predictors were included in a single equation. The classic way to address this problem is with stepwise regression (Draper & Smith, Reference Draper and Smith1981), but this method overfits and performs poorly when used to predict in new samples (Berk, Reference Berk2003). Several machine learning methods have been developed to improve on stepwise regression. We used one of these methods: penalized regression. This method trades off a certain amount of bias to reduce overfitting by shrinking coefficients (either constraining the sum of absolute values and/or the variances of non-zero standardized regression coefficients in the equations) by including fixed values of the penalties as constants and estimating model parameters under the constraints of these penalties (Berk, Reference Berk2008).
Three different penalized regression models were used in our analysis. These three differ in the mixing parameter penalties (MPPs) used in estimation. One of these three was the lasso penalty (MPP = 1), which favors a sparse model that forces coefficients for all but one predictor in each strongly correlated set to zero. A second was the ridge penalty (MPP = 0), which uses proportional coefficient shrinkage to retain all predictors in the model. The third was the elastic net penalty, which uses simulation to vary MPP in the range 0.0–1.0 to select a penalty value with the best cross-validated fit (Zou & Hastie, Reference Zou and Hastie2005). The R-package glmnet (Friedman et al. Reference Friedman, Hastie and Tibshirani2010) was used to estimate all the penalized regression models; glmnet implemented external 10-fold cross-validation to select the MPP yielding the best overall model fit. Internal cross-validation was then used to select the coefficient in front of the penalty. This means that, rather than choosing the predictors to retain by setting an entry or exit p value as in stepwise regression, simulation is used to select coefficients to maximize overall model fit under the penalty in cross-validation. Coefficients were exponentiated to create incidence density ratios (IDRs) for predictors of persistence and chronicity, hazard ratios (HRs) for predictors of hospitalization, and odds ratios (ORs) for predictors of disability.
The coefficients in the three penalized regression models were then used to generate predicted values for each outcome for each respondent. Importantly, these predicted values were generated for all 8261 respondents even though three of the four equations were estimated using subsamples based on the idea that we wanted to predict the likelihood that each respondent would eventually have each outcome regardless of how long ago the respondent had a first depressive episode.
Inspection of a correlation matrix among the predicted values in the total sample documented high correlations, suggesting that the predicted values could be combined to develop a summary measure of risk across all outcomes. This was done by transforming the predicted values from each equation to percentiles and using these transformed scores as input to k-means cluster analysis. This clustering partitioned the sample into subtypes with similar multivariate profiles of predicted scores across outcomes. The R-package stats (R Core Team, 2013) was used for this purpose, with 100 random starts generated for each number of clusters to avoid local minimization problems.
Inspection of observed (as opposed to predicted) mean dichotomized outcome scores across clusters was used to determine the optimal number of clusters to retain in predicting the outcomes based on the area under the receiver operating characteristic curve (AUC; the proportion of times a randomly selected respondent with the outcome and a randomly selected respondent without the outcome could be differentiated correctly by cluster membership). Once this optimal number of clusters was determined, operating characteristics of a dichotomous screening scale that distinguished respondents in the cluster with the highest risk of the outcomes from other respondents were calculated for each outcome. Included here were measures of sensitivity (SENS; the percentage of all respondents with the adverse outcome who were in the high-risk cluster), positive predictive value (PPV; risk of the adverse outcome among respondents in the high-risk cluster) and LR+ (relative proportions of cases in the high-risk cluster versus other clusters having the adverse outcomes).
All analyses used the WMH weights to adjust for differential probabilities of selection in generating samples. All prediction equations additionally included dummy predictor variables for country to adjust for between-country differences in outcomes. The effects of weights but not geographic clustering were taken into consideration in cross-validations. Standard errors of operating characteristics were estimated using the design-based Taylor series linearization method (Wolter, Reference Wolter1985), which accounted for the effects of both weights and clustering, using the R-package survey (Lumley, Reference Lumley2004).
Results
Machine learning models
The only terminal interactions emerging repeatedly in regression trees involved number of fear disorders without regard to AOO. Nested dichotomies for number of fear disorders (⩾1, ⩾2, ⩾3) were consequently included as dummy predictor variables in the penalized regression analyses. The best-fitting penalized regression model for each outcome was an elastic net with MPP = 0.1. This means that the coefficients are especially hazardous to interpret because many highly correlated predictors remain in the model with proportional coefficient shrinkage to maximize overall model fit at the expense of interpretability of individual coefficients. Nonetheless, as individual-level predicted values are very similar in the sparser lasso model compared to the optimal elastic net model across outcomes (r = 0.78–0.98), it is possible to inspect lasso coefficients to obtain some sense of predictor importance.
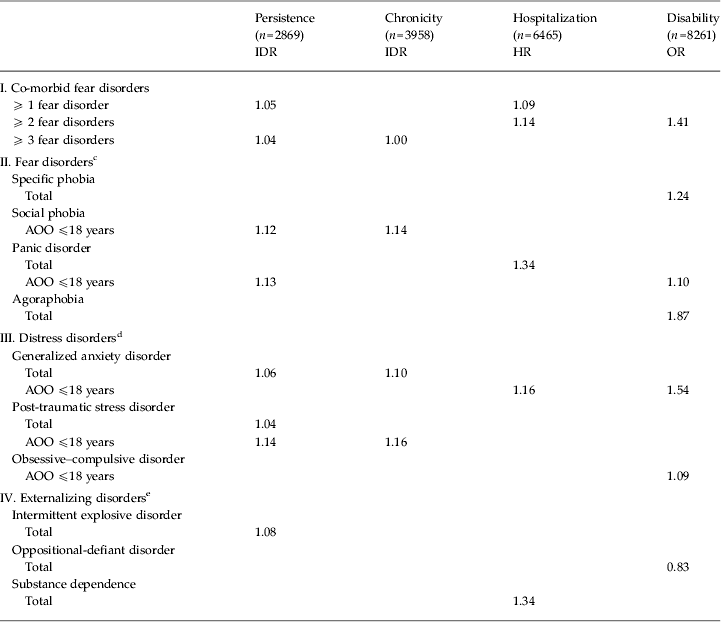
All but one of the 22 predictors retained under the lasso penalty across outcomes had positive coefficients, indicating increased persistence/severity associated with prior disorders (Table 1). The proportion of retained coefficients was highest for the fear disorder interactions (42%; 5/12), next highest for the distress disorders (33%; 8/24), next highest for individual fear disorders (15%; 6/40), and lowest for externalizing disorders (6%; 2/48 positive associations, 1/48 negative associations). The five retained predictors of hospitalization had HRs in the range 1.09–1.34. The five positive retained predictors of disability had ORs in the range 1.09–1.84. The one negative predictor had an OR of 0.83. The seven retained predictors of persistence had IDRs in the range 1.03–1.14. The three retained predictors of chronicity had IDRs in the range 1.10–1.16. The relatively modest size of these coefficients reflects strong intercorrelations among retained predictors.
Lasso penalized regression coefficients to predict subsequent adverse MDD outcomes based on incident episode characteristics a and co-morbidity prior to the first depressive episode b

MDD, Major depressive disorder; IDR, incidence density ratio; HR, hazard ratio; OR, odds ratio; AOO, age of onset.
a Predicted values based on MDD episode characteristics were used as an offset in the models. The following variables were previously found to be important and used to compute the offset scores: incident episode symptoms of severe dysphoria, anhedonia, weight loss, weight gain, insomnia, hypersomnia, psychomotor agitation, psychomotor retardation, suicidality, inability to cope, panic, irritability, racing thoughts, high energy, endogenous onset, parental history of depression; interactions involving AOO < 19 years and suicidality, AOO < 19 years and anxiety symptoms (panic, worry or irritability), AOO < 35 years and suicidality and anxiety.
b Coefficients based on 10-fold cross-validation with a lasso penalty. The link functions were Poisson for persistence and chronicity, Cox proportional hazards for hospitalization, and logistic for disability. No confidence intervals are reported because standard errors of such simulated models are biased. Retained coefficients were selected based on evidence in cross-validation that the predictors improved overall model fit rather than that coefficients fell outside of a prespecified confidence interval.
c The initial predictor set also included separation anxiety disorder (both total and with AOO ⩽18 years), specific phobia with AOO ⩽18 years, total social phobia, and agoraphobia with AOO ⩽18 years, but none of these predictors was retained in the lasso penalized regression model for any of the outcomes.
d The initial predictor set also included total obsessive–compulsive disorder but that predictor was not retained in the lasso penalized regression model for any of the outcomes.
e The initial predictor set also included attention-deficit/hyperactivity disorder, intermittent explosive disorder with AOO ⩽18 years, oppositional-defiant disorder with AOO ⩽18 years, conduct disorder (both total and with AOO ⩽18 years), substance abuse (both total and with AOO ⩽18 years), and substance dependence with AOO ⩽18 years, but none of these predictors was retained in the lasso penalized regression model for any of the outcomes.
Cluster analysis
Predicted values of each outcome were calculated for each respondent in the total sample based on the ridge, lasso and optimal elastic net model coefficients. Spearman correlations among these predicted values were in the range 0.76–0.98. Principal axis exploratory factor analysis across outcomes showed that the correlations were consistent with the existence of a single underlying factor (factor loadings in the range 0.77–0.96). (Detailed results are available on request.) Based on these results, k-means cluster analysis of transformed (to percentiles) predicted outcome scores was used to search for empirically derived multivariate clusters defining subtypes with differential outcome risk.
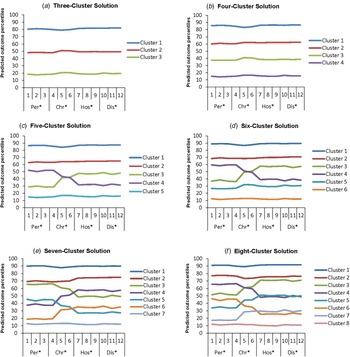
As in the earlier analysis by van Loo et al. (Reference van Loo, Cai, Gruber, Li, de Jonge, Petukhova, Rose, Sampson, Schoevers, Wardenaar, Wilcox, Al-Hamzawi, Andrade, Bromet, Bunting, Fayyad, Florescu, Gureje, Hu, Huang, Levinson, Medina-Mora, Nakane, Posada-Villa, Scott, Xavier, Zarkov and Kessler2014), inspection of mean percentile scores for solutions in the range between three and eight clusters showed that all solutions defined one class that had the highest mean scores on all outcomes, a second class that had the lowest mean scores on all outcomes, and between one and six other classes that had intermediate mean scores on all outcomes (Fig. 1 a–f). Based on this observation, alternative three-cluster solutions were constructed from the original four-cluster to eight-cluster solutions by collapsing the intermediate clusters in each solution. The AUC was then compared for the original three-cluster solution and the alternative collapsed three-cluster solutions to predict dichotomized versions of the outcomes (top 10 percentiles of persistence and chronicity along with yes/no measures of hospitalization and disability). None of the collapsed higher-order cluster solutions had a higher AUC than the original three-cluster solution on any outcomes (0.68 for persistence, 0.62 for chronicity, 0.70 for hospitalization, and 0.73 for disability). The distribution of cluster membership in the three-cluster solution was 32.4% in the high-risk cluster, 35.6% in the intermediate-risk cluster and 32.0% in the low-risk cluster.
Mean predicted outcome scores in the three-cluster to eight-cluster k-means. Per, the percentile-transformed predicted score on the persistence outcome variable in the (1) lasso, (2) ridge and (3) elastic net models; Chr, the percentile-transformed predicted score on the chronicity outcome in the (4) lasso, (5) ridge and (6) elastic net models; Hos, the percentile-transformed cumulative predicted probability of hospitalization in the (7) lasso, (8) ridge and (9) elastic net models; Dis, the percentile-transformed predicted probability of disability in the (10) lasso, (11) ridge and (12) elastic net models. k-means cluster analysis of percentile-transformed predicted scores on the four outcomes for all respondents based on the lasso generalized linear model (GLM).

Associations of cluster membership with course of illness
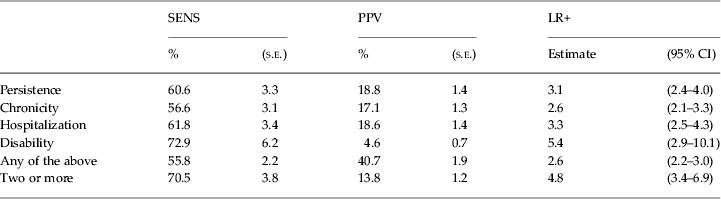
Concentration of risk of adverse outcomes in the high-risk cluster was examined in the subsample of respondents with AAI/AOO of ⩾15 years because, as noted in the section on analysis methods, this was the most restrictive subsample used in the analyses. Cross-tabulations with dichotomized versions of outcomes show that the proportions of all cases with positive scores on the dichotomized outcomes occurring in the high-risk cluster (i.e. estimates of SENS) were 60.6% for persistence, 56.6% for chronicity, 61.8% for hospitalization and 72.9% for disability (Table 2). The high-risk cluster also captured 55.8% of all cases with any of the four adverse outcomes and 70.5% of those with two or more of those outcomes. Between 4.6% (disability) and 18.8% (high persistence) of cases in the high-risk cluster experienced each of the four adverse outcomes (PPV), whereas 40.7% experienced at least one and 13.8% more than one of these outcomes. These proportions were in the range 2.6–5.4 times as high as among cases not classified as being in the high-risk cluster (LR+).
Operating characteristics of the dichotomized distinction between cases in the high-risk cluster versus other cases in predicting course of MDD in the subsample of cases having all outcomes (n = 2435)

MDD, Major depressive disorder; SENS, sensitivity (the percentage of observed adverse outcomes that occurred in the high-risk cluster); PPV, positive predictive value (the percentage of respondents in the high-risk cluster that experienced the adverse outcome); LR+, likelihood ratio positive (the relative proportions of cases in the high-risk cluster versus the remainder of the sample that experienced the adverse outcome); CI, confidence interval; s.e., standard error.
Improvement in prediction when considering co-morbidity
Comparison of the operating characteristics of the high-risk cluster based on the current analysis with the high-risk cluster based on the earlier analysis by van Loo et al. (Reference van Loo, Cai, Gruber, Li, de Jonge, Petukhova, Rose, Sampson, Schoevers, Wardenaar, Wilcox, Al-Hamzawi, Andrade, Bromet, Bunting, Fayyad, Florescu, Gureje, Hu, Huang, Levinson, Medina-Mora, Nakane, Posada-Villa, Scott, Xavier, Zarkov and Kessler2014) allowed assessment of the extent to which prediction improved when we added information about temporally primary co-morbid disorders. (Detailed results are available on request.) Three observations are noteworthy. First, the percentage of respondents classified in the high-risk cluster increased from 31.2% to 32.4% in the current analysis (a 3.8% increase on the base in the earlier analysis). Second, SENS increased more than the 3.8% proportional increase in size of the high-risk cluster, with a 7.7% increase for having any adverse outcome [i.e. 1 – (55.8/51.8) based on SENS being 55.8% in the current analysis versus 51.8% in the earlier analysis] and an 8.7% increase for having two or more of these outcomes [i.e. 1 – (70.5/64.8) based on SENS being 70.5% in the current analysis versus 64.8% in the earlier analysis]. Third, LR+ increased as a result of the higher increases in SENS than relative prevalence, with LR+ of 2.6 for having any of the four outcomes versus 2.4 in the earlier analysis and LR+ of 4.8 for having more than one of these outcomes versus 4.1 in the earlier analysis.
Discussion
In this study, data limitations included use of retrospective reports based on fully structured diagnostic interviews that included only a limited set of predictors. An especially important limitation regarding predictors is that personality disorders were not assessed, as personality disorders are known to predict depression treatment outcome (Candrian et al. Reference Candrian, Farabaugh, Pizzagalli, Baer and Fava2007). Nor did we consider predictors of depression persistence/severity other than depressive symptoms and co-morbidity (e.g. gender, other sociodemographics, stress exposure) because of our interest in focusing on symptoms co-morbidity in defining subtypes. Future extensions should include a wider range of predictors and outcomes based on clinical assessments and prospective designs.
The machine learning methods used here, although designed to minimize model overfitting, were not completely conservative because they failed to adjust for within-country geographic clustering. This means that predictor effects might not hold up as well in other samples as it would if the data had been based on simple random samples. At the other extreme, the tree and penalized regression methods do not exhaust all available machine learning methods. As a result, other synergistic associations might be discovered if future studies used a wider range of integrated machine learning methods (van der Laan et al. Reference van der Laan, Polley and Hubbard2007).
In interpreting predictor coefficients it is important to appreciate that machine learning methods are designed to maximize overall model prediction at the expense of coefficient accuracy. The predictors selected under the lasso penalty, in particular, are the ones that best represent the joint effects of the larger sets of predictors to which they are related. It is consequently important not to overinterpret the importance of the specific predictors retained in these models. Within the context of this and the other limitations noted above, we found that temporally primary fear and distress disorders are much more consistent predictors of long-term major depression persistence/severity than are externalizing disorders. We also found synergistic effects among fear disorders, but not among distress disorders or between fear and distress disorders. The failure to find synergistic effects among distress disorders is noteworthy, given that major depression is a distress disorder (Clark & Watson, Reference Clark and Watson2006).
We found that multivariate predictions are strongly correlated across outcomes and that distinct subsets of respondents had high or low predicted risk across all outcomes. This high-risk cluster included one-third of respondents and accounted for 56.6–72.9% of adverse outcomes. This clustering was stronger than in the van Loo analysis, documenting the importance of co-morbidity in predicting long-term depression persistence/severity. Although the finding of strong correlations among predicted scores across outcomes is not surprising given that all outcomes assessed long-term disorder persistence/severity, the finding of distinct high-risk and low-risk clusters was not preordained by these high bivariate associations.
Although several previous epidemiological studies have examined baseline predictors of long-term depression course in treatment samples (Penninx et al. Reference Penninx, Beekman, Smit, Zitman, Nolen, Spinhoven, Cuijpers, De Jong, Van Marwijk, Assendelft, Van Der Meer, Verhaak, Wensing, De Graaf, Hoogendijk, Ormel and Van Dyck2008; Judd et al. Reference Judd, Schettler, Coryell, Akiskal and Fiedorowicz2013) or community samples (Bottomley et al. Reference Bottomley, Nazareth, Torres-Gonzalez, Svab, Maaroos, Geerlings, Xavier, Saldivia and King2010; Patten et al. Reference Patten, Wang, Williams, Lavorato, Khaled and Bulloch2010; Rhebergen et al. Reference Rhebergen, Lamers, Spijker, de Graaf, Beekman and Penninx2012), none searched for depression subtypes among predictors. As noted in the introduction, however, other subtyping analyses similar to those reported here have been carried out, including analyses to predict treatment response (Andreescu et al. Reference Andreescu, Mulsant, Houck, Whyte, Mazumdar, Dombrovski, Pollock and Reynolds2008; Jain et al. Reference Jain, Hunter, Brooks and Leuchter2013) and naturalistic patterns of remission among patients in treatment (Riedel et al. Reference Riedel, Moller, Obermeier, Adli, Bauer, Kronmuller, Brieger, Laux, Bender, Heuser, Zeiler, Gaebel, Schennach-Wolff, Henkel and Seemuller2011), as well as the placebo control group of a depression clinical trial (Nelson et al. Reference Nelson, Zhang, Deberdt, Marangell, Karamustafalioglu and Lipkovich2012). In addition, some recent clinical studies have used methods similar to ours to predict onset of suicidality during the course of depression treatment (Seemuller et al. Reference Seemuller, Riedel, Obermeier, Bauer, Adli, Mundt, Holsboer, Brieger, Laux, Bender, Heuser, Zeiler, Gaebel, Jager, Henkel and Moller2009; Rabinoff et al. Reference Rabinoff, Kitchen, Cook and Leuchter2011; Musil et al. Reference Musil, Zill, Seemuller, Bondy, Meyer, Spellmann, Bender, Adli, Heuser, Fisher, Gaebel, Maier, Rietschel, Rujescu, Schennach, Moller and Riedel2013) or after termination of treatment (Ilgen et al. Reference Ilgen, Downing, Zivin, Hoggatt, Kim, Ganoczy, Austin, McCarthy, Patel and Valenstein2009). Our results suggest that similar efforts in prospective samples might be able to document subtypes that predict long-term persistence/severity of depression.
In considering the extension of our analyses to prospective studies, it is important to recognize that we failed to find strong higher-order predictor profiles based on complex trees despite the sample being fairly large. Taken together with the results of a recent systematic review by van Loo et al. (Reference van Loo, de Jonge, Romeijn, Kessler and Schoevers2012) that failed to find support for stable symptom-based MDD subtypes defined by internal consistency (e.g. factor analysis, latent class analysis), this argues against the existence of strong MDD subtypes defined exclusively by synergistic associations among symptoms or co-morbidities. However, broader MDD predictive subtypes might be found by focusing more closely within the high-risk cluster identified in our analysis. Importantly, this cluster is not a classical subtype because it was discovered by examining multivariate predicted outcome scores rather than the predictors themselves. Many different predictor combinations could lead to the same predicted outcome scores. This means that more work is needed to identify subtypes within the high-risk cluster by considering multivariate profiles among the predictors that determine cluster membership. This would require methods other than those used in the current report. In addition, it would be useful if future studies expanded the outcomes beyond the four considered here to gain more insight into the range over which prediction occurs. Such an investigation could be carried out informally using the simple correlational methods described here or more formally using machine learning methods developed to discover genetic master regulators (Ryu et al. Reference Ryu, Kim, Deluca and Alani2007; Chan & Kyba, Reference Chan and Kyba2013; Rabinowitz & Silhavy, Reference Rabinowitz and Silhavy2013; Rayner et al. Reference Rayner, Figtree, Sabaretnam, Shang, Mazhar, Weaver, Lay, Witting, Hunyor, Grieve, Khachigian and Bhindi2013).
Acknowledgments
The WHO WMH Survey Initiative is supported by the National Institute of Mental Health (NIMH; R01 MH070884), the John D. and Catherine T. MacArthur Foundation, the Pfizer Foundation, the US Public Health Service (R13-MH066849, R01-MH069864 and R01 DA016558), the Fogarty International Center (FIRCA R03-TW006481), the Pan American Health Organization, Eli Lilly & Company Foundation, Ortho-McNeil Pharmaceutical, Inc., GlaxoSmithKline, Sanofi Aventis and Bristol-Myers Squibb. P. de Jonge is supported by a VICI grant (no: 91812607) from the Netherlands Research Foundation (NWO-ZonMW). We thank the WMH staff for assistance with instrumentation, fieldwork and data analysis. A complete list of WMH publications can be found at www.hcp.med.harvard.edu/wmh/.
Each WMH country obtained funding for its own survey. The São Paulo Megacity Mental Health Survey is supported by the State of São Paulo Research Foundation (FAPESP) Thematic Project Grant 03/00204-3. The Bulgarian Epidemiological Study of common mental disorders EPIBUL is supported by the Ministry of Health and the National Center for Public Health Protection. The Beijing, People's Republic of China WMH Survey Initiative is supported by the Pfizer Foundation. The Shenzhen, People's Republic of China Mental Health Survey is supported by the Shenzhen Bureau of Health and the Shenzhen Bureau of Science, Technology and Information. The Colombian National Study of Mental Health (NSMH) is supported by the Ministry of Social Protection. Implementation of the Iraq Mental Health Survey (IMHS) and data entry were carried out by the staff of the Iraqi MOH and MOP with direct support from the Iraqi IMHS team with funding from both the Japanese and European Funds through the United Nations Development Group Iraq Trust Fund (UNDG ITF). The Israel National Health Survey is funded by the Ministry of Health with support from the Israel National Institute for Health Policy and Health Services Research and the National Insurance Institute of Israel. The World Mental Health Japan (WMHJ) Survey is supported by the Grant for Research on Psychiatric and Neurological Diseases and Mental Health (H13-SHOGAI-023, H14-TOKUBETSU-026, H16-KOKORO-013) from the Japan Ministry of Health, Labor and Welfare. The Lebanese National Mental Health Survey (L.E.B.A.N.O.N.) is supported by the Lebanese Ministry of Public Health, the WHO (Lebanon), the National Institute of Health/Fogarty International Center (R03 TW006481-01), the Sheikh Hamdan Bin Rashid Al Maktoum Award for Medical Sciences, anonymous private donations to IDRAAC, Lebanon, and unrestricted grants from AstraZeneca, Eli Lilly, GlaxoSmithKline, Hikma Pharmaceuticals, Janssen Cilag, Lundbeck, Novartis, and Servier. The Mexican National Comorbidity Survey (MNCS) is supported by the National Institute of Psychiatry Ramon de la Fuente (INPRFMDIES 4280) and the National Council on Science and Technology (CONACyT-G30544-H), with supplemental support from the PanAmerican Health Organization (PAHO). Te Rau Hinengaro: the New Zealand Mental Health Survey (NZMHS) is supported by the New Zealand Ministry of Health, the Alcohol Advisory Council and the Health Research Council. The Nigerian Survey of Mental Health and Wellbeing (NSMHW) is supported by the WHO (Geneva), the WHO (Nigeria), and the Federal Ministry of Health, Abuja, Nigeria. The Northern Ireland Study of Mental Health was funded by the Health and Social Care Research and Development Division of the Public Health Agency. The Portuguese Mental Health Study was carried out by the Department of Mental Health, Faculty of Medical Sciences, NOVA University of Lisbon, with collaboration of the Portuguese Catholic University, and was funded by the Champalimaud Foundation, Gulbenkian Foundation, Foundation for Science and Technology (FCT) and Ministry of Health. The Romania WMH study projects ‘Policies in Mental Health Area’ and ‘National Study regarding Mental Health and Services Use’ were carried out by the National School of Public Health and Health Services Management (former the National Institute for Research and Development in Health, present National School of Public Health Management and Professional Development, Bucharest), with technical support of Metro Media Transilvania, the National Institute of Statistics – National Center for Training in Statistics, SC, Cheyenne Services SRL, Statistics Netherlands and were funded by the Ministry of Public Health (former Ministry of Health) with supplemental support of Eli Lilly Romania SRL. The Ukraine Comorbid Mental Disorders during Periods of Social Disruption (CMDPSD) study is funded by the US NIMH (RO1-MH61905). The US National Comorbidity Survey Replication (NCS-R) is supported by the NIMH (U01-MH60220) with supplemental support from the National Institute of Drug Abuse (NIDA), the Substance Abuse and Mental Health Services Administration (SAMHSA), the Robert Wood Johnson Foundation (RWJF; Grant 044708), and the John W. Alden Trust. The European surveys were funded by the European Commission (contracts QLG5-1999-01042, SANCO 2004123 and EAHC 20081308), the Piedmont Region (Italy), Fondo de Investigación Sanitaria, Instituto de Salud Carlos III, Spain (FIS 00/0028), Ministerio de Ciencia y Tecnología, Spain (SAF 2000-158-CE), Departament de Salut, Generalitat de Catalunya, Spain, Instituto de Salud Carlos III (CIBER CB06/02/0046, RETICS RD06/0011 REM-TAP) and other local agencies and by an unrestricted educational grant from GlaxoSmithKline. Additional support for preparation of this report was provided by Janssen Pharmaceuticals. The views and opinions expressed in this report are those of the authors and should not be construed to represent the views or policies of any of the sponsoring organizations, agencies or the WHO.
Declaration of Interest
Dr Fava has had research support from Abbot Laboratories, Alkermes, Inc., American Cyanamid, Aspect Medical Systems, AstraZeneca, BioResearch, BrainCells Inc., Bristol-Myers Squibb, CeNeRx BioPharma, Cephalon, Clintara, LLC, Covance, Covidien, Eli Lilly and Company, EnVivo Pharmaceuticals, Inc., Euthymics Bioscience, Inc., Forest Pharmaceuticals, Inc., Ganeden Biotech, Inc., GlaxoSmithKline, Harvard Clinical Research Institute, Hoffman-LaRoche, Icon Clinical Research, i3 Innovus/Ingenix, Janssen R&D, LLC, Jed Foundation, Johnson & Johnson Pharmaceutical Research & Development, Lichtwer Pharma GmbH, Lorex Pharmaceuticals, MedAvante, National Alliance for Research on Schizophrenia and Depression (NARSAD), National Center for Complementary and Alternative Medicine (NCCAM), NIDA, NIMH, Neuralstem, Inc., Novartis AG, Organon Pharmaceuticals, PamLab, LLC, Pfizer Inc., Pharmacia-Upjohn, Pharmaceutical Research Associates, Inc., Pharmavite® LLC, PharmoRx Therapeutics, Photothera, Roche Pharmaceuticals, RCT Logic, LLC (formerly Clinical Trials Solutions, LLC), Sanofi-Aventis US LLC, Shire, Solvay Pharmaceuticals, Inc., Synthelabo, and Wyeth-Ayerst Laboratories; has been a consultant or served on advisory boards for Abbott Laboratories, Affectis Pharmaceuticals AG, Alkermes, Inc., Amarin Pharma Inc., Aspect Medical Systems, AstraZeneca, Auspex Pharmaceuticals, Bayer AG, Best Practice Project Management, Inc., BioMarin Pharmaceuticals, Inc., Biovail Corporation, BrainCells Inc., Bristol-Myers Squibb, CeNeRx BioPharma, Cephalon, Inc., Cerecor, CNS Response, Inc., Compellis Pharmaceuticals, Cypress Pharmaceutical, Inc., DiagnoSearch Life Sciences (P) Ltd, Dinippon Sumitomo Pharma Co. Inc., Dov Pharmaceuticals, Inc., Edgemont Pharmaceuticals, Inc., Eisai Inc., Eli Lilly and Company, EnVivo Pharmaceuticals, Inc., ePharmaSolutions, EPIX Pharmaceuticals, Inc., Euthymics Bioscience, Inc., Fabre-Kramer Pharmaceuticals, Inc., Forest Pharmaceuticals, Inc., GenOmind, LLC, GlaxoSmithKline, Grunenthal GmbH, i3 Innovus/Ingenis, Janssen Pharmaceutica, Jazz Pharmaceuticals, Inc., Johnson & Johnson Pharmaceutical Research & Development, LLC, Knoll Pharmaceuticals Corp., Labopharm Inc., Lorex Pharmaceuticals, Lundbeck Inc., MedAvante, Inc., Merck & Co., Inc., MSI Methylation Sciences, Inc., Naurex, Inc., Neuralstem, Inc., Neuronetics, Inc., NextWave Pharmaceuticals, Novartis AG, Nutrition 21, Orexigen Therapeutics, Inc., Organon Pharmaceuticals, Otsuka Pharmaceuticals, Pamlab, LLC., Pfizer Inc., PharmaStar, Pharmavite® LLC, PharmoRx Therapeutics, Precision Human Biolaboratory, Prexa Pharmaceuticals, Inc., Puretech Ventures, PsychoGenics, Psylin Neurosciences, Inc., RCT Logic, LLC (formerly Clinical Trials Solutions, LLC), Rexahn Pharmaceuticals, Inc., Ridge Diagnostics, Inc., Roche, Sanofi-Aventis US LLC, Sepracor Inc., Servier Laboratories, Schering-Plough Corporation, Solvay Pharmaceuticals, Inc., Somaxon Pharmaceuticals, Inc., Somerset Pharmaceuticals, Inc., Sunovion Pharmaceuticals, Supernus Pharmaceuticals, Inc., Synthelabo, Takeda Pharmaceutical Company Limited, Tal Medical, Inc., Tetragenex Pharmaceuticals, Inc., TransForm Pharmaceuticals, Inc., Transcept Pharmaceuticals, Inc., Vanda Pharmaceuticals, Inc.; has received speaking or publishing support from Adamed, Co, Advanced Meeting Partners, American Psychiatric Association, American Society of Clinical Psychopharmacology, AstraZeneca, Belvoir Media Group, Boehringer Ingelheim GmbH, Bristol-Myers Squibb, Cephalon, Inc., CME Institute/Physicians Postgraduate Press, Inc., Eli Lilly and Company, Forest Pharmaceuticals, Inc., GlaxoSmithKline, Imedex, LLC, MGH Psychiatry Academy/Primedia, MGH Psychiatry Academy/Reed Elsevier, Novartis AG, Organon Pharmaceuticals, Pfizer Inc., PharmaStar, United BioSource, Corp., and Wyeth-Ayerst Laboratories; has equity holdings from Compellis and PsyBrain, Inc.; has royalties, patents or other income from Sequential Parallel Comparison Design (SPCD), which are licensed by MGH to RCT Logic, LLC; and a patent application for a combination of Ketamine plus Scopolamine in Major Depressive Disorder (MDD) (patent); MGH Cognitive and Physical Functioning Questionnaire (CPFQ), Sexual Functioning Inventory (SFI), Antidepressant Treatment Response Questionnaire (ATRQ), Discontinuation-Emergent Signs and Symptoms (DESS), and SAFER; Lippincott, Williams & Wilkins; Wolkers Kluwer; World Scientific Publishing Co. Pte. Ltd (copyrights). Dr Nierenberg has consulted for the American Psychiatric Association, Appliance Computing Inc. (Mindsite), Basliea, Brain Cells, Inc., Brandeis University, Bristol Myers Squibb, Clintara, Dey Pharmaceuticals, Dainippon Sumitomo (now Sunovion), Eli Lilly and Company, EpiQ, L.P./Mylan Inc., Forest, Novartis, PamLabs, PGx Health, Shire, Schering-Plough, Sunovion, Takeda Pharmaceuticals, Targacept, and Teva; consulted through the MGH Clinical Trials Network and Institute (CTNI) for Astra Zeneca, Brain Cells, Inc., Dianippon Sumitomo/Sepracor, Johnson & Johnson, Labopharm, Merck, Methylation Science, Novartis, PGx Health, Shire, Schering-Plough, Targacept, and Takeda/Lundbeck Pharmaceuticals; received grant/research support from AHRQ, Cephalon, Elan, Forest, Mylan, NIMH, PamLabs, Pfizer Pharmaceuticals, Shire, and Takeda; received honoraria from Belvoir Publishing, University of Texas Southwestern Dallas, Hillside Hospital, American Drug Utilization Review, American Society for Clinical Psychopharmacology, Baystate Medical Center, Columbia University, CRICO, Dartmouth Medical School, IMEDEX, Israel Society for Biological Psychiatry, Johns Hopkins University, MJ Consulting, New York State, Medscape, MBL Publishing, National Association of Continuing Education, Physicians Postgraduate Press, SUNY Buffalo, University of Wisconsin, University of Pisa, University of Michigan, University of Miami, APSARD, ISBD, SciMed, Slack Publishing, and Wolters Klower Publishing; is currently or was formerly on the advisory boards of Appliance Computing, Inc., Brain Cells, Inc., Eli Lilly and Company, Johnson & Johnson, Takeda/Lundbeck, Targacept, and InfoMedic; owns stock options in Appliance Computing, Inc. and Brain Cells, Inc; has copyrights to the Clinical Positive Affect Scale and the MGH Structured Clinical Interview for the Montgomery Asberg Depression Scale exclusively licensed to the MGH Clinical Trials Network and Institute (CTNI); and has a patent extension application for the combination of buspirone, bupropion, and melatonin for the treatment of depression. Dr Wilcox is an employee of Janssen Pharmaceuticals. Dr Kessler has been a consultant for AstraZeneca, Analysis Group, Bristol-Myers Squibb, Cerner-Galt Associates, Eli Lilly and Company, GlaxoSmithKline Inc., HealthCore Inc., Health Dialog, Hoffman-LaRoche, Inc., Integrated Benefits Institute, J&J Wellness & Prevention, Inc., John Snow Inc., Kaiser Permanente, Lake Nona Institute, Matria Inc., Mensante, Merck & Co, Inc., Ortho-McNeil Janssen Scientific Affairs, Pfizer Inc., Primary Care Network, Research Triangle Institute, Sanofi-Aventis Groupe, Shire US Inc., SRA International, Inc., Takeda Global Research and Development, Transcept Pharmaceuticals Inc., and Wyeth-Ayerst; has served on advisory boards for Appliance Computing II, Eli Lilly and Company, Mindsite, Ortho-McNeil Janssen Scientific Affairs, Johnson & Johnson, Plus One Health Management and Wyeth-Ayerst; has had research support for his epidemiological studies from Analysis Group Inc., Bristol-Myers Squibb, Eli Lilly and Company, EPI-Q, GlaxoSmithKline, Johnson & Johnson Pharmaceuticals, Ortho-McNeil Janssen Scientific Affairs, Pfizer Inc., Sanofi-Aventis Groupe, Shire US, Inc., and Walgreens Co.; and owns 25% share in DataStat, Inc.