I. INTRODUCTION
The applications of semiconductors in photocatalysis have attracted considerable attention worldwide due to the increasing demand for the environmental remediation and energy crises.Reference Schneider, Matsuoka, Takeuchi, Zhang, Horiuchi, Anpo and Bahnemann1–Reference Ran, Zhang, Yu, Jaroniec and Qiao6 TiO2 has been extensively investigated in the solar cells, hydrogen generation, and environmental cleaning due to its excellent chemical stability, nontoxicity, and photocatalytic activity.Reference Fujishima7–Reference Xu, Ouyang, Liu, Reunchan, Umezawa and Ye14 In general, TiO2 exhibits three polymorphs, i.e., rutile, anatase, and brookite; and rutile is the most stable and anatase has the highest photocatalytic activity.Reference Bourikas, Kordulis and Lycourghiotis15 However, the photocatalytic activity of rutile is lower than that of anatase. It is challenging how to transfer anatase to rutile and further improve the photocatalytic effect of rutile due to their intrinsic physical properties. Some works have been developed to realize the phase transition from anatase to rutile. Among them, Sn-doped TiO2 (SDT) nanomaterials hold exciting implications for the phase transition and improving the stability of photocatalytic reaction.Reference Zhang, Xu, Chen, Wang and Tian16,Reference Fu, Yang, Wei, Shu, Qiao and Deng17 But, how to enhance the photocatalytic effect of SDT remains a challenge. Recently, noble metal–TiO2 heterostructure photocatalysts have attracted more attention owing to the localized surface plasmon resonance (LSPR) and the effective charge carrier separation by forming a Schottky barrier at the metal/TiO2 interface.Reference Dutta, Mehetor and Pradhan18–Reference Wu, Song, Yoon, Yu and Chen38 Thus, it is highly desirable to load Au nanoparticles (NPs) on the surface of SDT nanorods to improve their photocatalytic activity.
Furthermore, the surfactants have a strong effect on the synthesis of TiO2 nanostructures. The biomacromolecules display more prospect than the general surfactants. Recently, some chiral semiconductors have been prepared by using biomacromolecules (such as DNA and proteins) as biotemplates.Reference Duan and Che39,Reference Liu, Han, Duan, Asahina, Terasaki, Cao, Liu, Ma, Zhang and Che40 Beyond DNA and some proteins, cellulose has been broadly studied for application in synthesis of semiconductor nanomaterials. It can be attribute to that cellulose is the most abundant biopolymer in earth, consisting of a linear polysaccharide on the basis of β-1,4-linked D-glucose units and including plenty of hydroxyl groups. Various polymorphs of cellulose can be formed by aggregation of cellulose chains via intra- and inter-molecular hydrogen bond.Reference Zhu, Parvinian, Preston, Vaaland, Ruan and Hu41,Reference Yu, Qin, Liang, Liu, Zhou and Chen42 Nanocystalline celluloses (NCC) can be prepared from native cellulose, composing of crystalline and noncrystalline domains, by using acid hydrolysis.Reference Möller, Harnisch and Schröder43 Thus, it is anticipant to prepare SDT hierarchical nanorods via using NCCs as biotemplate and further improve their photocatalytic activity by loading Au NPs on their surface.
In this work, SDT hierarchical nanorods have been synthesized via using nanocystalline cellulose nanorod as biotemplate. The phase transition from anatase to rutile can be more easily realized by doping Sn ions compared to the enhancing calcination temperature and the morphology can be remained due to the similar ionic radius and charge between Sn and Ti. The photocatalytic activity of SDT nanorods can be obviously improved by loaded Au NPs on the surface due to the LSPR effect of Au and formation of a Schottky barrier at the Au/TiO2 interface. It is favor of the effective separation of photoinduced carriers and the formation of superoxide anion radicals.
II. EXPERIMENTAL SECTION
A. Materials
All chemicals were purchased and used without further purification. Tin dichloride (SnCl2·2H2O) was purchased from Xilong Chemicals Works. Tetrabutyl titanate (TBT) was purchased from Tianjin Fucheng Chemical Industry. Trisodium citrate (C6H5Na3O7, 99%) and urea (CO(NH2)2) were purchased from Beijing Chemical Works. Hydrogen tetrachloroaurate(III) trihydrate (HAuCl4, ACS, 99.99%) was purchased from Alfa Aesar.
B. Preparation of SDT hierarchical nanorods
In a typical experiment, 8 mL (6 wt%) NCC solution was added to 180 mL deionized water at 65 °C, followed by the addition of 0.4 g of SnCl2 and stirred for 30 min until the homogeneous mixtures were obtained. Next, 2 g urea was added to the above-mentioned mixture and stirred at 65 °C for 6 h. The NCC coated amorphous tin oxide composites were centrifuged and washed four times with deionized water and ethanol to remove the residues and dispersed into ethanol for further procedures. 6 mL TBT was added in 240 mL ethanol and stirred for 30 min until the homogenous solution was obtained. Then, the NCC coated amorphous tin oxide composites were added into the above-mentioned solution and stirred for 1 h. Subsequently, 50 mL the mixture of deionized water and ethanol with volume ratio of 1:10 was dropwise added in the above mixture and stirred for 24 h. The product was centrifuged and washed four times with ethanol and water to remove the organic residues and dried at 60 °C. The as-synthesized products were calcined at 520 °C for 6 h in a muffle furnace at a heating rate of 1 °C/min to form the SDT hierarchical nanorods.
C. Synthesis of Au SDT hierarchical nanorods
The Au/SDT was synthesized according to the previous report. Typically, a series of amounts of HAuCl4 (1 mM) were added in the 100 mL deionized water and the pH value of the solution was adjusted to 8–9 by using sodium hydroxide solution. Next, the SDT nanorods (0.8 g/L) was mixed with the 4.8 mL trisodim citrate solution (1 wt%). Then, the above-mentioned two solutions were mixed and stirred for 40 min at 97 °C. The Product was centrifuged and washed four times with ethanol and deionized water to remove the organic residues.
D. Characterization
The surface morphologies of the composite materials were performed with a JEOL-6700 F field emission scanning electron microscope (FESEM; JEOL Ltd., Tokyo, Japan) at an accelerating voltage of 3 kV. The x-ray diffraction (XRD) patterns of the composite materials were inspected with a Rigaku D/Max 2550 x-ray diffractometer (Rigaku Corporation, Tokyo, Japan) using a monochromatized Cu target radiation resource (λ = 1.54 Å). The transmission electron micrograph (TEM) and high-resolution transmission electron micrograph (HRTEM) images were recorded on an FEI Tecnai G2S-Twin (FEI Company, Eindhoven, The Netherlands) with a field emission gun operating at 200 kV. The x-ray photoelectron spectra (XPS) were measured by an ESCALab 250 Analytical XPS spectrometer (Thermo Scientific, New York, New York) with a monochromatic x-ray source (Al Kα, h = 1486.6 eV). The nitrogen adsorption–desorption isotherms were recorded at 77.3 K with a Micromeritics ASAP 2420 surface area and porosity analyzer (Micromeritics, Norcross, Georgia). UV-visible absorption (UV-vis) spectra were measured by a SHIMADZU UV-2450 spectrometer (Shimadzu Corp., Kyoto, Japan). The lock-in-based surface photovoltage (SPV) spectroscopic measurement system consisted of a source of monochromatic light, a lock-in amplifier (SR830-DSP, Stanford Research Systems, Sunnyvale, California) with a light chopper (SR540), a photovoltaic cell, and a computer. Monochromatic light was provided by passing light from a 500 W xenon lamp (CHF-XM-500 W, Global Xenon Lamp Power, Perfectlight, Beijing, China) through a grating monochromator (Omni-5007, Zolix, Beijing, China). A low chopping frequency of 23 Hz was used in the conventional testing.
E. Photocatalytic activity
The photocatalytic activity of as-synthesized TiO2 hierarchical nanorods, SDT hierarchical nanorods and Au/SDT hierarchical nanorods was investigated by methyl orange (MO) degradation (20 mg/L) under a high-pressure mercury arc lamp (500 W). In a typical experiment, 50 mg TiO2 hierarchical nanorods, SDT hierarchical nanorods and 10 mg Au/SDT hierarchical nanorods were added to 50 mL (20 mg/L) MO dye solution and mixed and statically held for at least 30 min in darkness to establish an adsorption/desorption equilibrium at room temperature, prior to exposure to light source. In photocatalytic assessments, the distance between the light source and cuvette was 10 cm. The solution was under magnetic stirring during the entire experimental procedure. The photocatalytic activities were quantified by collecting the UV-vis absorption spectra of the solution at different reaction intervals.
III. RESULTS AND DISCUSSION
Procedures for preparing the NCC seed nanorods (Fig. S1), amorphous TiO2@SnO2@NCC hybrid nanorods (Fig. S2), SDT hierarchical nanorods and Au/SDT hierarchical nanorods are shown in Fig. 1. Initially monodispersed amorphous SnO2@NCC and amorphous TiO2@SnO2@NCC seed nanorods with an average diameter of 40 nm and 80 nm, and average length of 300 nm, respectively, were prepared via the modified Stöber process.Reference Stöber, Fink and Bohn44
The process of synthesis of TiO2 hierarchical nanorods and Au/SDT hierarchical nanorods.

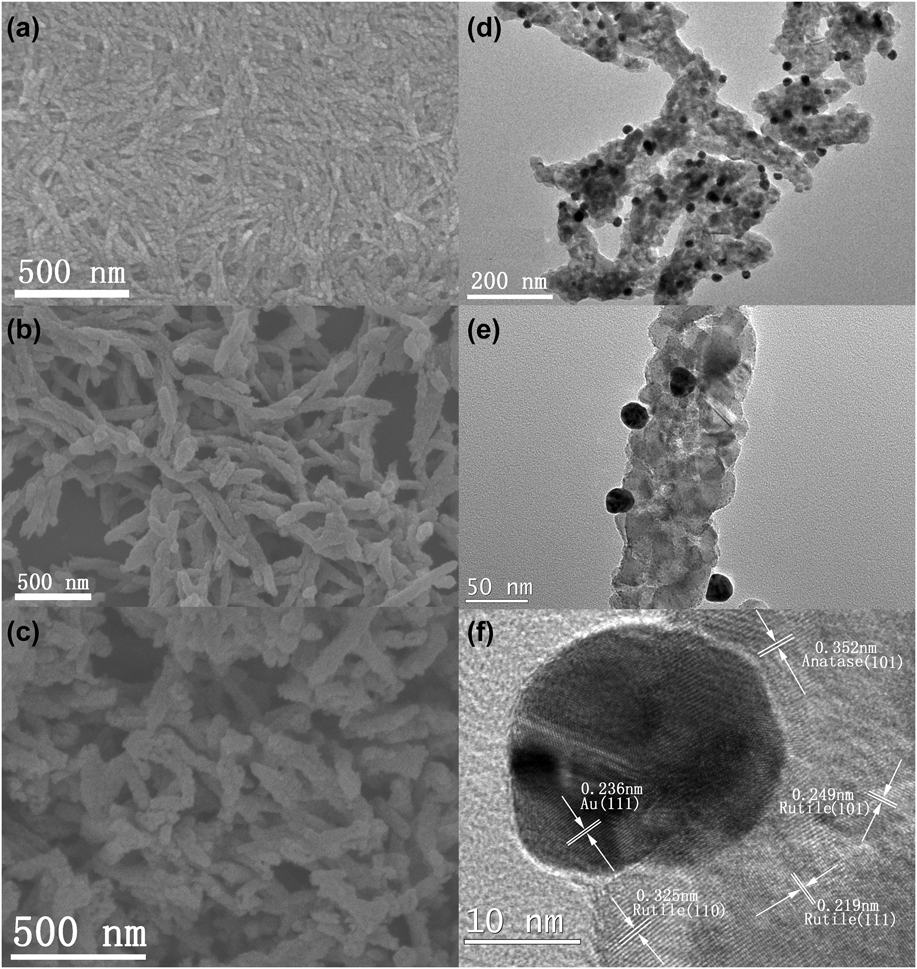
The FESEM images of the amorphous SnO2@NCC and amorphous TiO2@SnO2@NCC hybrid nanorods are shown in Figs. 2(a) and 2(b), respectively. The scanning electron microscope (SEM) images show that the SnO2@NCC and TiO2@SnO2@NCC seeds have a rod morphology with a rough surface. The SDT hierarchical nanorods were obtained via calcinating the relative TiO2@SnO2@NCC seed nanorods [Fig. 2(c)] and the Au/SDT hierarchical nanorods were synthesized by loading Au NPs on the surface of the SDT nanorods. Typical TEM image of Au/SDT hierarchical nanorods is shown in the Fig. 2(d). It can be found that Au NPs are uniformly distributed on the surface of SDT nanorods with an average diameter of 20 nm [Fig. 2(e)]. In parallel, the detailed evolutionary of TiO2 nanorods was investigated by coating amorphous TiO2 on the surface of NCC seed nanorods and subsequently calcinating the above-mentioned products to obtain the crystalline TiO2 hierarchical nanorods by keeping the similar reaction conditions (Fig. S3). The similar morphology of all these products originates from the effect of NCC template, confirming that superficial functionality and negative charges of NCC play an important role in the coating procedure. NCC seed nanorods are bestowed surface functionality and carry negative charges via esterification of one hydroxyl group of NCC using H2SO4, leading to capture the Sn4+ and Ti4+ by coordination.
FESEM images of the (a) amorphous SnO2@NCC, (b) amorphous TiO2@SnO2@NCC, (c) SDT hierarchical nanorods; (d), (e) TEM image of Au/SDT hierarchical nanorods, (f) HTEM image of Au/SDT hierarchical nanorods.
Au/SDT hierarchical nanorods consist of TiO2 and Au NPs on the basis of HRTEM image [Fig. 2(f)]. HRTEM image taken from the edge of Au/SDT nanorods reveals that the d-spacing between two consecutive planes are about 0.22, 0.25, and 0.32 nm, respectively, agreeing with the d 111, d 101, and d 110 values of rutile phase and the distance between two consecutive planes is 0.35 nm agreeing with the d 101 value of anatase phase. The lattice distance of 0.24 nm is consistent with the d 111 value of face-centered cubic (f.c.c) Au phase.
It is well known that the calcination temperature has a strong effect on the structural property of TiO2 nanostructures. The crystallinity of TiO2 nanorods is improved by increasing the calcination temperature, confirmed by the XRD patterns [Fig. 3(a)]. The XRD patterns of TiO2 nanorods show that the peaks were gradually sharpening and narrowing and the phase transition from anatase to rutile takes place at 520 °C. The proportion of rutile increases from 9.24% to 20.66% with increasing calcination temperature from 520 °C to 600 °C. The XRD patterns of the TiO2 hierarchical nanorods, SDT hierarchical nanorods and Au/SDT hierarchical nanorods were shown in Fig. 3(b). The major peaks at 25.31, 37.80, 48.04, and 62.69° on the XRD pattern of TiO2 hierarchical nanorods are indexed to (101), (004), (200), and (213) reflections of anatase phase (JCPDS 84-1285), and the minor peaks at 27.44, 36.08 and 41.24° are indexed to (110), (101) and (111) reflections of rutile phase (JCPDS 73-1232), confirming that the anatase phase is dominant. However, the XRD patterns of the SDT and Au/SDT hierarchical nanorods show that they consist of the mixture of anatase and rutile phase with rutile phase being dominant. This result reveals that the Sn doping play an important role in the phase transition from anatase to rutile due to the formation of defects in the oxygen sublattice originating from the doping of Sn ions, which is more effective than the enhancing the calcination temperature.Reference Lai, Peng, Wang, Yu, Zhang and Zhao45 The peaks at 38.18, 44.37, 64.56, and 77.54° are indexed to (111), (200), (220), and (311) reflections of f.c.c Au phase (JCPDS 89-3697), which further indicates that Au NPs were successfully loaded on the surface of SDT hierarchical nanorods.
XRD pattern of the as-synthesized samples (a) TiO2 hierarchical nanorods calcined at different temperatures from 460 °C to 600 °C. (b) TiO2 hierarchical nanorods, SDT hierarchical nanorods and Au/SDT hierarchical nanorods.
The physical properties are correlative with the structure. The photocatalytic activity of the as-synthesized TiO2 hierarchical nanorods obtained by changing the calcination temperature, named as TiO2-460, TiO2-480, TiO2-500, TiO2-520, TiO2-540, TiO2-560, TiO2-580, TiO2-600, respectively, is evaluated by degradation of MO as shown in Fig. 4. The photocatalytic activity of these products is in increasing order of TiO2-460 < TiO2-480 < TiO2-500 < TiO2-520 [Fig. 4(a)] and in decreasing order of TiO2-520 > TiO2-540 > TiO2-560 > TiO2-580 > TiO2-600 [Fig. 4(b)] with increasing the reaction temperature. The photocatalytic activity of TiO2-520 is the highest as shown in Fig. 4(c), indicating that the improvement of photocatalytic activity can be attributed to the increase of the crystallinity of TiO2 nanorods and synergistic effect between anatase and rutile by calcinating the precursors at 520 °C. However, the photocatalytic activity will decrease when the calcination temperature exceeds 520 °C owing to the low photo-conversion effect of rutile phase.
TiO2 hierarchical nanorods calcined at different temperatures from (a) 460 °C to 520 °C, (b) 520 °C to 600 °C and P25 as catalyst, the variation of C/C 0 of MO solution with reaction time, (c) Remainder of MO solution reaction for 30 min.
SDT hierarchical nanorods contain dominant rutile phase with a little presence anatase phase show lower photocatalytic activity than TiO2-520 as shown in Fig. 5. It is well established that the photocatalytic properties obviously depend on the crystallinity, light absorption and recombination rate of photogenerated hole–electron pairs and so on.Reference Sabyrov, Burrows and Penn46–Reference Zhang, Zhao, Chen, Yu, Xu, Xu, Hao and Liu51 It is apparent that the crystallinity of TiO2-520 is higher than the crystallinity of SDT because the Sn doping will decrease the crystallinity. The SPV is available to investigate the electronic structure and interface charge transfer process of semiconductor.Reference Chen, Li, Liu, Lu, Wang, Lin and Xie52,Reference Peng, Xie, Lu, Fan and Wang53 The SPV results show that SDT has higher electron transition and interfacial charge transfer than TiO2-520 (Fig. S4). For TiO2-520, the intrinsic band to band transition (300–350 nm) can be attributed to the electron transitions from the valence band to the conduction band (CB). Whereas, SDT shows two obviously different features in the SPV responses: first, the intensity of SDT is stronger than that of TiO2-520, implying that the doping of the Sn can facilitate effective separation of the photogenerated charges and surpass the recombination upon UV light illumination; second, the SPV response region was significantly extended into the visible light region (400 nm–700 nm), which can be attributed to the sub-band-gap transition of SDT [Fig. S4(a)], confirming that exceptional transfer pathway of photogenerated charge carriers is helpful to the enhancement of visible light adsorption owing to the dopant energy levels of Sn in the band gap of TiO2. Both the positions of the photovoltage phase of SDT and TiO2-520 locate at around 0°, indicating the photo-induced holes are transported to the surface [Fig. S4(b)]. The UV-vis spectrum SDT nanorods shows that a more obvious red shift can be found for the absorption band of SDT hierarchical nanorods comparing to the TiO2 hierarchical nanorods due to the doping effect of Sn and phase transition from anatase to rutile (Fig. 6). The above-mentioned results show that the other factors have a strong effect on the photocatalytic activity.
TiO2-520, SDT hierarchical nanorods and P25 as catalyst, variation of C/C 0 of MO solution with reaction time.
The UV-vis spectrum of TiO2-520 and SDT hierarchical nanorods.
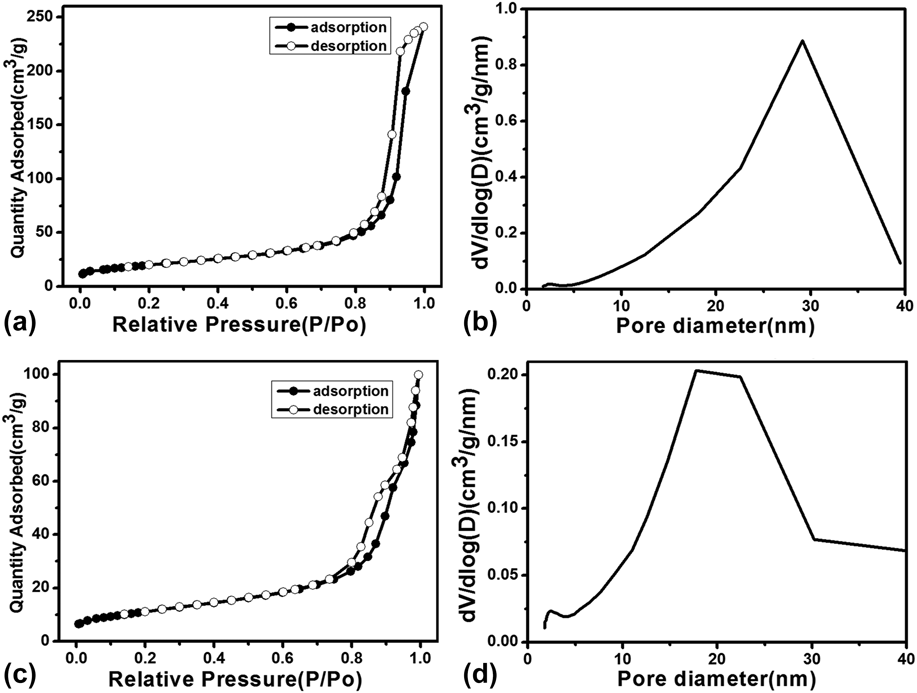
With the exception of the crystallinity, electronic structure and interface charge transfer process, the specific surface area also has a strong effect on the photocatalytic activity of semiconductors. The specific surface area and pore size distribution of TiO2-520 hierarchical nanorods and SDT hierarchical nanorods were calculated on the basis of the nitrogen adsorption–desorption data (Fig. 7). The nitrogen adsorption–desorption isotherms of TiO2-520 hierarchical nanorods and SDT hierarchical nanorods show a type IV hysteresis loop, confirming the presence of hierarchical pores. The specific surface areas are calculated to be 71 m2/g and 40 m2/g for TiO2-520 and SDT by using the Brunauer–Emmett–Teller method, respectively [Figs. 7(a) and 7(b)]. The pore volume of TiO2-520 and SDT is 0.04 cm3/g and 0.02 cm3/g, respectively. The pore size distribution, calculated on the basis of the Barrett–Joyner–Halenda model, indicates the presence of mesopores centered at 30 nm and 26 nm for TiO2-520 and SDT, respectively [Figs. 7(c) and 7(d)]. The mesopores might be formed by titania nanocrystalline around the NCCs nanorods. The specific surface area is in decreasing order of TiO2-520 > P25 > SDT. Furthermore, the photocatalytic activity of rutile phase is generally lower than that of anatase phase according to the previous reports.Reference Schneider, Matsuoka, Takeuchi, Zhang, Horiuchi, Anpo and Bahnemann1,Reference Chen, Liu and Huang2 The above-mentioned results suggest that the high photocatalytic activity of TiO2-520, which is higher than SDT, can be attributed to its larger specific surface area and the longer lifetime of free electron of anatase phase.Reference Yamakata, Vequizo and Matsunaga54
Nitrogen adsorption–desorption isotherms and the pore size distribution of (a and b) TiO2-520 and (c and d) SDT hierarchical nanorods.
Au/TiO2 heterostructure photocatalysts have attracted considerable attention due to the LSPR and high effect of charge carrier separation via the formation of a Schottky barrier at the Au/TiO2 interface according to the previous reports.Reference Naya, Niwa, Kume and Tada55,Reference Mubeen, Lee, Lee, Singh, Stucky and Moskovits56 The Au/SDT hierarchical nanorods have been achieved by loading different amount Au NPs on the surface of SDT via using the HAuCl4 solution of 5, 20, 40, 60, 80 mL as Au precursor, named as Au/SDT-5, Au/SDT-20, Au/SDT-40, Au/SDT-60, Au/SDT-80, respectively. The different loading amounts of Au have a strong effect on the photocatalytic activity as shown in Fig. 8(a). The degradation was obviously increased in the presence of Au NPs, larger than P25 and SDT under the similar experimental conditions. The Au/SDT-60 nanorods have the highest photocatalytic activity. Moreover, the degradation process approximately complies with the pseudo-first-order kinetics [Fig. 8(b)].
 $${\rm{ln}}\left( {{C \mathord{\left/ {\vphantom {C {{C_0}}}} \right. \kern-\nulldelimiterspace} {{C_0}}}} \right){\rm{ = }} - kt$$
where C 0, C, t, and k are the initial concentration of MO, the real concentrations of MO corresponding to the exposure time, and the exposure time and the degradation constant, respectively. The k values gained from fitted degradation lines for different catalysts of Au/SDT nanorods, P25, and the blank are calculated to be 0.01081, 0.01815, 0.0040, 0.0905, 0.02773, 0.02432, and 0.00019 min−1, respectively. This result also indicates that the Au/SDT-60 has the highest degradation rate.
P25 and SDT hierarchical nanorods loaded by different amounts of chloroauric acid solution as catalyst, the variation of (a) C/C 0 and (b) ln(C/C 0) of MO with reaction time.
To explain the observed photocatalytic activity, XPS was used to characterize the chemical nature of Au/SDT-60. The individual fitted XPS of C-1s, O-1s, Sn-3d, Ti-2p, and Au-4f of Au/SDT-60 are shown in Fig. 9(a). The XPS of C-1s exhibits a unique doublet with bonding energy of 284.5 eV and 285.9 eV [Fig. 9(b)], which may be attributed to the adsorbed amorphous carbon (C1), and carboxyl carbon (C2), respectively.Reference Zhang, Cao, Yue, Zhang and Qu57 The O-1s peak presents a triplet with bonding energy of 529.9 eV and 531.8 eV [Fig. 9(c)], which corresponds to the lattice oxygen (O1) and O-C (O2), respectively.Reference Yan, Wu, Guan, Li, Li and Cao58 The Ti-2p peak is a unique doublet at around 458.8–464.4 eV [Fig. 9(d)], which is typical of Ti4+ in an octahedral environment.Reference Iwabuchi, Choo and Tanaka59 The Sn-3d peak is a doublet at 486.4 eV (3d 5/2) to 494.9 eV (3d 3/2) [Fig. 9(e)], which is representative of Sn4+ in the Au/SDT nanorods.Reference Kaleji60 The Au-4f peak is a unique doublet with bonding energy of 83.8 eV and 87.4 eV, which can be attributed to the values for the Au 4f 7/2 and Au 4f 5/2 of metallic Au, respectively [Fig. 9(f)].Reference Wang, Wang, Zhu and Xu61 It further suggests that Au/SDT nanorods contain Sn4+ ion and metallic Au nanostructure on the surface. The load of Au NP can gradually increase the photocatalytic activity until the amount of Au NP reaches the optimal value. The further loading of Au NPs can result in the obvious decrease of photocatalytic activity.Reference Murdoch, Waterhouse, Nadeem, Metson, Keane, Howe, Llorca and Idriss31 It can be attributed to the following factors: (1) the adsorption of organic dye on SDT nanorods can be prohibited due to the high loading of Au NPs; (2) the light adsorption and generation of photogenerated carriers should be decreased owing to the excessive loading of Au NP on the surface of SDT nanorods; (3) the excessive loading of Au NP will increase the recombination centers, leading to the decrease of photocatalytic activity. The decrease of photocatalytic activity for Au/SDT-80 originates from the excessive loading amount of Au NPs. In parallel, the photocatalytic effect of Au/TiO2 nanorods was also investigated by loading different amount Au NPs on the surface of TiO2 hierarchical nanorods by using the HAuCl4 solution of 5, 20, 40, 60, and 80 mL as Au precursor (Fig. S5). It can be found that the Au NPs loading results in the decrease of photocatalytic activity. The SPV results of Au/SDT and Au/TiO2-520 show that the intensity of Au/TiO2-520 is lower than that of Au/SDT [Fig. S6(a)]. Both the positions of the photovoltage phase of Au/SDT and Au/TiO2-520 locate at around 0°, indicating the photo-induced holes are transported to the surface once again [Fig. S6(b)], confirming the Au/SDT has more effective separation of photoinduced carriers compared to the Au/TiO2-520.
XPS spectra of the Au/SDT hierarchical nanorods. (a) Survey spectrum, (b) C-1s, (c) O-1s, (d) Ti-2p, (e) Sn-3d, (f) Au-4f.
In addition, alcohols play an important role in the photocatalytic activity of TiO2 nanostructures due to their hole scavenging effect according to the previous reports.Reference Liu, Xia and Yu62,Reference Li, Yu, Low, Fang, Xiao and Chen63 Experimental data show that ethanol can effectively decrease the photocatalytic activity of TiO2-520, SDT, and P25 by reducing the amount of photo-induced hole on the surface as shown in Fig. S7. The electrons can be excited and transferred from the CB of SDT to the Au NPs, which can further react with the adsorbed O2 on the surface of Au to give rise to superoxide anion radicals  $\left( {{\rm{O}}_{\rm{2}}^ \cdot } \right)$ according to the previous report.Reference Kafizas, Adriaens, Mills and Parkin64 Therefore, we speculate that the improvement of photocatalytic activity of Au/SDT should originate from the formation of
 ${\rm{O}}_{\rm{2}}^ \cdot$. To verify the formation of
 ${\rm{O}}_{\rm{2}}^ \cdot$, the dimethyl sulphoxide (DMSO) was added in the reaction system with other reaction conditions remaining constant for parallel experiment to scavenge the
 ${{\rm{O}}^{{\rm{2}} - \cdot }}$. Figure 10 shows that the photocatalytic activity was obviously decreased in the presence of DMSO, confirming that the radical can be effectively produced in the experiment. The similar results can be found for Au/TiO2-520 (Fig. S8). On the basis of the above-mentioned results, an artist view of the possible photocatalytic mechanism is depicted in Scheme S1.
The influence of DMSO on the photocatalytic performance of Au/SDT hierarchical nanorods.
IV. CONCLUSIONS
A novel kind of Au loaded SDT hierarchical nanorod has been prepared by using NCC as biotemplate. This hierarchical nanocomposite exhibits good photocatalytic activity. In contrast to enhancing calcination temperature, the Sn doping can more effectively improve the phase transition from anatase to rutile due to the formation of defect in the oxygen lattice. The photo-conversion effect of SDT hierarchical nanorods is obviously enhanced by loading Au NPs on their surface duo to the effective separation of photoinduced carriers.
Supplementary Materials
To view supplementary material for this article, please visit http://dx.doi.org/10.1557/jmr.2016.128.
ACKNOWLEDGMENTS
The authors are grateful to National Natural Science Foundation of China for financial support (20971051).