1. Introduction
Anisotropy of magnetic susceptibility (AMS) is a well-developed technique for petrofabric analysis (Hrouda, Reference Hrouda1982; Zhang & Piper, Reference Zhang and Piper1994; De Wall, Greiling & Sadek, Reference De Wall, Greiling and Sadek2001; Borradaile & Jackson, Reference Borradaile, Jackson, Martín-Hernández, Lüneburg, Aubourg and Jackson2004; Mamtani & Greiling, Reference Mamtani and Greiling2005; Sen & Mamtani, Reference Sen and Mamtani2006; Kratinová et al. Reference Kratinová, Schulmann, Edel, Ježek and Schaltegger2007; Zak, Verner & Tycova, Reference Zak, Verner and Tycova2008; Majumder & Mamtani, Reference Majumder and Mamtani2009; Sen, Mukherjee & Collins, Reference Sen, Mukherjee and Collins2014). This technique is also useful for detecting any weak deformation event that is not observed at the outcrop scale (Stacey, Joplin & Lindsay, Reference Stacey, Joplin and Lindsay1960; Mamtani et al. Reference Mamtani, Greiling, Karanth, Merh, Radhakrishna and Piper1999; Tomezzoli, Mcdonald & Tickyj, Reference Tomezzoli, Mcdonald and Tickyj2003; Mukherji, Chaudhuri & Mamtani, Reference Mukherji, Chaudhuri and Mamtani2004; Raposo & Gastal, Reference Raposo and Gastal2009; Mamtani & Sengupta, Reference Mamtani and Sengupta2010). However, the magnetic fabric of granitic gneiss in a polydeformed terrane can be difficult to correlate with any corresponding mesoscopic fabric. In the Himalaya, interpretation of the magnetic fabric of granitoids is far from straightforward as these granitoids are usually affected by numerous post-emplacement deformation events (Jayangondaperumal, Dubey & Sen, Reference Jayangondaperumal, Dubey and Sen2010; Tripathi, Sen & Dubey, Reference Tripathi, Sen and Dubey2012; Sen et al. Reference Sen, Dubey, Tripathi and Pfänder2012). Past studies have shown that a deformed granite or granitic gneiss may give a magnetic fabric intermediate to the visible ‘S’ and ‘C’ fabric (Aranguren, Cuevas & Tubia, Reference Aranguren, Cuevas and Tubia1996; Tomezzoli, Mcdonald & Tickyj, Reference Tomezzoli, Mcdonald and Tickyj2003) or correspond to some fabric developed during a late stage of deformation (Ono et al. Reference Ono, Hosomi, Arai and Takagi2010). Therefore, for a complexly deformed terrane like the Himalaya, comparison between the magnetic fabric and the corresponding outcrop-scale magmatic or tectonic foliation is very important. The present study deals with one such granitic gneiss terrane called the Bomdila Gneiss (BG) within the Lesser Himalayan Crystallines (LHC) of the western Arunachal Himalaya. By comparing the magnetic fabric anisotropy of the BG with the corresponding outcrop-scale structures of the BG and its host LHC rocks, we have ascertained its superposed deformation history. Most importantly, our AMS analysis helped detect a late D3 event within the BG, which does not have any visible imprint in the BG at the outcrop scale and which corresponds to F3 folding seen only in the host LHC metapelites.
The Himalayan mountain chain, a distinctive example of continental–continental collision between the Indian and the Eurasian plates during Cenozoic time, preserves geodynamic imprints of continental collision (Gansser, Reference Gansser1964; Le Fort, Reference Le Fort1975). The Himalayan orogenic belt stretches between the western Himalayan syntaxis (Nanga Parbat) in the west and eastern Himalayan syntaxis (Namche Barwa) in the east. The eastern Himalayan syntaxis consists of three tectonic units: the Gangdise, Yarlung Zangbo and Himalayan units (Burg et al. Reference Burg, Nievergelt, Oberli, Seward, Davy, Maurin, Diao and Meier1998). The Gangdise unit comprises granitoid, migmatite and schist. This unit is separated from the Himalayan unit by a shear zone of metabasite and serpentinite of the Yarlung Zangbo unit. Three major tectonic units (Sub-Himalaya, Lesser Himalaya and Higher Himalaya) are recognized in the Himalayan unit (Gururajan & Choudhuri, Reference Gururajan and Choudhuri2003; Choudhuri, Gururajan & Bikramaditya Singh, Reference Choudhuri, Gururajan and Bikramaditya Singh2009). Detailed field investigations reveal that the major tectonic units of the Himalaya were affected by several phases of deformational events related to the Himalayan orogeny (Gansser, Reference Gansser1964; Le Fort, Reference Le Fort1975). On a regional scale, the LHC occur all along the 2000 km length of the Lesser Himalaya belt, showing different phases of deformation events due to folding and thrusting (Thakur, Reference Thakur1998; Singh & Jain, Reference Singh, Jain and Singh2003; Yin, Reference Yin2006; Yin et al. Reference Yin, Dubey, Kelty, Webb, Harrison, Chou and Celerier2010). The LHC of the western Arunachal Himalaya is extensively covered by the granitoids locally known as the Bomdila Gneiss. It shows mylonization and bears a ductile deformation zone in the Lesser Himalaya, which is termed the Bomdila mylonitic zone (Gururajan & Choudhuri, Reference Gururajan and Choudhuri2003; Bikramaditya Singh & Gururajan, Reference Bikramaditya Singh and Gururajan2011). Development of penetrative foliation in association with down-dipping stretching lineation during the second phase of deformation (D2) is the prominent structure of the BG. However, there is not much regional evidence for the existence of later phases of deformation in the BG, and it is difficult to identify their superposed deformation history owing to the absence of such structures like fold interference patterns at the outcrop scale. Integration of AMS data with outcrop-scale structural features enables us to envisage the kinematic evolution of the BG in terms of multiple deformation events and helps us propose a tectonic model for the same.
2. Geological setting
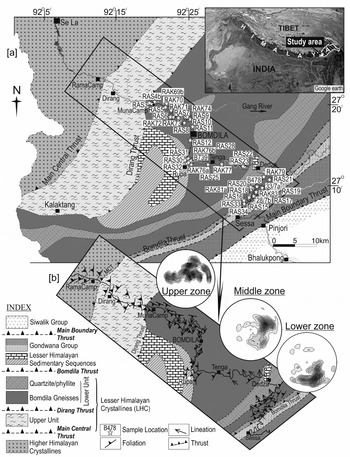
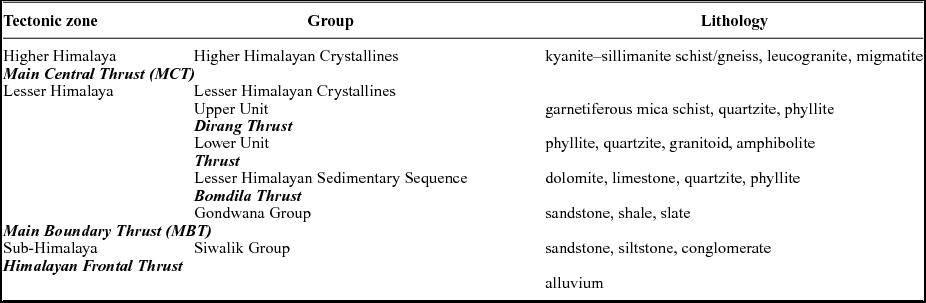
The geology of the western Arunachal Pradesh in the eastern Himalaya is characterized by a number of thrust sheets and has been discussed by previous workers (Verma & Tandon, Reference Verma and Tandon1976; Bhushan, Bindal & Aggarwal, Reference Bhushan, Bindal and Aggarwal1991; Kumar, Reference Kumar1997). From south to north, three major tectonic units have been identified as the Sub-Himalaya, Lesser Himalaya and Higher Himalaya (Fig. 1a; Table 1). The Sub-Himalaya is represented by a thick sequence of Siwalik sedimentary rocks, which has a faulted contact (Himalayan Frontal Thrust) with Brahmaputra alluvium in the south and a narrow belt of Gondwana Group rocks (sandstone, black shale and slate) exposed along the Main Boundary Thrust (MBT) in the north. Conversely, the Lesser Himalaya dominantly consists of low- to medium-grade metamorphic rocks of the LHC with a minor portion of the Lesser Himalayan Sedimentary Sequence and Gondwana Group. It is observed that the LHC overlies the Gondwana Group along the Bomdila Thrust, which is thrust over by the Higher Himalayan Crystallines along the Main Central Thrust (MCT). Based on the lithological assemblages, the LHC is subdivided into a Lower unit and Upper unit (Bikramaditya Singh & Gururajan, Reference Bikramaditya Singh and Gururajan2011). The Lower unit comprises dominantly quartzo-feldspathic gneisses known as the Bomdila Gneiss, meta-granite, quartzite, phyllite and amphibolite, whereas the Upper unit consists mainly of garnet–staurolite schist, quartzite, phyllite and tremolite–actinolite marble. The Upper unit and the Lower unit of the LHC are separated by the Dirang Thrust (Fig. 1a). Srivastava et al. (Reference Srivastava, Srivastava, Srivastava and Singh2011) established four deformation events from the Upper unit of the LHC and grouped them into three categories of early-, middle- and late-phase structures, while Sarma et al. (Reference Sarma, Bhattacharjee, Nandy, Konwar and Mazumdar2014) classified the deformation events of the western Arunachal Himalaya into pre-, syn- and post-Himalayan episodes. In the study area, particularly at Rupa, the Lesser Himalayan sedimentary sequence is exposed as a semicircular outcrop that occurs in the core of a synform named the Rupa synform (Fig. 1a) (Srinivasan, Reference Srinivasan2001). It is tectonically delimited by the BG in the southern part and by metapelites of the LHC in the northern part. The BG has the affinity of an S-type granite that converted into gneiss during the Himalayan orogeny and is dated to ~1900 Ma (Dikshitulu et al. Reference Dikshitulu, Pandey, Krishna and Dhana Raju1995; Rashid, Reference Rashid, Ahmad, Hirsch and Charusiri2009; Bikramaditya Singh, Reference Bikramaditya Singh2010; Yin et al. Reference Yin, Dubey, Kelty, Webb, Harrison, Chou and Celerier2010). The BG is well exposed, and is bounded by the Bomdila Thrust at the base and the Dirang Thrust at the top. It is considered that the whole body of the BG is penetratively deformed and represents a broad zone of ductile deformation characterized by the Bomdila mylonitic zone (Bikramaditya Singh & Gururajan, Reference Bikramaditya Singh and Gururajan2011). A superposed structural pattern of the later phase of deformation in the BG is rarely observed at the small scale (Sarma et al. Reference Sarma, Bhattacharjee, Nandy, Konwar and Mazumdar2014). The Higher Himalaya mainly comprises high-grade metamorphic rocks of the Higher Himalayan Crystallines with younger intrusions of tourmaline-bearing leucogranite.
Geological map of the western Arunachal Himalaya showing (modified after Verma & Tandon, Reference Verma and Tandon1976; Bhushan, Bindal & Aggarwal, Reference Bhushan, Bindal and Aggarwal1991) (a) location of the representative AMS samples, (b) S2 foliation and L2 lineation in the study area; structural orientations of S2 are also shown in lower hemisphere equal-area density stereographs.

Generalized geological set-up of western Arunachal Pradesh
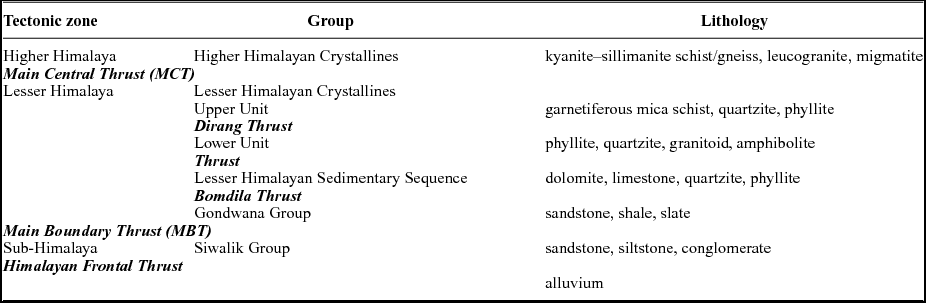
Modified after Verma & Tandon (Reference Verma and Tandon1976); Bhushan, Bindal & Aggarwal (Reference Bhushan, Bindal and Aggarwal1991); Kumar (Reference Kumar1997)
3. Structural patterns
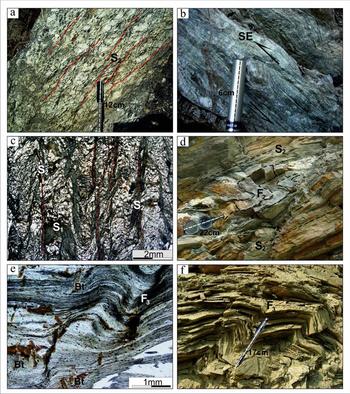
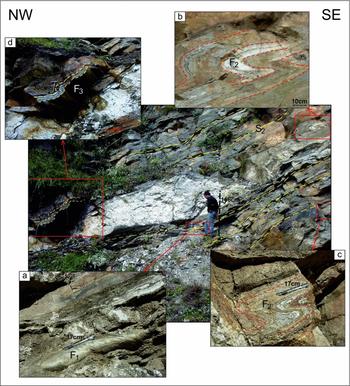
The prominent features of the BG are the development of a penetrative mylonitic foliation associated with a down-dipping stretching lineation, whereas the intensity of deformation is heterogeneous (Fig. 2a). In places, minor shear zones consisting of ultramylonite with asymmetric augens are well preserved, which suggest the LHC is internally deformed and imbricated (Fig. 2b). The S–C fabrics, oblique shear bands and asymmetric augen feldspars of various shapes and sizes are observed in the BG (Fig. 2b). The LHC has undergone three phases of deformation, which are referred to as D1, D2 and D3. The first phase of deformation (D1) produced F1 folds, which are small-scale tight isoclinal, reclined to recumbent folds. F1 is preserved as intrafolial or rootless folds at the exposure level and is also identified under the microscope as rootless folds within the penetrative S2 schistosity (Fig. 2c). These F1 folds are mainly represented by the mesoscopic folds with their axial plane trending NNE–SSW to NE–SW and their hinge plunging towards the down-dip direction of the foliation planes, which indicate the rotation of fold hinges during later shearing (Fig. 3). Large-scale structures of D1 have not been observed in the area as it might have been obliterated by a later phase of deformation. Under the microscope, the relict S1 foliation related to F1 folding is identified as crenulation or small rootless folds essentially marked by muscovite and biotite in the quartz-rich microlithons within the S2 schistosity or as curved/straight quartz inclusion trails in garnet porphyroblasts in the micaceous rocks of the Upper unit of the LHC (Fig. 2c). The existence of pre-Himalayan deformation in the LHC of the western Arunachal Himalaya that was destroyed or obliterated during the Himalayan orogeny has been reported (Srivastava et al. Reference Srivastava, Srivastava, Srivastava and Singh2011; Saha, Reference Saha2013; Sarma et al. Reference Sarma, Bhattacharjee, Nandy, Konwar and Mazumdar2014). The second phase of deformation (D2) is the most prominent structural feature observed in the area. The S2 foliation represents the regional schistosity/foliation (Fig. 3). The S2 foliation in the BG is defined by the alignment of micas wrapping around the feldspar porphyroclasts (Fig. 2a). Towards the south of Bomdila, the S2 mainly trends from ENE–WSW to NE–SW with a moderate dip towards the NW, while north of Bomdila, the S2 has a NW–SE trend that dips towards the SW (Fig. 1b). Under the microscope, the S2 schistosity is recognized as crenulation cleavage developed from the early S1 (Fig. 2c). The F2 folds are mostly tight isoclinal upright to overturned folds and are essentially co-axial with the F1 folds (Fig. 3). The trend of the axial plane of the F2 folds is generally ENE–WSW. They are mostly asymmetric shear-related folds that indicate the direction of tectonic transportation of the LHC thrust sheet along the Bomdila Thrust (Fig. 2d). Shear-sense indicators like S–C fabric, asymmetrical feldspar porphyroclasts, quartz pressure shadows around K-feldspar porphyroclasts along with microscopic shear folds observed in the LHC indicate a top-to-the-SE shear sense (Fig. 2b). The L2 lineation observed in the LHC is the most prominent lineation in the area. The general trend of the lineation is NW–SE and plunging in the down-dip direction (NW) at various angles, while the lineations near to the Dirang Thrust plunge towards the SW. The third phase of deformation (D3) produced open folds of regional extent and cross-folded all the pre-existing structures of D1 and D2 (Fig. 3). D3 was probably initiated during or after Late Miocene time as the MCT in the western Arunachal Himalaya was active at around 10 Ma (Yin, Reference Yin2006; Srivastava et al. Reference Srivastava, Srivastava, Srivastava and Singh2011). The associated S3 foliation is also recognizable under the microscope as a crenulation cleavage. The late-stage growth of chlorite, muscovite and biotite cross-cutting the S2 mark the axial plane of the S3 crenulations (Fig. 2e). The third phase of folds (F3) are mostly open type and represented by domes and basin structures on a large scale. In places, the F3 folds are represented by small-scale kink and chevron folds (Fig. 2f). The fold axes of the F3 folds are NNW–SSE- or NW–SE-trending with minor variation of their plunge (10–20°) towards either the NE or SW.
Field photographs of the BG showing (a) development of foliation with asymmetric augen feldspars and (b) ultramylonite with asymmetric augen feldspar that indicate a top-to-the-SE sense of shear. (c) Photomicrograph showing the development of two schistosities (S1 and S2) in Lesser Himalayan metapelite. (d) Field photograph showing F2 folds characterized by a recumbent fold in quartzite of the LHC. (e) Photomicrograph of Lesser Himalayan metapelite showing development of biotite (Bt) at S2 crenulation, suggesting its growth during F3 folding. (f) Field photograph showing F3 folds characterized by a kink fold in phyllite of the LHC.

Field photographs of Higher Himalayan Crystallines showing different types of folding with S2 foliation. Inset photographs showing (a) fold hinge of F1 recumbent fold, (b, c) F2 tight isoclinal recumbent fold and (d) F3 open fold.

4. Anisotropy of magnetic susceptibility
4.a. Analytical techniques
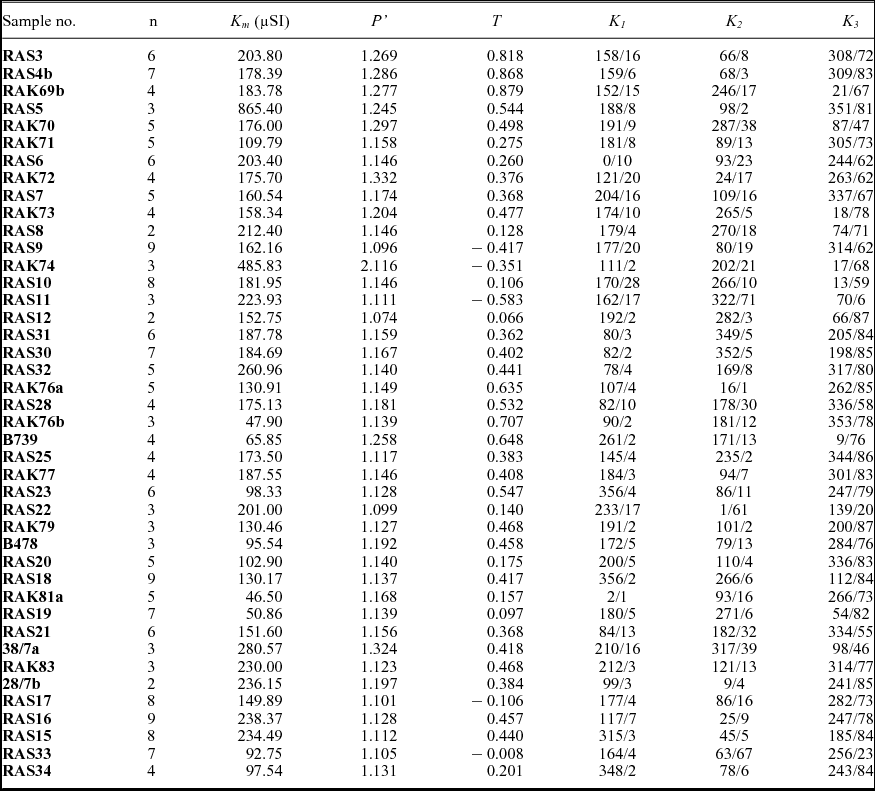
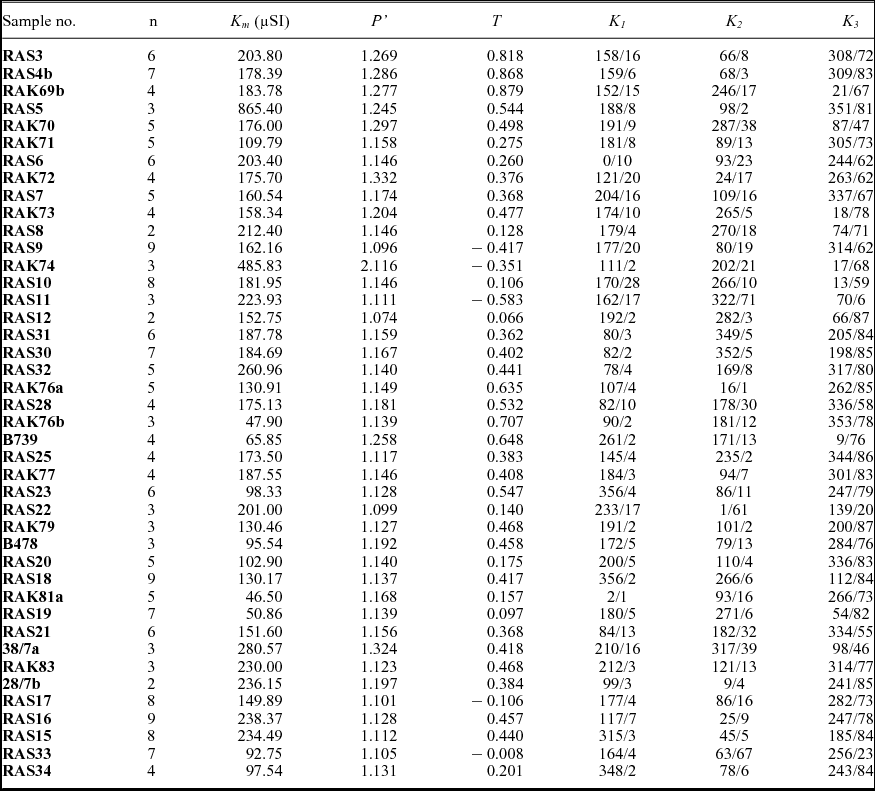
AMS analyses of the representative samples of the BG were measured with a KLY-3S Kappabridge (Agico, Czech Republic) at the Wadia Institute of Himalayan Geology, Dehradun. A total of 290 oriented cylindrical cores having a standard size of 25.4 mm in diameter and 22 mm in height were obtained for AMS analysis from 42 oriented block samples collected from the Bomdila mylonitic zone (Fig. 1a). The orientation and magnitude of the three principal axes of the magnetic susceptibility ellipsoid (K1 ≥ K2 ≥ K3) were determined. Magnetic susceptibility and isothermal remanent magnetization (IRM) analyses were also carried out on Bartington Instruments equipment at the Department of Geology, University of Pune, India for six selected samples to identify the magnetomineralogy of the BG. The results obtained from the Kappabridge (KLY-3S) analyses are expressed in terms of volume susceptibility as it focuses upon the geometric elements, while the data from the Bartington analyses are presented in mass susceptibility as it needs mass normalization to evaluate the ferrimagnetic concentration and the grain-size dependency of susceptibility. The magnitudes of the three principal axes of the magnetic susceptibility ellipsoid were used in the following recommended equations to calculate different parameters such as the mean magnetic susceptibility (Km), degree of magnetic anisotropy (Pʹ) that measures the eccentricity of the magnetic susceptibility ellipsoid and shape parameter (T). The shape is oblate when T > 0 or prolate for T < 0, and the susceptibility ellipsoid has a triaxial shape when T = 0. The magnetic lineation and pole to the magnetic foliation are parallel to K1 and K3, respectively. The SUSAR program that runs the AMS measurements from the KLY-3S Kappabridge was used to calculate the above parameters, and the average AMS data are presented in Table 2.
-
(i) Km= (K1+K2+K3)/3 (Tarling & Hrouda, Reference Tarling and Hrouda1993)
-
(ii) P΄ =
 $\exp \sqrt {2[{{({\eta _1} {-} {\eta _{\rm{m}}})}^2} {+} {\rm{ }}{{({\eta _2} {-} {\eta _{\rm{m}}})}^2} {+} {\rm{ }}{{({\eta _3} {-} {\eta _{\rm{m}}})}^2}]} $
(Jelinek, Reference Jelinek1981)
Where η1 = lnK1, η2 = lnK2, η3 = lnK3 and
${\eta _{\rm{m}}} = \sqrt[3]{{( {{\eta _1}\cdot{\rm{ }}{\eta _2}\cdot{\rm{ }}{\eta _3}} )}}$
-
(iii) T = [2 In(K1/K2)/In(K1/K2)] − 1 (Jelinek, Reference Jelinek1981)


AMS data of the Bomdila Gneiss (BG), Arunachal Himalaya
4.b. Magnetomineralogy
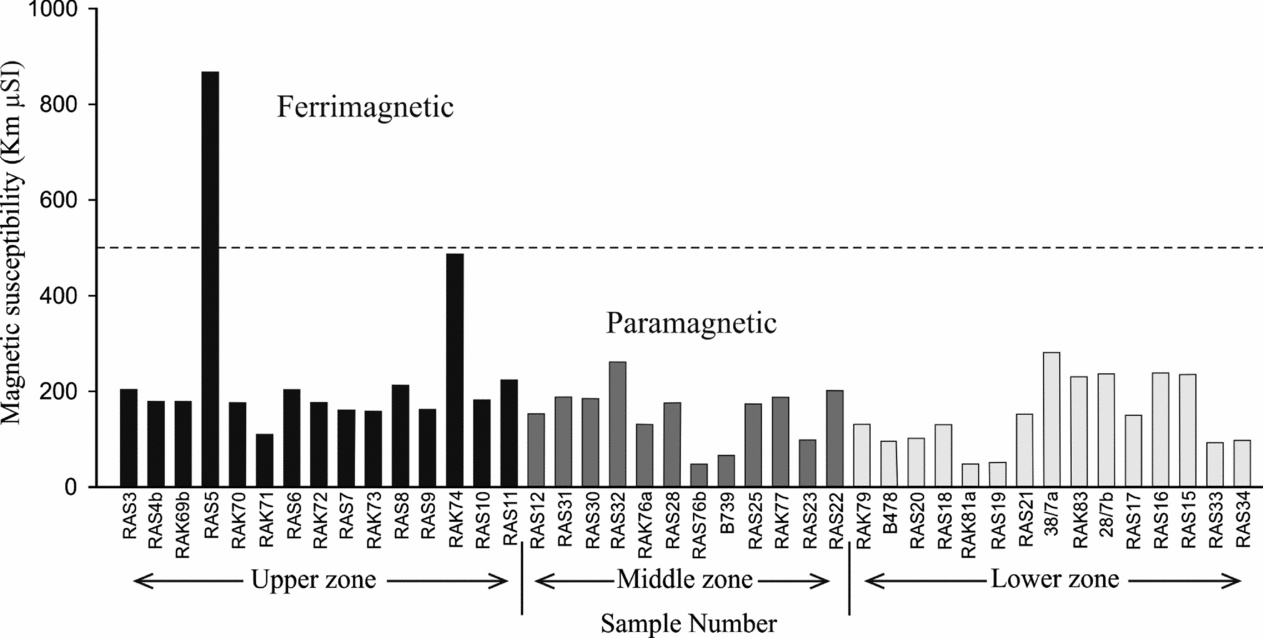
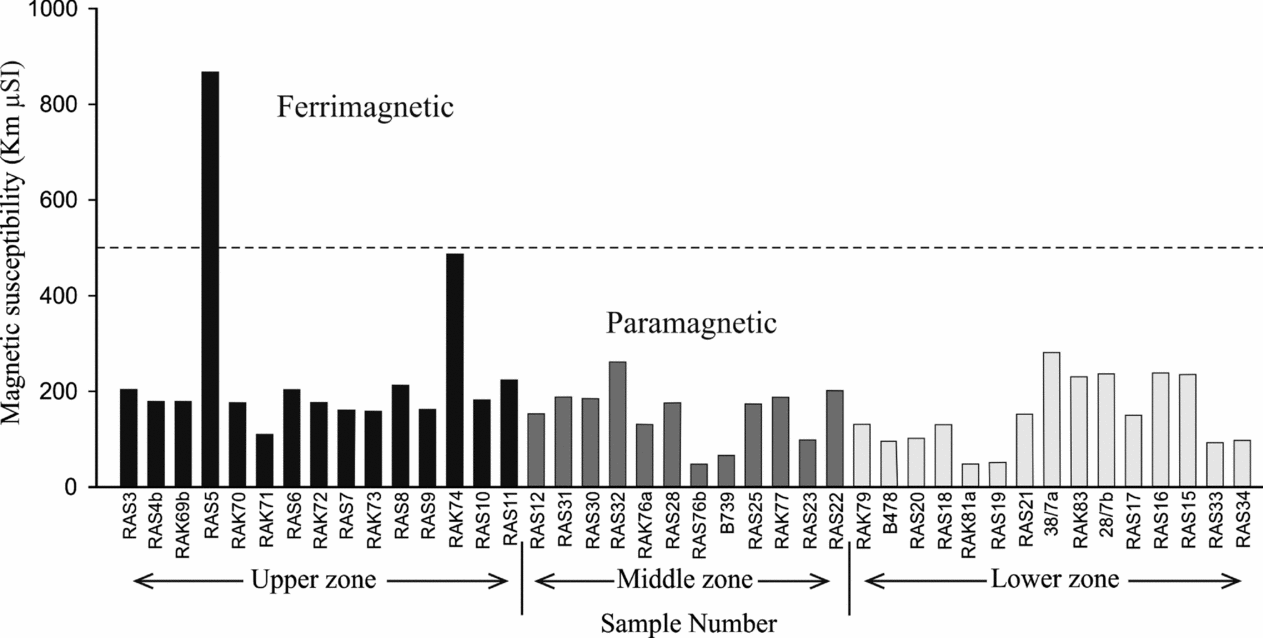
Based on the mean magnetic susceptibility (Km) value, the minerals that control the magnetic fabric of granitic rocks can be classified as ferrimagnetic minerals (magnetite), with Km values greater than 500 µSI, or paramagnetic minerals (mica, chlorite, etc), with Km values less than 500 µSI (Bouchez, Reference Bouchez, Bouchez, Hutton and Stephens1997). The AMS data show that all the BG samples have Km values less than 500 µSI, ranging from 47 to 486 µSI; these are typical paramagnetic granitoids except for one sample (RAS5 = 865) (Table 2; Fig. 4). It is also confirmed that the BG contains biotite as the main paramagnetic mineral.
Binary diagram of magnetic susceptibility v. sample to distinguish dominance of paramagnetic and ferrimagnetic minerals in the representative samples.
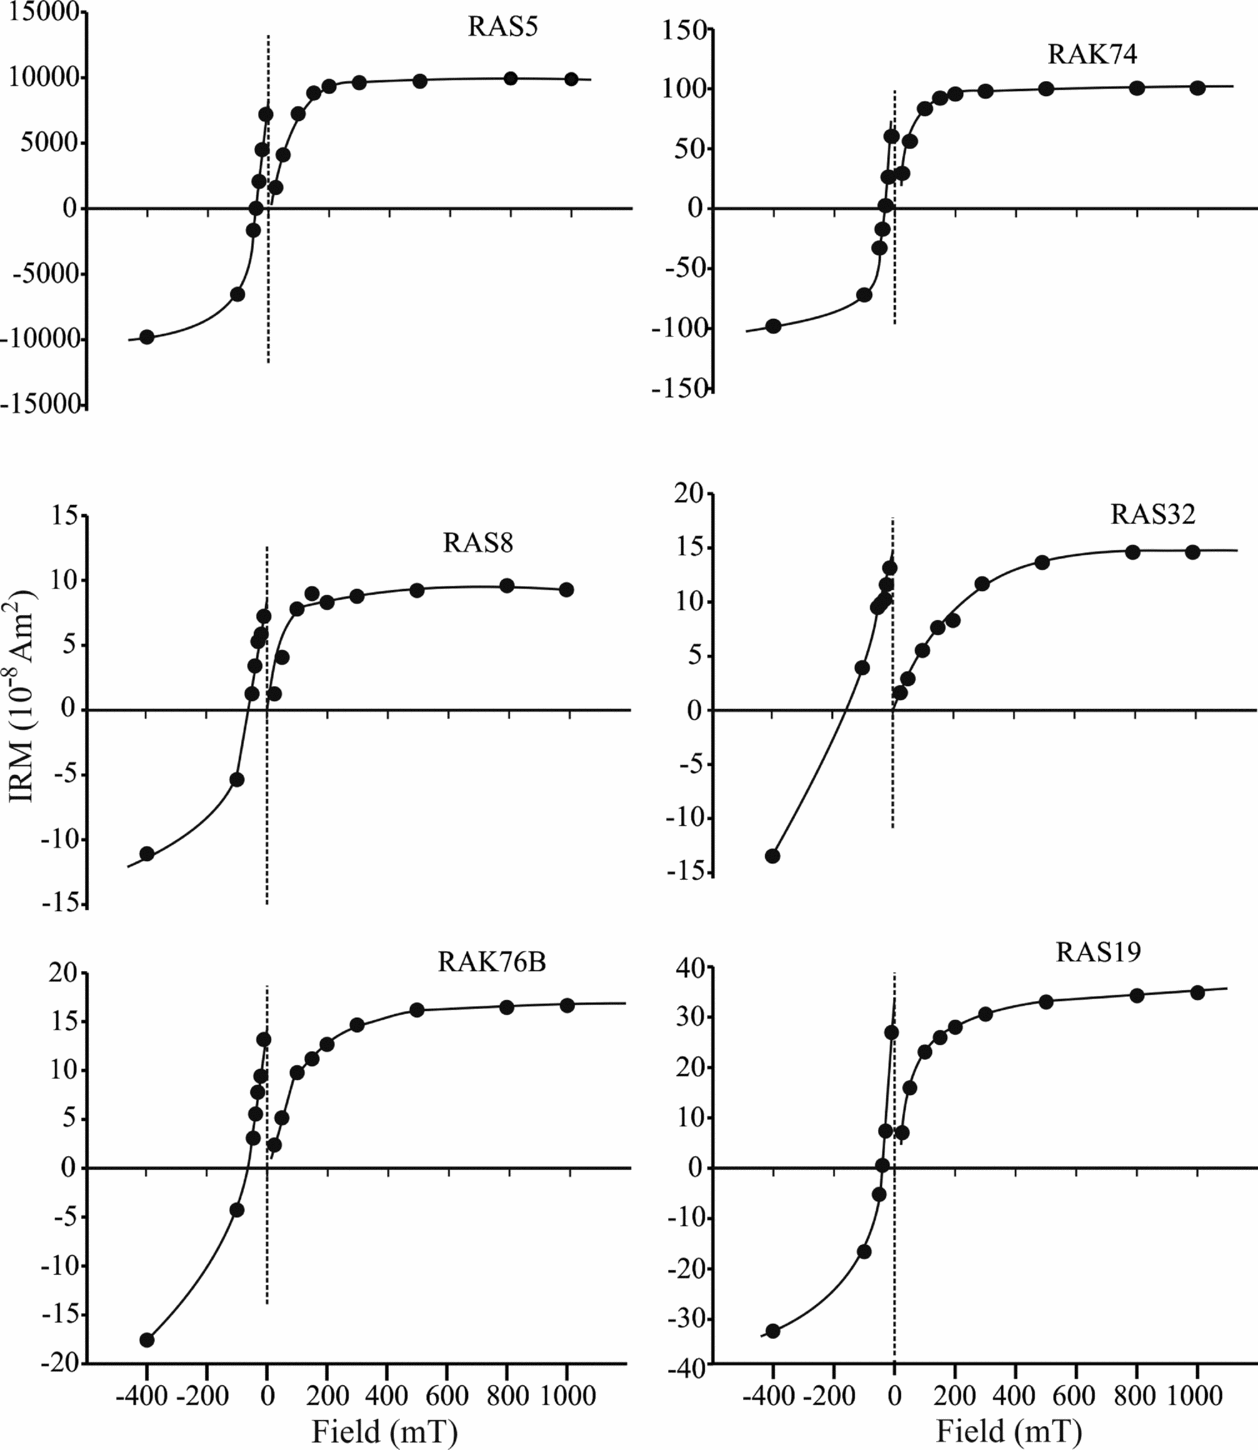
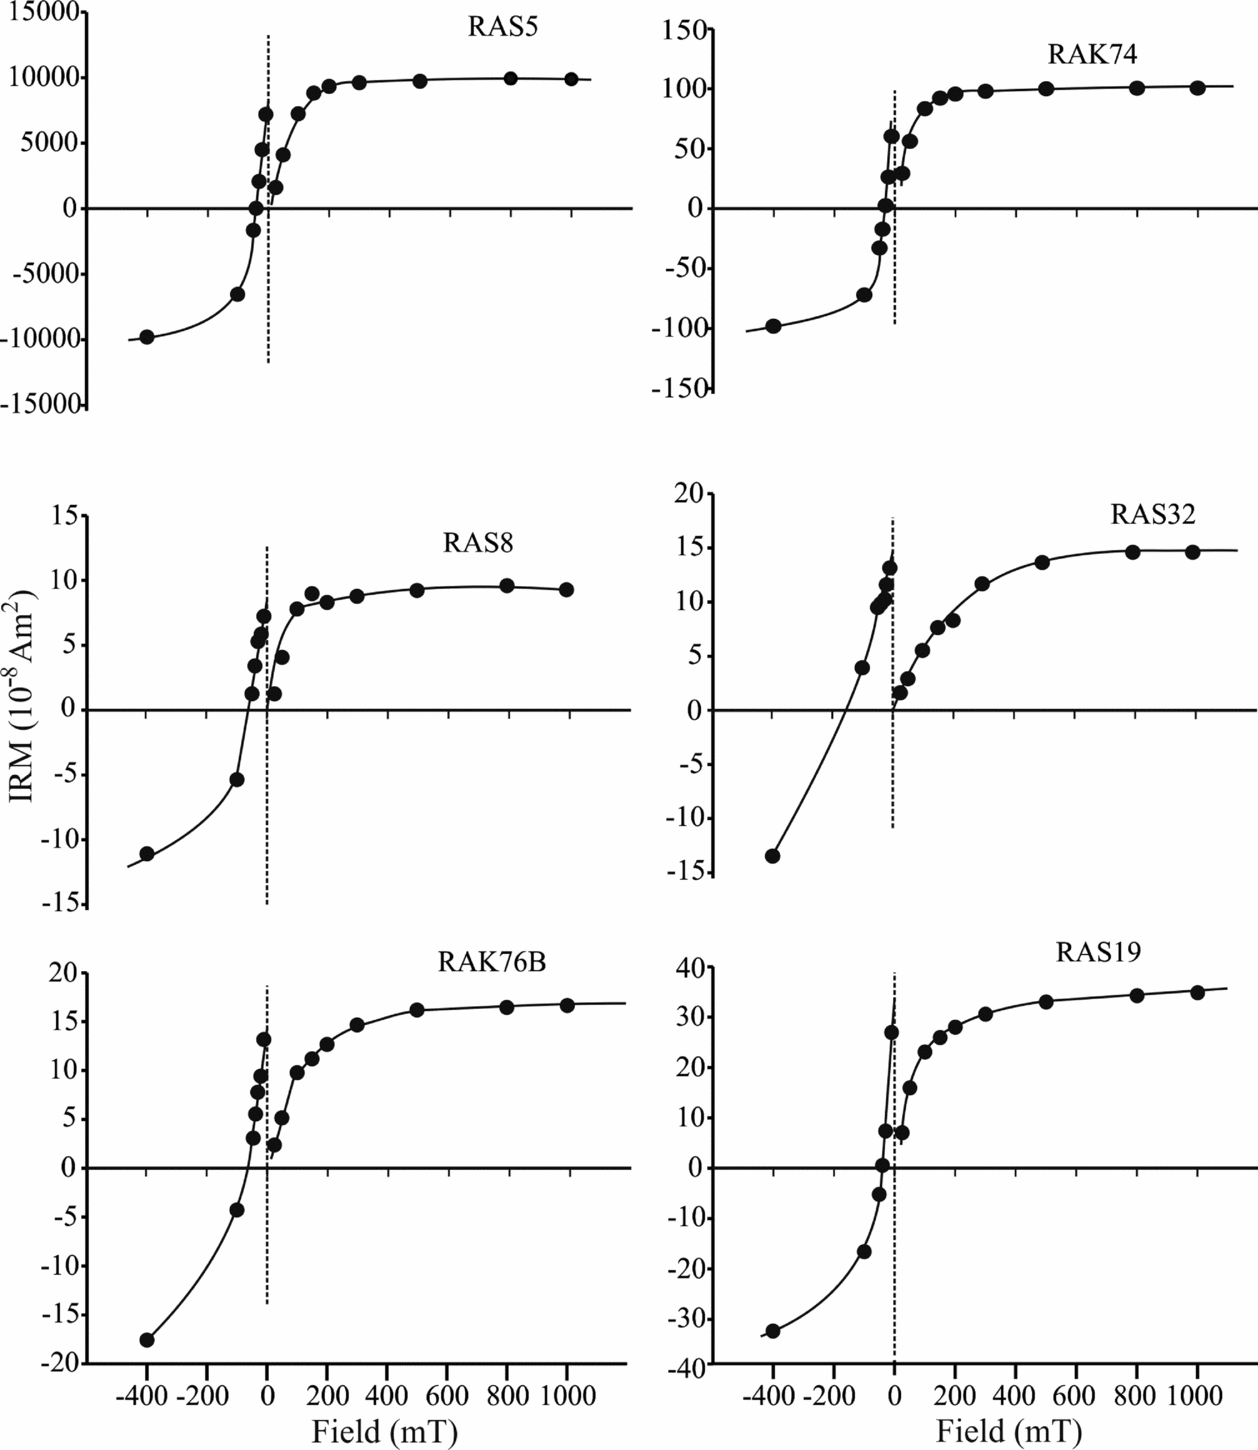
Most of the susceptibility and IRM data from the analysed samples show low susceptibility (Xlf) ranges from 0.11 to 1.08×10⁻⁸ m3 kg−1 with low SIRM (0.34 to 3.8×10⁻⁵ Am2 kg−1), while RAS5 has a high Xlf (9.56×10⁻⁸ m3 kg−1) and SIRM (330×10−5 Am2 kg−1) (Fig. 5). These data also suggest the dominance of paramagnetic minerals in all analysed BG samples except RAS5, which shows a ferrimagnetic mineral concentration.
Isothermal remanent magnetization (IRM) curves for the representative BG samples.
4.c. Parameters of magnetic anisotropy
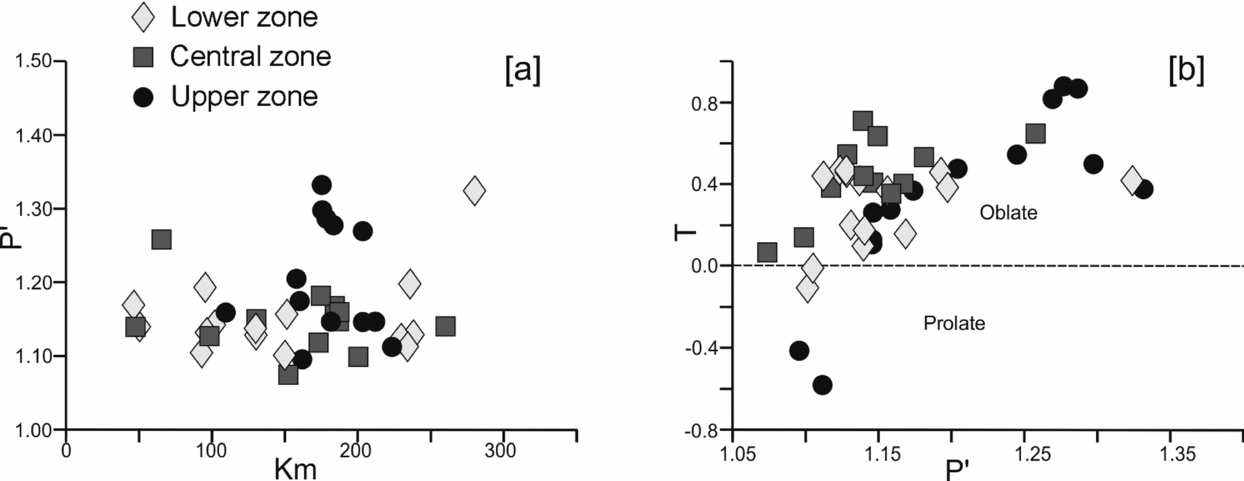
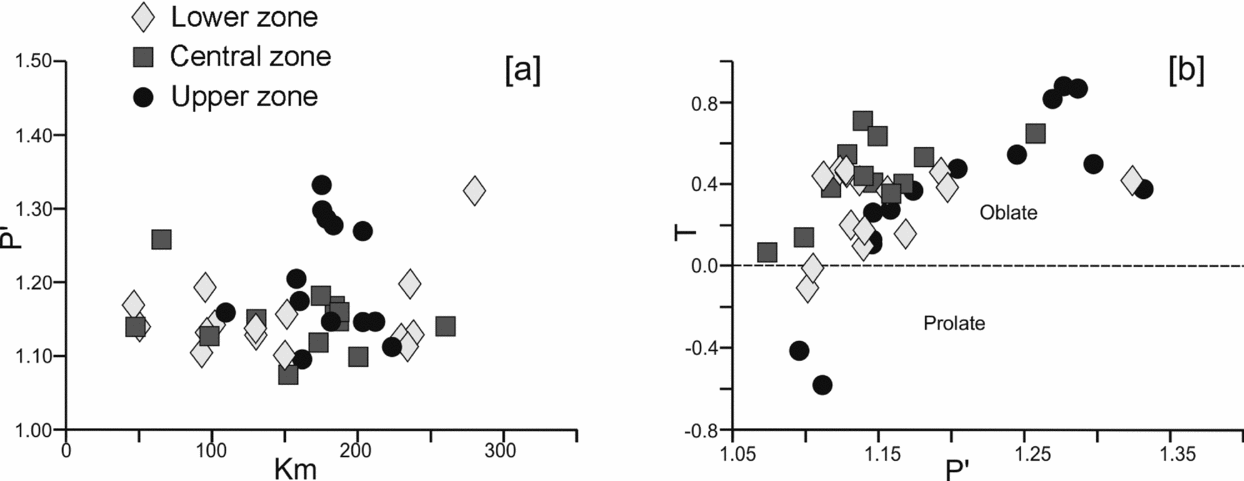
The degree of magnetic anisotropy (Pʹ) values range from 1.074 to 2.116. The BG samples from the upper structural level near to the Dirang Thrust have higher values of > 1.2 and most of the samples from the lower structural level have values < 1.2. In the Pʹ v. Km diagram, the BG samples are mostly scattered and do not exhibit any linear trend suggesting that the AMS fabric is not governed by magnetic minerals (Rochette, Reference Rochette1987; Borradaile & Henry, Reference Borradaile and Henry1997) and the degree of magnetic anisotropy is not controlled by the magnetic susceptibility (Fig. 6a). This indicates that factors other than mineralogy control the AMS (Mukherji, Chaudhuri & Mamtani, Reference Mukherji, Chaudhuri and Mamtani2004). Samples proximal to the Dirang Thrust and one ultramylonitized sample (28/7b) collected near the Bomdila Thrust have higher Pʹ values, while other samples have low Pʹ values. This is in agreement with the microstructural features that suggest increased intensity of deformation in the vicinity of the Dirang Thrust and Bomdila Thrust. Most of the samples have T > 0.25 and fall in the oblate field on the Jelinek diagram, which suggests a strong flattening fabric in the entire Bomdila mylonitic zone (Fig. 6b).
(a) Diagram showing relationship between Km and Pʹ of the BG; (b) Jelinek plot (T v. Pʹ) showing shape and eccentricity of ellipsoid of the BG samples.
4.d. Magnetic fabric
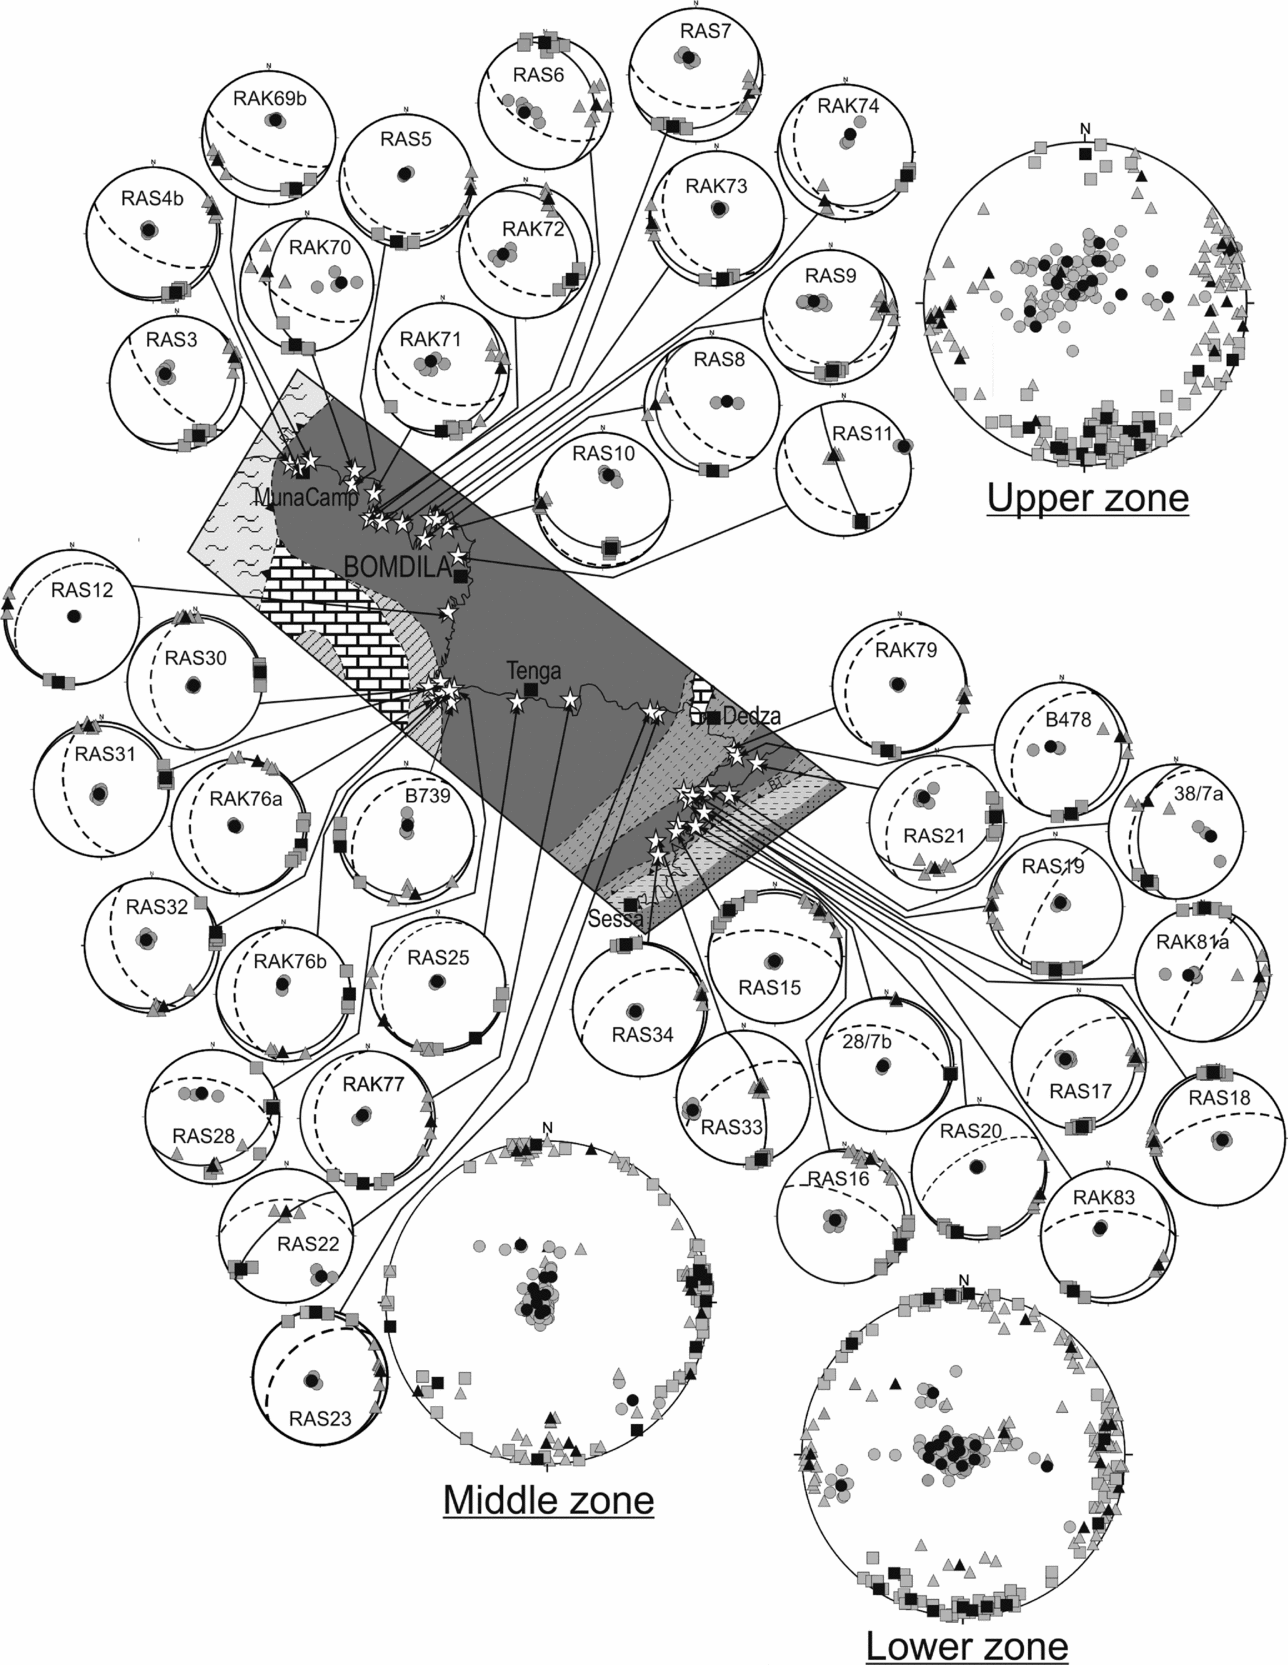
Based on the location of the samples for AMS analysis, we have divided the entire region into three sectors, namely, lower, middle and upper zones. The magnetic fabrics of the samples from each zone are described in this section. Lower hemisphere equal-area projections showing the distribution of K1, K2 and K3 along with the magnetic foliation (K1–K2 plane) and mesoscopic foliation are provided for each of the 42 samples (Fig. 7).
Lower hemisphere equal-area projections of K1 (grey square), mean K1 (black square), K2 (grey triangle), mean K2 (black triangle), K3 (grey circle) and mean K3 (black circle) showing patterns of the magnetic foliation and lineation of the BG in the Bomdila mylonitic zone; solid line girdle shows the K1–K2 plane (magnetic foliation) and dashed girdle shows field foliation (S2).
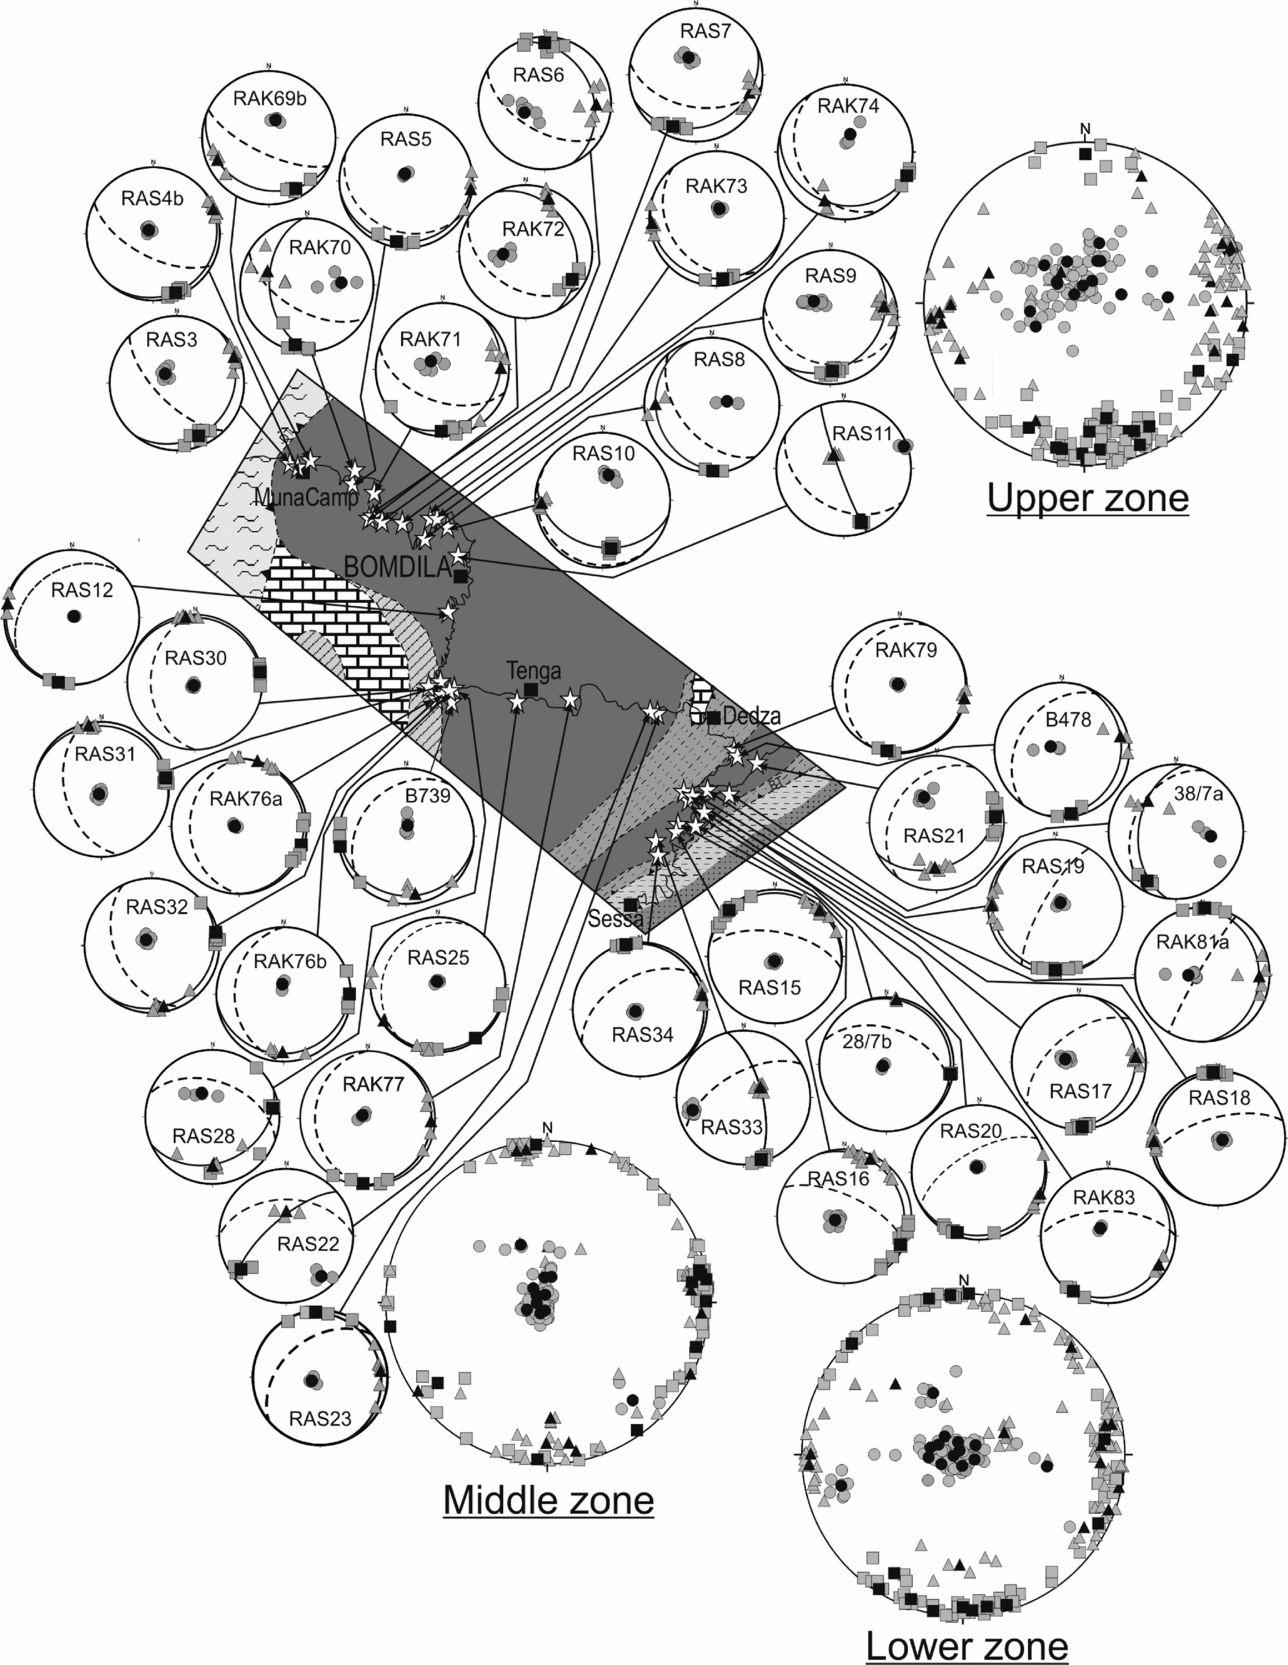
Magnetic foliation in the northern upper structural level and the central part of the Bomdila mylonitic zone has a dominantly NW–SE trend with a gentle to moderate dip towards the NE or SW (Fig. 7). It is parallel to the axial plane of the F3 folds observed mostly in the metapelites of the LHC. In the southern lower structural level, the dip of the magnetic foliation is much gentler and mostly towards the NE or SE and showing a NW–SE or NE–SW trend (Fig. 7). The trend of the magnetic lineation in the lower zone varies from SE to SW with a gentle plunge. In the upper zone, the magnetic lineation is mostly sub-horizontal and dominantly plunging towards the SE (Fig. 7).
Based on the relationship between the mesoscopic foliation, magnetic foliation and magnetic lineation, the samples are classified into four categories: type-A (magnetic and mesoscopic foliation intersecting at a low angle or ‘concordant’ and K1 at the intersection of these two foliations), type-B (magnetic and mesoscopic foliation intersecting at a low angle but K1 not at the intersection of these two foliations), type-C (magnetic and mesoscopic foliation intersecting at a high angle or ‘discordant’ but K1 at the intersection of these two foliations) and type-D (magnetic and mesoscopic foliation intersecting at a high angle and K1 not at the intersection of these two foliations).
4.d.1. Upper zone
The upper zone occurs at the footwall of the Dirang Thrust and lies in between Bomdila and Munacamp. The mesoscopic foliation trends in a NW–SE direction with a moderate SW dip (Fig. 1b). The magnetic foliation varies from NE–SW to NW–SE and intersects the corresponding mesoscopic foliation both at low and high angles. Out of 15 samples, two samples fall into the type-A category (RAS11, RAK73), four in type-B (RAS8, RAS10, RAK69b, RAK74), three in type-C (RAS3, RAS9, RAK72) and six in type-D (RAS4B, RAS5, RAS6, RAS7, RAK70, RAK71). The magnetic lineation is mostly sub-horizontal and plunging towards the south.
4.d.2. Middle zone
The middle zone is marked between Dedza to the south and Bomdila to the north. The azimuths of the mesoscopic foliation are NW–SE with a SW dip, which is similar to the mesoscopic foliation trend in the upper zone. The magnetic foliation varies from NE–SW to NW–SE with a gentle SE or NW dip that intersects the mesoscopic foliation at a high angle, with nine samples of type-D and two samples of type-C (RAS28, RAS77), accept for RAS12 where the magnetic and mesoscopic foliation intersect each other at a low angle (type-B). The magnetic lineation shows a gentle plunge in mostly the SE to NE direction.
4.d.3. Lower zone
The lower zone represents the basal part of the Bomdila mylonitic zone demarcated by the Bomdila Thrust at the bottom and extends roughly up to Dedza in the northwest. The mesoscopic foliation trends on a NE–SW strike with a gentle to moderate dip towards a NW direction. It is parallel to the regional trend of the Bomdila Thrust. The magnetic foliation intersects the mesoscopic foliation at both high and low angles, having a trend in a NW–SE or NE–SW direction with a gentle to moderate dip mostly towards the NE or SE. Out of 15 samples, eight samples are of type-D, two samples of type-A (RAS16, 28/7b) and four of type-B (RAS15, RAS18, RAS19, 38/7a) with only one sample (RAK79) showing a type-C pattern. The magnetic lineation is mostly horizontal and plunging to the SE or SW.
5. Discussion
5.a. Magnetic fabric and regional tectonics
The regional deformation history of the LHC in the western Arunachal Pradesh has been established based on the structural data collected from outcrop. The LHC underwent three phases of deformation, and the structural features developed during the second phase of deformation (D2) are prominent throughout the area. The trend of the S2 foliation defined by alignment of mica in the BG is generally ENE–WSW with a moderate dip towards the NW in the lower zone, while S2 has a NW–SE trend dipping towards the SW in the upper zone. It is similar to the axial plane trend of the F2 folds. The general trend of the L2 lineation in the lower zone is NW–SE and mostly plunging in the down-dip direction (NW), while the lineation in the upper zone has a trend of N–S plunging towards the SW. The different trends of S2 and L2 in the lower and upper zones of the Bomdila mylonitic zone are due to a later phase of folding. The field data for S2 from the Bomdila mylonitic zone suggest that the BG is folded as an open fold represented by dome and basin structures on a large scale. However, there is not much regional evidence for the existence of D3 in the BG and it is difficult to identify its superposed deformation history owing to the absence of superimposed structures at the outcrop scale (Sarma et al. Reference Sarma, Bhattacharjee, Nandy, Konwar and Mazumdar2014). Axial planar fabrics related to F3 are not observed in the BG at the outcrop scale.
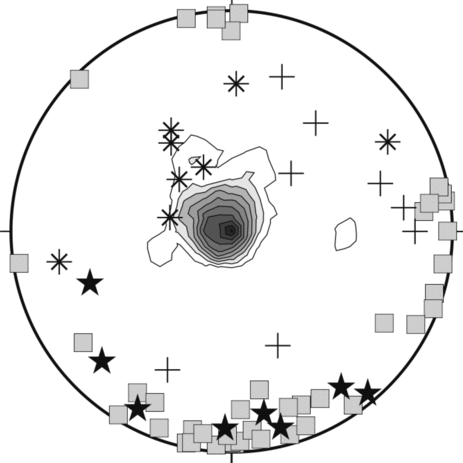
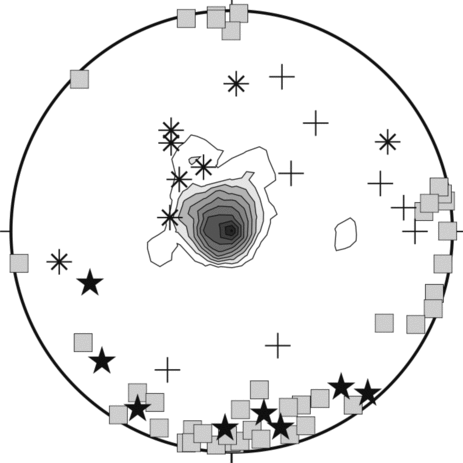
AMS data for the BG suggests a magnetic fabric developed in the BG that is not directly correlatable with any mesoscopic foliation. Most of the magnetic lineations (K1) of the BG plunge gently to the SE, with some orientation variation from SW to NE in the middle and lower zones (Fig. 8). The orientation of the magnetic foliation and magnetic lineation recorded in the BG is similar to the axial planar direction and fold axis of the mesoscopic F3 folds observed in the metasedimentary rocks of the LHC (Fig. 8). Past studies have shown that granite gneiss or mylonites can develop a magnetic fabric that may not correspond to its mesoscopic foliation. The magnetic foliation may define an intermediate plane in between the ‘S-’ and ‘C-plane’ (Aranguren, Cuevas & Tubia, Reference Aranguren, Cuevas and Tubia1996; Tomezzoli, Mcdonald & Tickyj, Reference Tomezzoli, Mcdonald and Tickyj2003) or may mimic a fabric that has developed during a late stage of progressive deformation (Ono et al. Reference Ono, Hosomi, Arai and Takagi2010). Sen et al. (Reference Sen, Dubey, Tripathi and Pfänder2012) have shown large variations in the relationship between the magnetic and corresponding mesoscopic foliation for the Lesser Himalayan Proterozoic granitic gneisses of the Himachal Himalaya. They suggested superposed folding of non-cylindrical folds due to large variation in fold hinge line trends as a possible cause for the development of a composite magnetic and outcrop-scale fabric. Some samples from the present study show a similarity of the magnetic and mesoscopic foliation with the magnetic lineation demarcating the intersection between these two foliation planes. The orientation of the magnetic lineation along the intersection of the two planes is one important aspect of a composite fabric (Housen, Richter & Van der Pluijm, Reference Housen, Richter and Van der Pluijm1993) and suggests superposed deformation. We also obtained a magnetic fabric having a discordant relationship with the corresponding outcrop-scale fabric and no similarity between K1 and the intersection lineation. However, the overall pattern of the magnetic fabric suggests a striking similarity to the outcrop-scale fabric developed axial planar to the F3 folds observed in the adjacent country rocks (LHC) of the BG. This indicates that the magnetic fabric mimics a foliation developed owing to late deformation caused by superposed folding. Most of the samples produce an oblate shape of the AMS ellipsoid, which indicates flattening strain. Development of the magnetic fabric parallel to the axial plane direction is inferred as owing to layer-parallel shortening (Mamtani & Sengupta, Reference Mamtani and Sengupta2010). The AMS analysis we carried out in the BG has two significant aspects: (1) it helps detect a late-stage deformation event, which is only observed in the adjacent host rocks and not discernible in the BG at the outcrop scale, and (2) the distribution of the axes of the magnetic susceptibility ellipsoid and their relationship with the mesoscopic foliation indicate superposed folding in the BG.
Lower hemisphere equal-area projection showing density stereograph of magnetic foliation (K3) with correlation of the magnetic lineation K1 (grey square) and fold axes of F3 (star), F2 (asterisk) and F1 (plus); some of the fold axis data are from Verma & Tandon (Reference Verma and Tandon1976).
5.b. Tectonic evolution of the superposed deformation in the Bomdila Gneiss
Based on the microstructural features of the BG, Bikramaditya Singh & Gururajan (Reference Bikramaditya Singh and Gururajan2011) proposed that the early ductile deformation in the BG was superimposed by brittle deformation during the exhumation of the LHC towards shallow structural levels from a deeper level. The presence of high-temperature deformation microstructures like recrystallized quartz with partially or completely recrystallized feldspars in the BG from the upper zone suggests that the BG was buried or underthrust at a deeper level below the Higher Himalayan Crystallines at an early stage. As the thrust propagated towards shallow structural levels, the initial ductile deformation was overprinted by brittle–ductile to brittle deformation. The temperature of deformation increases from the lower to the upper zone as the lower zone deforms dominantly in the brittle regime and the upper regime deforms dominantly in ductile regime. This increase in deformation temperature from the lower to the upper zone produced an inverted thermal gradient from the lower to the upper zone (Bikramaditya Singh & Gururajan, Reference Bikramaditya Singh and Gururajan2011). The microstructural variation and decreasing temperature of deformation from the upper to the lower zone indicate that the LHC was initially buried below the Higher Himalayan Crystallines along the MCT and exhumed along the Bomdila Thrust at a later stage, as thrusting was transferred from the MCT to the Lesser Himalaya, towards shallow structural levels.
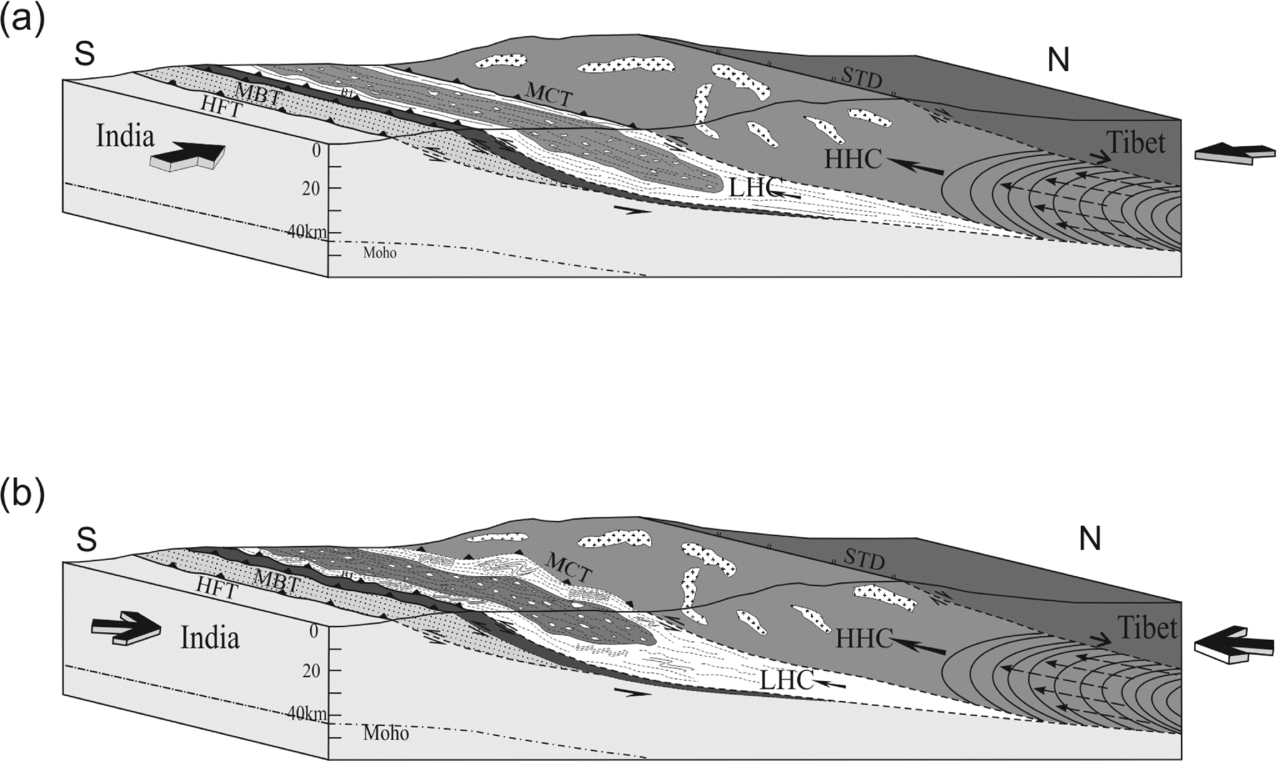
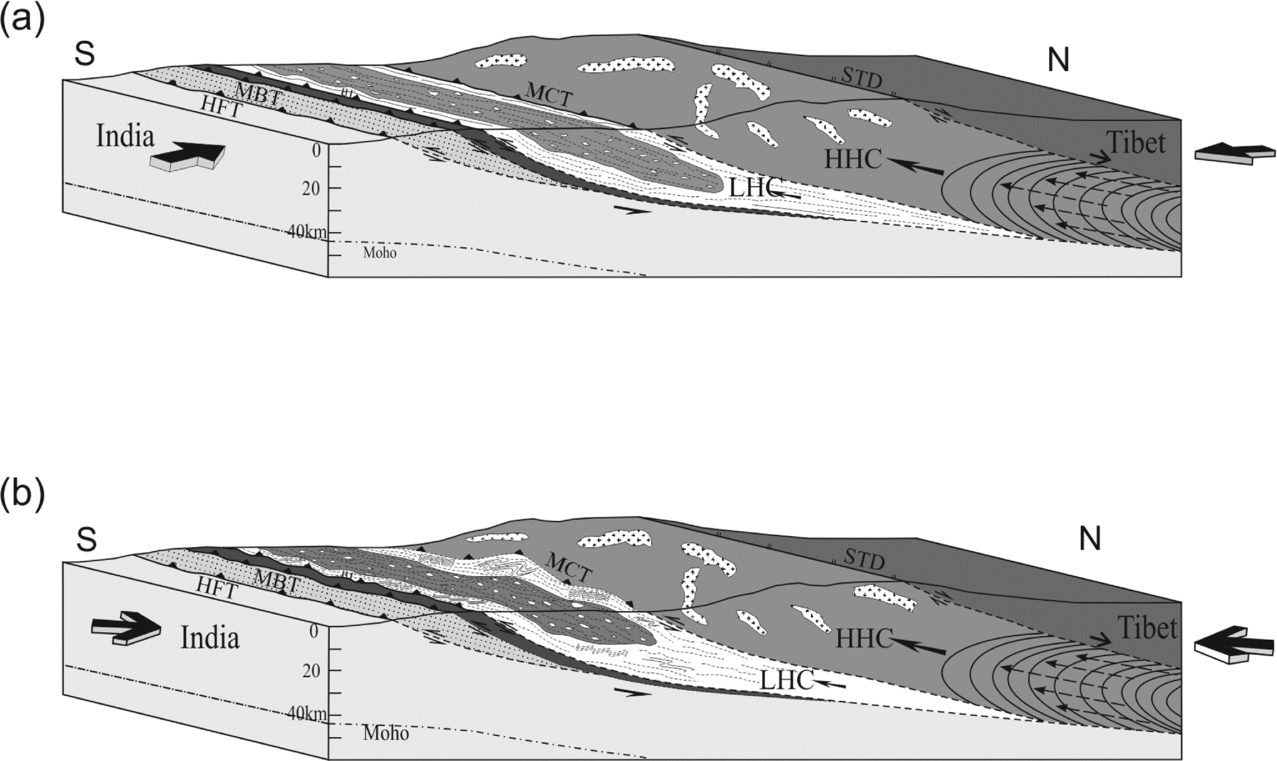
The major thrusts of the MCT and MBT are produced during the second phase of deformation owing to N–S compression in response to indentation of the Indian plate into the Eurasian plate (Heidbach et al. Reference Heidbach, Fuchs, Muller, Reinecker, Sperner, Tingay and Wenzel2007; Angelier & Baruah, Reference Angelier and Baruah2009) (Fig. 9a). On the regional scale, these thrusts are folded in the study area forming a part of the western limb of the eastern Himalayan syntaxis. The NE-plunging antiformal feature of the eastern Himalayan syntaxis is developed by lithospheric folding and buckling in response to large-scale continental shortening due to the India–Asia collision and exhumation during Late Miocene time (Burg & Podladchikov, Reference Burg and Podladchikov1999; Ding et al. Reference Ding, Zhong, Yin, Kapp and Harrison2001). The superimposed brittle deformation is produced after D2 deformation where the S2 foliation developed along with the MCT and MBT are cross-cut by the structural features of D3. AMS data show that the magnetic foliation trend of NW–SE-dipping to the NE or SW is different from the trend of the S2 foliation that is observed in the BG in the field. It suggests that the BG is superposed by a later phase of deformation. The trend of the magnetic lineation varies from SE to SW. Yin et al. (Reference Yin, Dubey, Kelty, Webb, Harrison, Chou and Celerier2010) reported a variation in the lineation trend and sense of shear within the Bomdila mylonitic zone and suggested that the variation may be either due to local rotation of the thrust sheets or superposition of Precambrian and Cenozoic tectonism. The trends of the F3 folds are rarely perpendicular to the early set of folds, clearly indicating NNE–SSW compression. The dynamic analysis of the outcrop-scale ductile and brittle–ductile shear zones in the western Arunachal Himalaya suggests that the shear zones are developed in response to NNE–SSW horizontal compression (Srivastava et al. Reference Srivastava, Srivastava, Srivastava and Singh2011), which is similar to the direction of the Indian plate movement (Metcalfe, Reference Metcalfe, Treloar and Searle1993). Gowd, Srirama Rao & Gaur (Reference Gowd, Srirama Rao and Gaur1992) found a NNE–SSW compression of the Indian plate at the Himalayan boundary from the analysis of borehole breakout and focal mechanism solutions. Tanaka et al. (Reference Tanaka, Mu, Sato, Takemoto, Miura, Liu, Zaman, Yang, Yokoyama, Iwamoto, Uno and Otofuji2008) suggested that the Shan-Thai block located to the southeast of the eastern Himalayan syntaxis was subjected to rigid block clockwise rotation of about 20° soon after the collision of India with Asia. Angelier & Baruah (Reference Angelier and Baruah2009) also reported N–S compression in the eastern Himalaya while NE–SW-trending compression with clockwise deviation occurs in the Indo-Myanmar Ranges. Indentation of the Indian plate into the Eurasian plate in the eastern Himalayan syntaxis region is in a NE direction (Gupta et al. Reference Gupta, Riguzzi, Dasgupta, Mukhopadhyay, Roy and Sharma2015). Global positioning system (GPS) and palaeomagnetic data suggest that the present-day deformational features around the eastern Himalayan syntaxis in response to ongoing indentation of India into Asia are related to the clockwise rotational motion (Wang et al. Reference Wang, Zhang, Freymueller, Bilham, Larson, Lai, You, Niu, Wu, Li, Liu, Yang and Chen2001; Zhang et al. Reference Zhang, Shen, Wang, Gan, Burgmann, Molnar, Wang, Niu, Sun, Wu, Hanrong and Xinzhao2004; Gan et al. Reference Gan, Zhang, Shen, Niu, Wang, Wan, Zhou and Cheng2007; Allmendinger, Reilinger & Loveless, Reference Allmendinger, Reilinger and Loveless2007; Copley, Reference Copley2008; Otofuji et al. Reference Otofuji, Yokoyama, Kitada and Zaman2010; Vernant et al. Reference Vernant, Bilham, Szeliga, Drupka, Kalita, Bhattacharyya, Gaur, Pelgay, Cattin and Berthet2014; Gupta et al. Reference Gupta, Riguzzi, Dasgupta, Mukhopadhyay, Roy and Sharma2015). The superimposed deformation in the BG may be related to the clockwise rotational motion due to NNE–SSW compression (Fig. 9b).
Model for the superposed deformation of Bomdila Gneiss in the Bomdila mylonitic zone showing the change in compression direction of the Indian plate and Eurasian plate along with the development of folding in the Lesser Himalayan Crystallines (LHC) during the latter phase of deformation. HFT – Himalayan Front Thrust; HHC – Higher Himalayan Crystallines; MBT – Main Boundary Thrust; MCT –Main Central Thrust; STD – South Tibetan Detachment Zone.
6. Conclusions
The study of the AMS of the BG from the LHC of the Arunachal Himalaya reveals the evidence of a late D3 deformation event in the BG that is not observed in outcrop. On a regional scale, the LHC is affected by three phases of deformation where the second phase of deformation is the most prominent. Any outcrop-scale signature of a superposed D3 event in the BG is lacking as it is most likely the superposed D3 event was too weak to develop visible outcrop-scale fabric on a granitic gneiss. Fabric related to D3 is only shown by the adjacent metapelites. The trends of the magnetic foliation are parallel to the axial plane of the F3 folds that are observed from the metapelites of the LHC. This study demonstrates how AMS can provide vital information regarding multiple deformation events in granitic gneisses and how magnetic fabric anisotropy can be applied to detect weak late-stage deformation events and unravel the complex deformation history of an orogenic belt.
Acknowledgements
The authors would like to thank Prof. A. K. Gupta, Director, Wadia Institute of Himalayan Geology, Dehradun for providing the facilities and permission to publish the present paper. Dr N. S. Gururajan and Dr S. S. Bhakuni are also thanked for their valuable suggestions. The Editor Dr Mark Allen and Dr M. A. Mamtani (IIT Kharapgur, India) and another two anonymous reviewers are acknowledged for their critical comments that helped improve the manuscript. RKBS acknowledges Prof. Sun-Lin Chung for his support during a post-doctorate tenure in NTU, Taiwan, and Department of Science and Technology, Govt of India, for providing financial support in the form of research project (No. SR/FTP/ES-46/2012).