I. INTRODUCTION
Service performance of solder joints is one of the most concerned reliability issues for microelectronic devices due to their significant role in terms of mechanical support and electrical interconnection. Reference Lee, Morris and Hua1,Reference Chen and Liang2 Electromigration (EM) Reference Lee, Ho and Subramanian3–Reference Wang, Lu, Gupta, Stiborek, Shirley, Chae, Im and Ho5 and creep Reference Lee, Morris and Hua1,Reference Su, Mao, Wang, Wang and Pan6 as two typical reliability problems have gained much attention and their corresponding failure mechanisms are also widely investigated. However, the effects of current density and creep usually co-exist on solder joint during the practical service conditions. The coupling effects of current density and constant stress on the in-service performance and lifetime of solder joints require further exploration. Reference Pharr, Zhao, Suo, Ouyang and Liu7–Reference Kinney, Morris, Lee, Liu, Xue and Towne9
Creep is defined as the plastic deformation with time under constant stress and constant temperature. Reference Cadek10 For solder joints, creep is a problem since solder joints are often subjected to shear stress generated from either constraint of rigid bonding or coefficient of thermal expansion (CTE) mismatch during the operation period. Reference Lee, Morris and Hua1,Reference Cadek10 Conventionally, temperature and stress are deemed to be the only two parameters that affect the steady creep rate of solder joint. Reference Cuddalorepatta, Williams and Dasgupta11 The current density on each solder joint may increase up to the threshold of EM as the size of solder joint continues to scale down. EM can cause unidirectional diffusion of atoms from cathode to anode and induce mechanical behavior change by polarity effect or other EM phenomena. Reference Lee, Kim, Tsukada, Suganuma, Yamanaka, Kuritani and Ueshima4,Reference Ke, Chuang, Shih and Kao12 Hence, it is reasonable to infer that the current density has an influence on creep behaviors of solder joint.
Several studies have been developed to understand the effect of EM on creep behavior of solder joint. Nah et al. Reference Nah, Ren, Paik and Tu13 and Ren et al. Reference Ren, Nah, Tu, Xiong, Xu and Pang14 observed ductile to brittle transition for the tensile fracture of solder joint when applying high electric current passage on the solder joint. Su et al., Reference Su, Mao, Wang, Wang and Pan6 Kinney et al., Reference Kinney, Morris, Lee, Liu, Xue and Towne15 and Zhao and Yang Reference Zhao and Yang16 found that the creep rate would increase with the increase of electric current density, respectively. Kinney et al. Reference Kinney, Lee, Liu and Morris8 attributed this phenomenon to temperature rather than EM because they thought EM might reduce the creep rate of solder joint. But Zhao and Yang Reference Zhao and Yang16 considered this phenomenon resulted from the combination effect of Joule heating and EM. Liu et al. Reference Liu, Zhu, Wang and Shang17 reported that stress-relaxation rate of tin-based solder joint increased significantly after current stressing. Pharr et al. Reference Pharr, Zhao, Suo, Ouyang and Liu7 and Shao et al. Reference Shao, Yang and Xuan18 analyzed and discussed the effect of EM-induced diffusion on creep behavior based on theoretical calculation. These studies demonstrated that when analyzing creep of a real solder joint, EM must be taken into account because of the interaction between them. However, further data are still necessary to reveal the intrinsic interaction mechanism.
Based on the above considerations, a comparison test between a low current density of 5 × 10² A/cm2 and a high current density of 2 × 10³ A/cm2 with the same creep condition was conducted in this study to reveal the contributions of current density to creep behavior. The simple shear lap structure of joint with widely commercialized Sn–3.0Ag–0.5Cu (SAC305) solder were used to simulate the stress state experienced by real solder joint. Microstructure evolution and instantaneous electrical resistance were observed to analyze the failure process of solder joints.
II. EXPERIMENTAL PROCEDURES
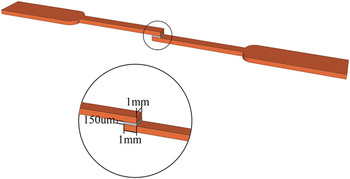
SAC305 solder paste provided by Alpha® was used to fabricate single shear lap solder joint. The specific structure and dimensions of solder joint were illustrated in Fig. 1. Half dog-bone shaped copper substrates were precisely cut by electrospark discharge machining. Before soldering process, 30 vol% nitric acid solution was used to half dog-bone shaped copper substrates for about 30 s to remove the oxide layer. SAC305 paste was coated on the end of well-cleaned substrates by screen printing technique. The shape and height of solder paste could be effectively controlled by the mesh screen. Soldering process was accomplished with the help of tailor-made fixture in the reflow oven. The peak temperature of reflow curve was 260 °C and the dwell time was 2 min. The area and thickness of solder joint were 1 mm × 1 mm and 200 μm, respectively. One side of as-fabricated solder joint was subjected to metallographic preparation for microstructure observation. The other side was fixed with the thermocouple to monitor the temperature.
Schematic of joint structure.

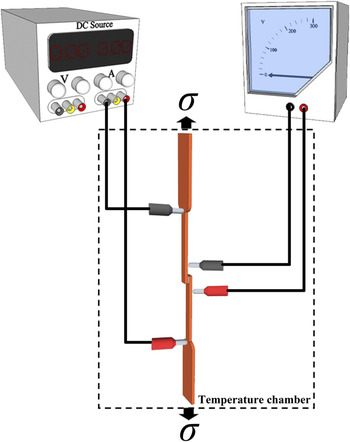
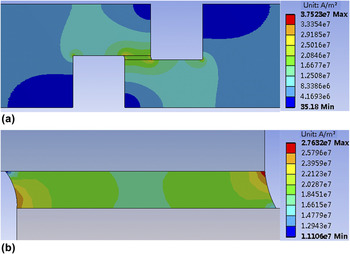
Figure 2 shows details of experimental setup in this study. Four probe method Reference Ma, Zuo, Liu, Guo and Wang19 was applied to detect electrical resistance changes of solder joint. Two power probes were wired outside of two voltmeter probes. The purpose of this wiring strategy was to eliminate errors induced by contact resistance. Creep tests were conducted in a temperature chamber at a constant ambient temperature of 100 °C (0.76T m) and using a dead weight loading of 5.5N. The calculated creep stress was 5.5 MPa. Two current densities, nominated 5 × 10² A/cm2 and 2 × 10³ A/cm2, were selected to investigate the contributions of current density on failure process of joint during coupling stressing. Current density distribution in solder joint was simulated by 2-D finite element analysis based on ANSYS 11.0. As can be seen in Fig. 3, corners and edges of solder matrix suffered relative higher current density, but the magnitude was still in the same order.
Schematic of experimental setup.

Current density distribution under 2 × 10³ A/cm2 condition: (a) across the solder joint, (b) in the solder matrix.

III. RESULTS
A. Resistance changes under the coupling stressing of creep and different current densities
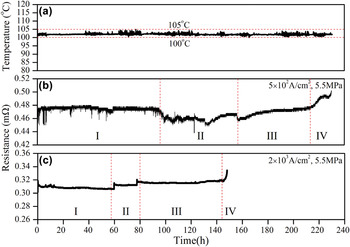
Figure 4 plots electrical resistance changes of two samples which were subjected to combination effects of creep and different current densities. Since the resistance (or namely resistivity) is a function of ambient temperature, temperature variations of samples under aging condition at 100 °C were inspected to reveal the impact of ambient temperature on the resistance change as shown in Fig. 4(a). The ambient temperature was almost constant except for some random fluctuations within a narrow range from 100 to 105 °C. It was demonstrated that ambient temperature had little effect on electrical resistance change of solder joint. Therefore, electrical resistance changes should be mainly attributed to the microstructure evolution.
The real time monitor of sample's physical parameters: (a) temperature variations, electrical resistance change under coupling stressing with (b) low, or (c) high current density.

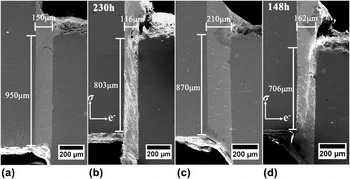
For low current density sample, the electrical resistance change could be classified into four stages, as illustrated in Fig. 4(b). In the first stage, the resistance of the sample kept relatively flat except for some noises caused by the data collecting system. In the second stage, the resistance curve displayed a temporary drop when testing time increased to around 90 h, and it had a little variation in this stage. Then, the resistance began to increase slowly in the third stage. In the fourth stage, the increase rate was further accelerated, which predicted the fracture occurrence in a very short time. The failure morphology in Fig. 5(b) shows that a big displacement was produced between two Cu substrates which accompanied with a serious deformation in solder. When compared with Fig. 5(a), the gap and overlapped area between copper substrates decreased 147 and 34 μm, respectively.
Comparison of microstructures before and after coupling stressing of creep and current density: (a), (b) 5 × 10² A/cm2 and 5.5 MPa; (c), (d) 2 × 10³ A/cm2 and 5.5 MPa.

For high current density sample, the electrical resistance change also could be divided into four stages, as can be seen in Fig. 4(c). First, the resistance experienced a slight decline period. Second, two rises appeared in this stage. Third, a long steady stage followed in a relatively long time. Final, an abrupt resistance increase occurred. As shown in Fig. 5(d), a catastrophic crack along the diagonal of the solder joint resulted in an obvious displacement between two substrates. The gap and overlapped area between Cu decreased 164 and 48 μm, respectively.
B. Microstructure evolution under the coupling stressing of creep and low current density
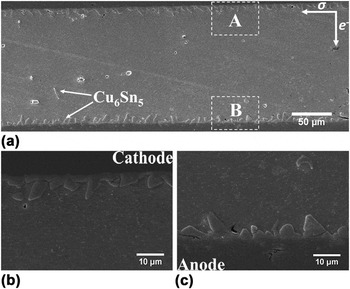
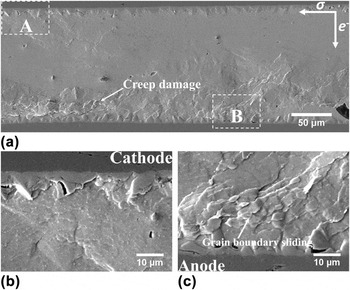
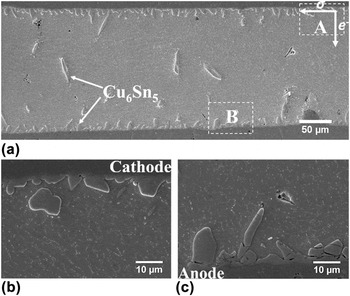
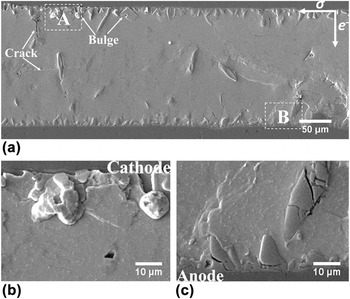
Figure 6(a) shows the microstructure of SAC305 solder joint at as-reflowed condition. The microstructure of as-fabricated solder joints had uniform eutectic microstructure. As shown in Figs. 6(b) and 6(c), typical scallop type Cu6Sn5 layers formed between Cu substrate and solder matrix. Creep damages could be examined in Fig. 7(a) after coupling testing for 123 h. Visible creep damages were almost concentrated near the anode interface and presented a striped morphology. These stripes seemed to originate from IMC layers and extended into solder matrix at a certain angle. The structural characterization of damage stripes could be clearly observed from the enlarged images in Figs. 7(b) and 7(c). Some grains near the anode were squeezed out from the surface of solder. Microcracks formed in some locations along the boundary of IMC colonies. Similar results could be found at the cathode as shown in Fig. 7(b). Relatively, the cracks and stripes were alleviated at cathode side.
SEM images of as-reflowed solder joint: (a) the overall view, (b) cathode and (c) anode are enlarged from A and B in (a).

SEM images of solder joint after coupling stressing of 5 × 10² A/cm2 and 5.5 MPa for 123 h: (a) the overall view, (b) cathode and (c) anode side are enlarged from A and B in (a).

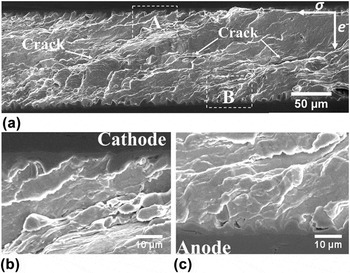
Figure 8 shows the in situ microstructure observation of solder joint after the coupling testing for 230 h. In Fig. 8(a), more stripes and cracks spread on the sample surface. The stripes had extended across the whole solder joint and developed into a series of cracks in comparison with Fig. 7(a). During the long-term testing in multiple physical fields, obvious shear displacement [see Fig. 5(b)] had emerged along a certain slip angle. Comparing Figs. 8(b) and 8(c) with Figs. 7(b) and 7(c), the morphology of IMCs at the interfaces had hardly changed. However, the solder matrix near the interface suffered serious shear deformation even at cathode side where little damages existed before.
SEM images of solder joint after coupling stressing of 5 × 10² A/cm2 and 5.5 MPa for 230 h: (a) the overall view, (b) cathode and (c) anode are enlarged from A and B in (a).

C. Microstructure evolution under the coupling stressing of creep and high current density
As shown in Fig. 9, the typical microstructure characterizations of as-reflowed SAC305 sample used to test the combination effect of creep and high current density were similar to that exhibited in Fig. 6, since the materials and sample preparation processes were the same. In-situ observation of microstructure evolution from 0 to 148h was carried out. It is interesting to note that less damage stripes appeared on the solder joint surface after 123 h when comparing Fig. 10(a) with Fig. 7(a), except for some microcracks which either formed from the defects that had already existed or originated from the IMCs.
SEM images of as-reflowed solder joint: (a) the overall view, (b) cathode and (c) anode are enlarged from A and B in (a).

SEM images of solder joint after coupling stressing of 2 × 10³ A/cm2 and 5.5 MPa for 123 h: (a) the overall view, (b) cathode and (c) anode are enlarged from A and B in (a).

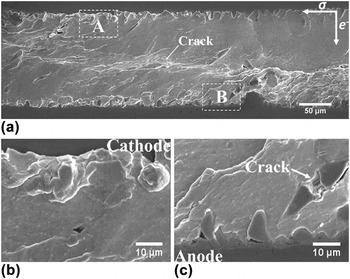
The sample broke down after experiencing coupling stressing for 148 h. Relative displacement could be observed between two sides of Cu substrate as shown in Fig. 5(d). A visible crack which contributed to final failure of solder joint formed near the center of the solder matrix in Fig. 11(a). The anode and cathode shown in Figs. 11(b) and 11(c) suggested that no appreciable changes appeared except for an IMC block totally sheared off. The final failure process was rapid as indicated in Fig. 4(c) which corresponded to an abrupt rise of electrical resistance. This rapid slipping of solder joint indicated a brittle fracture characteristic of solder joint under coupling stressing with high current density condition.
SEM images of solder joint after coupling stressing of 2 × 10³ A/cm2 and 5.5 MPa for 148 h: (a) the overall view, (b) cathode and (c) anode are enlarged from A and B in (a).

D. Fracture morphology under the coupling stressing of creep and different current densities
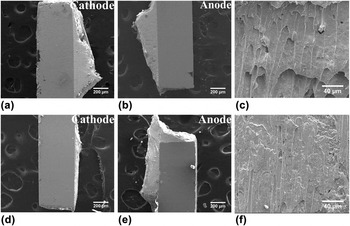
Fracture morphologies of samples after different coupling stressing conditions had been obtained to reveal the failure model. The fracture of the sample under low current density stressing occurred in the solder matrix and along the diagonal of solder joint as can be seen in Figs. 12(a) and 12(b). The fracture appearance showed in Fig. 12(c) displayed the dimple pattern with a feature of plastic fracture. When high current density was applied to the solder joint, the fracture site shifted to the cathode interface, as shown in Figs. 12(d) and 12(e). The fracture appeared [Fig. 12(f)] parallel to the interface. The dimple pattern displayed a tendency to brittle fracture.
The fracture morphology of joint after coupling stressing: (a), (b) and (c) 5 × 10² A/cm2 and 5.5 MPa; (d), (e), and (f) 2 × 10³ A/cm2 and 5.5 MPa.

IV. DISCUSSIONS
Electrical resistance of solder is determined by both macroscopic dimensions and microstructure of joint at a given temperature. Thus, the resistance change could be used to reflect the lifetime and failure process of a solder joint. Reference Ma, Zuo, Liu, Guo and Wang19,Reference Lu, Shih, Lauro and Goldsmith20 The results shown in Fig. 4 indicated that the lifetime of the sample which subjected to high current density was much shorter than that subjected to low current density under the same mechanical loading condition. Besides, fluctuations of the two curves implied different failure processes.
For low current density sample, the resistance fluctuated intensely during the coupling testing which indicated a serious damage accumulation in the solder joint. The resistance in stage I had few changes. There are two factors contributing to the relatively stable resistance observed in this stage. On one hand, the coarsening of β-Sn phase reduced the grain boundary which led to less free electrons scattering and drew down the resistance. On the other hand, the growth of IMC layer caused the increase of resistance. These two factors compensate with each other and resulted in observed stable resistance at the initial stage. At the beginning of stage II, an obvious decrease was detected which was then followed by a slight increase period. Figure 7 shows two types of damage in solder joint which were creep stripes and microcracks. Creep stripes shown near the interface and microcracks around the scallop-shaped IMCs at the interface, as can be seen in Fig. 7(a). Creep stripes resulted from dislocation slip and caused a displacement between two Cu substrates, namely the deformation of solder joint. The cross-section area increased while the thickness of solder joint decreased because of the twist of solder joint. According to the Pouillet's law, the above structural dimension change could reduce the resistance of the solder joint. On the contrary, cracks were inevitable during dislocation slip which were induced by both the effects of elasticity inconsistent between IMC layers and solder and creep behaviors. Thus, the resistance change in stage II was determined by the competition between deformation and crack propagation. It should be noted that crack propagation increasingly dominated the failure process as the stripe damage extended into solder matrix from interface regions, as shown in Fig. 8. This also caused the resistance increase in stage III. In stage IV, solder joint stepped into rapid creep stage after catastrophic cracks were developed [see Figs. 5(d) and 11(a)]. Therefore, the resistance in this stage increased rapidly. It was also believed that EM effect played a minor role in this coupling stressing test as the current density is relatively low.
Under the coupling stressing with low current density condition, the failure process of solder joint was accompanied by deformation and crack accumulation. The development of stripe damage which revealed form microstructure evolution, as shown in Figs. 7 and 8, was the main failure mechanism. It was implied that dislocation creep dominated the failure of the sample under the low current density and creep condition. Since the applied stress caused the stress concentration near the interface due to the IMC layer, the movement of dislocation prior occurred at these regions and caused deformation. Moreover, the incompatible deformation of grains in the vicinity resulted in crack nucleation. Thus, the mutual influence of deformation accompanied with crack nucleation and propagation induced the final failure of solder joint.
For high current density sample, the resistance change of solder joint was relatively smooth before the failure. In stage I, the resistance declined slightly. Some studies had reported the similar results. Lu et al. Reference Lu, Shih, Lauro and Goldsmith20 attributed this phenomenon to the purification effect of EM and the structural changes in the Sn grain and intermetallic layers due to annealing. Wu et al. Reference Wu, Gusak, Tu and Kao21 thought EM-induced grain rotation contributed to drop of resistance because grain rotation simultaneously leads the drop of flux divergence and minimizes the misorientation. The driving force for grain rotation is the reduction of resistance when a grain rotated from a high to a low resistance orientation with respect to the applied current direction. Besides, the scattering of electrons at the grain boundaries should drop as well, hence the drop of total resistance. In stage II, two resistance rises exhibited in Fig. 4(c) which might be related to the IMCs and microcracks. First, more IMCs migrated into solder matrix and coarsened due to EM and solid diffusion process in solder matrix which increased the resistance because the resistivity of IMC was higher than solder. Second, extrusions and rotation of β-tin grains were sources for microcrack formation. Under applied stress condition, the interfacial IMCs introduced stress concentration due to the incompatible elasticity between brittle IMCs and ductile tin grains, which resulted in phase extrusions from the surface of solder, as can be seen in Fig. 10(b). It is unavoidable that grain rotation would cause damage and microcrack along the rotation boundaries. The above two reasons led to the two resistance rises in this stage. The resistance in stage III remained steady. These results suggested that the solder joint had a good stability under the coupling stressing condition when the current density was relatively high. The migration of atoms inhibited the formation and propagation of cracks after the initial EM stage. The resistance in stage IV presented a rapid increase and the corresponding microstructure (Fig. 11) showed an obvious catastrophic crack on the surface. However, the deformation of solder joint was not as serious as the low current sample. The combination effects of EM on the cathode, growth of IMCs including both interface layers, and IMCs in solder matrix caused this rapid increase of resistance when considered that the tensile stress at the cathode and brittleness of IMC. Moreover, manifested brittle fracture characteristics could be examined in Fig. 12(f) when comparing the fracture morphology of the sample after coupling stressing with low current density [Fig. 12(c)].
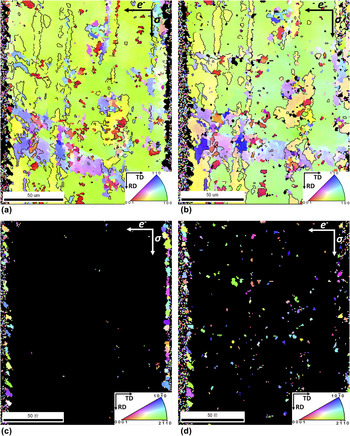
In comparison with the low current density sample, the high current density one experienced less deformation before the failure and crack nucleation and propagation also seemed to be suppressed in the initial stage. It was believed that EM effects caused by high current density played a significant role in the above solder behaviors. That is, the atom or phase migration enhanced the reliability of solder joint at the beginning of coupling stressing. Then, EM accelerated the failure process through cracks rapid propagation and shortened the overall lifetime of joint. Figure 13 shows the orientation maps of β-tin and Cu6Sn5 phases as reflowed and after EM stressing a period condition. At as-reflowed state, solder joint only contained limited β-tin orientations, as shown in Fig. 13(a). Besides, few Cu6Sn5 particles could be observed in solder matrix after solidification process [Fig. 13(c)]. After coupling stressing a while under high current density (the testing was carried out only 50 h under 2 × 10³ A/cm2 and 5.5 MPa), a flurry of Cu6Sn5 particles were detected in the solder matrix and the orientations of β-tin showed no obvious change when comparing Figs. 13(a)–13(d). Moreover, the polarity effect Reference Ke, Chuang, Shih and Kao12 (the thickness of IMC layer at the anode side is thicker than that at the cathode side after EM stressing and the thickness difference between the two sides will become more obvious with the increase of EM stressing time) had happened when comparing Figs. 13(c) with 13(d). It was demonstrated that Cu flux and IMCs were transformed from cathode side to anode side under the electron wind force. During this period, the migrated copper flux reacted with tin atoms to form Cu6Sn5 with the appropriate size and uniform distribution. These dispersed Cu6Sn5 might act as strong obstacles to impede the movement of dislocations and made it difficult for solder matrix to slide. Thus, the deformation and crack formation were inhibited or alleviated in the high current sample at a certain stage (between II and III stages).
Orientation map of solder joint before and after coupling stressing of 2 × 10³ A/cm2 and 5.5 MPa: (a) Sn-rich phase for 0 h; (b) Sn-rich phase for 50 h; (c) Cu6Sn5 for 0 h; (d) Cu6Sn5 for 50 h.

However, the reinforcement of solder joint by Cu6Sn5 particles was at the expense of its toughness. Such that solder embrittlement occurred as a result of IMC dispersion. When applied stress exerted on the solder joint for a long period, the deformation energy could no longer be absorbed by deformation behavior of the solder. It was indicated that the solder joint would have a great risk of catastrophic brittle fracture. The different fracture morphologies shown in Fig. 12 supported the above views. Since the low current density was not enough to activate EM, the migration behaviors of metallic phases could be neglected. The dislocation creep dominated and caused final fracture, as shown in Figs. 12(a)–12(c). The fracture position appeared in the center of solder matrix and fracture morphology presented dimple pattern which implied a ductile fracture. While under high current density, the dispersed IMCs in solder matrix would hinder the dislocation movement. The fracture morphology in Fig. 12(f) exhibited no obvious dimple pattern which indicated a brittle fracture mode. It is worth noting that the fracture located at the cathode interface, as shown in Figs. 12(a) and 12(b). The vacancies were pushed from the anode to cathode as a result of atom migration Reference Ke, Chuang, Shih and Kao12 and aggregated at the cathode interface to form voids and enabled the rapid propagation of cracks. Therefore, under the high current density condition, catastrophic cracks are more likely to be observed near the cathode and cause brittle fracture.
Schematics shown in Fig. 14 are used to illustrate the development of failure process with or without EM. Figure 14(a) depicts the loading state of a solder joint. When EM is absent, dislocation creep was the main failure mechanism of the joint. The applied shear stress caused dislocation movement in the grains. As shown in Fig. 14(b), many dislocations piled up in front of grain boundary. When external resolved shear stress exceeded the critical value, it would cause a new slip in the neighboring grain and lead to grain sliding and then continue to spread toward solder matrix. The crack nucleated and propagated when the neighboring grains deformed incompatibly, as shown in Fig. 14(c). When EM involved in creep, the high current density would cause Cu flux and IMC migration into solder and form Cu6Sn5 particles, as shown in Fig. 14(d). The introduction of these IMC particles hindered the movement of dislocations. Not only the motion of dislocation slip was impeded, but also the solder matrix was reinforced. The deformation and the cracks were suppressed in solder matrix. However, the voids and tensile stress would aggregate at the side near the cathode as the metal atoms migrated to anode under the EM effect [Fig. 14(e)]. It was also the reason for brittle fracture characterization and the whole life time was shortened. It is worth noting that if the polarity effect can be retarded under the high current density condition, the reliability or even the lifetime of solder joint under the high current density condition may have a better performance than that under low current density condition.
Schematics of solder joint failure mechanism with or without EM: (a) origin structure; (b), (c) without EM; (d), (e) with EM (not in scale).

V. CONCLUSIONS
In this study, the influence(s) of low/high current densities on creep behaviors of solder joints was investigated. The microstructure and resistance change were analyzed to reveal the failure process of samples. The results indicated that the lifetime of solder joints under the coupling stressing with high current density was much shorter than that under the low current density. Dislocation creep was the main failure mechanism for the sample under coupling stressing with low current density. For high current density condition, the failure mechanism was dominated by the interaction between the creep and EM. The Cu6Sn5 IMCs which migrated to the solder matrix by electron wind force dispersed uniformly with an appropriate size. The solder matrix was reinforced by these IMC particles and no obvious slide region and cracks exist in solder matrix. However, less strain energy could be absorbed by plastic deformation left the joint a higher risk of brittle fracture failure.
ACKNOWLEDGMENTS
The authors acknowledge the support of this work from Beijing Municipal Natural Science Foundation (2122004) and National Natural Science Foundation of China (51301007).