I. INTRODUCTION
Tungsten oxide (WO3) is a transition metal oxide semiconductor with a widely tunable band gap (E g), in the range of 2.5–2.8 eV at room temperature. Interest was recently put on WO3 thin films and nanoparticles Reference Soultanidis, Zhou, Kiely and Wong1 for a wide variety of applications in microelectronics and optoelectronics, Reference Santato, Odziemkowski, Ulmann and Augustynski2 dye-sensitized solar cells, Reference Zheng, Tachibana and Kalantar-zadeh3 colloidal quantum dot light-emitting diodes, Reference Wood, Panzer, Halpert, Caruge, Bawendi and Bulovic4 photocatalysis Reference Srinivasan and Miyauchi5 and photoelectrocatalysis, Reference Ahmed, Hassan, Roy and Marken6 water splitting photocatalysis Reference Chen, Ye, Ouyang, Kako, Li and Zou7–Reference Su, Guo, Bao and Grimes13 and methanol oxidation catalyst. Reference Cui, Shi, Chen, Zhang, Guo, Gao and Li14 Environmental applications may also benefit with the use of WO3 as a visible light photocatalyst to generate OH radicals in the wastewater treatment, Reference Chen, Li, Li, Huang, Zhou, Cai and Shangguan15 bacteria destruction, Reference Wang, Huang, Qin, Zhang, Dai and Whangbo16 and photocatalytic reduction of CO2 into hydrocarbon fuels. Reference Chen, Zhou, Liu, Li, Liu and Zou17 Yin et al. Reference Yin, Cao, Zhang, Qu and Zhou18 have reported high hydrophobic properties and improved performances of WO3 as anode materials in lithium-ion batteries. WO3 has also been used in the so-called smart windows Reference Li, Wu, Gao, Shen and Huang19 for energy-efficient buildings, flat-panel displays, optical memory, and writing–reading–erasing devices. Moreover, WO3 shows functional activity to various gases, such as H2, Reference Xiang, Meng, Zhao, Zhang, Li, Ma and Xu20 H2S, NO x , trimethylamine, and other organic compound gases such as acetone sensing in exhaled breath. Reference Righettoni, Tricoli and Pratsinis21 It is therefore important to find suitable methods allowing for its large scale production moreover with ease and low cost.
There exist few methods for the preparation of WO3. For example using electrochemical processes, Reference Gu, Zheng, Han, Roth and Liu22 solution-based colloidal approaches, Reference Hudson, Peckett and Harris23 bioligation processes, Reference Polleux, Gurlo, Barsan, Weimar, Antonietti and Niederberger24,Reference Polleux, Pinna, Antonietti and Niederberger25 and chemical-vapor-deposition techniques. Reference Klinke, Hannon, Gignac, Reuter and Avouris26,Reference York, Sloan, Green and Sloan27 Oriented WO3 nanowires were also obtained using an hydrothermal (HT) treatment in the presence of alkaline metal sulfates. Reference Gu, Zhai, Gao, Sheng, Wang, Fu, Ma and Yao28,Reference Shibuya and Miyauchi29
In this article, we report on a very simple, low temperature (95–98 °C), and low pressure (1 bar) HT process to synthesize tungstite (WO3·H2O) nanoparticles that are later transformed to WO3 during a short annealing. Therefore, the needs for a high pressure autoclave and highly acid-resistive liners in the reaction chamber are avoided, which present clear advantages for the industry. Moreover, it is possible to readily scale up this process for the production of large quantities of materials. A first reaction produces an amorphous product dissolved in oxalic acid followed by an HT process using a simple reflux system yielding orthorhombic tungstite (WO3·H2O) nanostructures. Annealing the tungstite materials at or above 300 °C in ambient air leads to a phase transformation to monoclinic WO3, where the morphology of the materials is preserved.
II. EXPERIMENTAL DETAILS
The tungstite (WO3·H2O) materials were synthesized using the acid precipitation method Reference Supothina, Seeharaj, Yoriya and Sriyudthsak30,Reference Sun, Xu, Cao, Yao and Wang31 followed by a low pressure (P = 1 bar) and low temperature (T = 95–98 °C) HT treatment. Reference Ahmadi and Guinel32 Ultrapure 18 MΩ Millipore® deionized water was used for the preparation of all solutions. Around 30–50 mL of 6N hydrochloric acid (HCl) was added dropwise to a 100 mL 15 mM sodium tungstate solution (Na2WO4·2H2O) while the solution was kept at below 5 °C and under constant stirring to produce white amorphous precipitates. Reference Ahmadi and Guinel33 Oxalic acid (H2C2O4) was added to dissolve the products and acted as a surfactant. The tungstite nanoparticles (TNPs) were obtained by applying a HT treatment on this solution for 6–18 h. It yielded a yellowish solution which was centrifuged and washed several times to reach pH∼6 and dried at 60 °C in an oven in ambient air.
The materials were annealed for 90 min in a tube furnace at 300 °C and 500 °C (ramp rate: 10 °C min−1) in ambient air (Lindberg/Blue M Mini-MiteTM, Thermo Scientific, Tewksbury, MA) and yielded WO3 nanoparticles.
Samples were examined using a cold field-emission scanning electron microscope (SEM, JEOL JSM-7500F, JEOL, Tokyo, Japan) and a high resolution transmission electron microscope (HRTEM, JEOL JEM-2200FS, JEOL, Tokyo, Japan, operated at 200 kV). X-ray energy-dispersive spectrometry (XEDS) in the SEM and the TEM was used to determine the elemental composition of the samples. Selected area electron diffraction (SAED) and powder x-ray diffraction (XRD) were used to determine the phase(s) present. Electron energy-loss spectra (EELS) were recorded using the in-column energy filter fitted on the microscope. X-ray photoelectron spectroscopy (XPS) measurements were performed using a commercial PHI 5500 spectrometer (Perkin Elmer Physical Electronics, Minneapolis, MN) with a monochromatized Al Kα radiation (1487 eV) and an electron emission angle of 45°.
III. RESULTS AND DISCUSSION
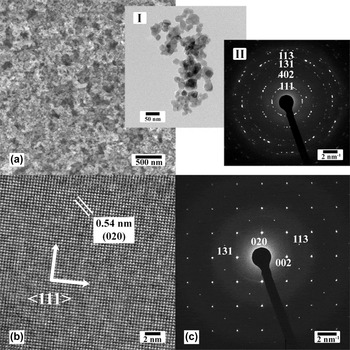
One SEM image and two TEM images recorded from the TNPs (WO3·H2O) are displayed in Fig. 1. They were less than 30 nm. XEDS recorded in the SEM and the TEM showed the materials to be composed of only elements O and W (data not shown here) and of course TNPs were also composed of hydrogen but that element cannot be detected using XEDS.
(a) SEM image showing the TNPs where the insets I and II show one TEM image and the corresponding SAED pattern indexed to orthorhombic tungstite, respectively. (b) HRTEM image recorded from the center of one TNP. The {111} planes are labeled. (c) Corresponding SAED pattern, indexed to single crystalline orthorhombic tungstite.

The diffraction pattern shown in the inset II of Fig. 1(a) was indexed to the orthorhombic Pmnb structure of tungstite with lattice parameters a = 0.524, b = 1.070, and c = 0.512 nm, which was in good agreement with the JCPDS card number No. 43-0679 and the American Mineralogist Crystal Structure Database, AMCSD 0005199. Reference Szymanski and Roberts34 The structure consists of distorted octahedral units of tungsten atoms coordinated with five oxygen atoms and a water molecule where the octahedra share four vertices in the equatorial plane forming the sheet structure [see ESI, Fig. S1(b)]. One HRTEM image recorded from the center of one TNP and its corresponding SAED pattern are shown in Figs. 1(b) and 1(c). The measured d-spacing was 0.35 nm, corresponding to {111} of the orthorhombic crystal phase. The pattern was indexed to orthorhombic tungstite, along the [110] zone axis.
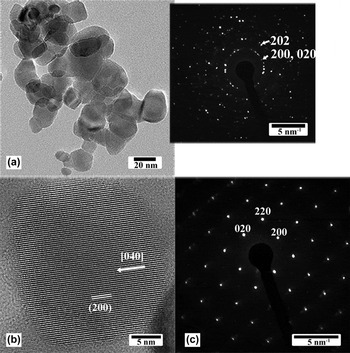
Figure 2(a) shows a TEM image recorded from a sample of TNPs that was annealed at 300 °C for 90 min. The inset is a SAED pattern, indexed to monoclinic WO3 demonstrating that the phase transformation to tungsten oxide occurred while preserving the nanoparticle morphology. Figure 2(b) shows one HRTEM image recorded from one WO3 nanoparticle (WNP), where the (200) (d 200 = 0.36 nm) planes are labeled. The SAED pattern shown in Fig. 1(c) was recorded from one WNP and was indexed to monoclinic P2 1 /n (14) WO3, along the [001] zone axis, with lattice parameters a = 0.729, b = 0.754, and c = 0.768 nm, which was in good agreement with published data (WO3 XRD card number JCPDS No. 43-1035). The same results were obtained with TNPs annealed at 500 °C (see ESI, Fig. S2, TNPs treated at 500 oC). In this monoclinic structure, the W–O bonds make zigzag chains in three directions with W–O–W and O–W–O angles measuring 158° and 166°, respectively. In the x direction, the bonds have equal lengths, while in the y and z directions they are alternately long and short. Reference Loopstra and Boldrini35 XRD results were also in good agreement [see ESI, Fig. S1(a)]. Indeed, the phase transformation from tungstite to tungsten oxide is due to the removal of interstructural water molecules [see ESI, Fig. S1(b)]. The formation of tungstite and its dehydration can be described in three separate steps. Reference Holleman, Wiberg and Wiberg36 The first two steps are schematically illustrated in ESI, Fig. S3. The first step is the protonation of the tungstate ions upon solution acidification to form white solid precipitates:
 $$2{\rm{N}}{{\rm{a}}^ + } + {\left[ {{\rm{W}}{{\rm{O}}_4}} \right]^{2 - }} + 2{\rm{HCl}} \to \left[ {{\rm{W}}{{\rm{O}}_2}{{\left( {{\rm{OH}}} \right)}_2}} \right] + 2{\rm{NaCl}}\quad {\rm{.}}$$
(a) TEM image recorded from TNPs annealed at 300 °C for 90 min. The inset is a SAED pattern, indexed to monoclinic WO3. (b) HRTEM image recorded from one WO3 nanoparticle. The lattice is monoclinic with the (200) planes labeled (0.36 nm). (c) SAED pattern recorded from one WNP, indexed to monoclinic WO3 along the [001] zone axis.

Oxalic acid is a good surfactant to control the size of the final product Reference Sun, Xu, Cao, Yao and Wang31 and makes the solution transparent. An amorphous gel of WO3·H2O (synthesized by mixing a Na2WO4·2H2O solution with 1N HCl solution) was reported to crystallize upon washing with water, Reference Balazsi and Pfeifer37 however there was no control of the particle size. The second step is the hydration of the [WO2(OH)2] tetrahedral molecules and dimerization via O-bridging to form crystalline [WO(OH)3(H2O)]2(µ-O) containing octahedral W-centers via the HT process in acidic solution:
 $$2\left[ {{\rm{W}}{{\rm{O}}_2}{{\left( {{\rm{OH}}} \right)}_2}} \right] + 3{{\rm{H}}_2}{\rm{O}} \to {\left[ {{\rm{WO}}{{\left( {{\rm{OH}}} \right)}_3}\left( {{{\rm{H}}_2}{\rm{O}}} \right)} \right]_2}\left( {\mu - {\rm{O}}} \right)\quad .$$
An increase in the temperature during the nucleation process leads to a decrease in the activation energy, therefore promoting nucleation. During this step, the morphology and size of the tungstite materials can also be controlled using proper additives and chelating agents. For example, Gu et al. Reference Gu, Zhai, Gao, Sheng, Wang, Fu, Ma and Yao28 reported on the synthesis of WO3 nanorods in the presence of sulfate salts of alkali and alkaline earth metals using an HT method at temperatures greater than 150 °C inside an autoclave (i.e., high pressure). Shibuya et al. Reference Shibuya and Miyauchi29 synthesized tree-like structures in the presence of rubidium sulfate at 150 °C using an HT process. Note that a high temperature HT process requires a stainless steel vessel lined with an acid resistive coating. Moreover, it can take a long time (more than one day). Here, we found that nanorods can be produced with the addition of sulfate ions (by adding 5 mM sulfuric acid) as illustrated in ESI, Fig. S4. The growth direction was through the {111} planes. Furthermore, the addition of 10 mM Cs+ (as CsNO3) during this step, resulted in Cs-doped TNPs. Annealing also preserved the Cs within the structure and Cs-doped WO3 was achieved [see ESI, Fig. S5]. The Cs M4,5 edge (EELS) is shown in Fig. S5, proving the presence of Cs atoms inside the structure of the TNPs. The presence of Cs in WO3 increases significantly its quantum yield and can be used as exchange by other elements to create proper active sites for water oxidation. Reference Miseki, Kusama, Sugihara and Sayama38
The third step corresponds to the dehydration process Reference Ahmadi, Sahoo, Younesi, Gaur, Katiyar and Guinel39 (i.e., phase transformation):
 $${\left[ {{\rm{W}}{{\rm{O}}_3}\cdot{{\rm{H}}_2}{\rm{O}}} \right]_n} \to {\left[ {{\rm{W}}{{\rm{O}}_3}} \right]_n} + n{{\rm{H}}_2}{\rm{O}}\quad {\rm{.}}$$
A schematic of this dehydration process is shown in ESI, Fig. S1(b). The removal of internal water molecules and W=O double bonds allows for the layers to connect through the O atoms to stack together and turn to more compact structure. Reference Ahmadi, Sahoo, Younesi, Gaur, Katiyar and Guinel39
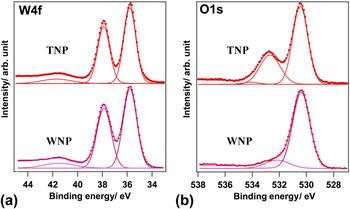
The O1s and W4f core level XPS spectra recorded from TNPs and WNPs (heat treated TNPs at 300 °C for 90 min) samples are shown in Fig. 3. The W4f spectra recorded from both samples present the W4f 7/2 and W4f 5/2 doublet at 35.6 and 37.7 eV (with peak separation of 2.1 eV and the intensity ratio of 3:4), respectively, associated with the oxidation state of W6+ ions Reference Baek and Yong40 [see Fig. 3(a)]. Bonding to oxygen atoms shifts these two peaks from the theoretical values of tungsten metal (31.4 and 33.6 eV). The small peak at 41.7 eV was assigned to W5p. The O1s spectrum of each sample contains a main contribution at the lowest binding energy, originated from W–O bond [see Fig. 3(b)]. The second peak, at about 532.5 eV, represents the –OH bond, which originates from the absorbed or interstructural water molecules inside the tungsten oxide or the tungstite structure. The relative intensity of this peak is higher in the TNP sample compared with that in the WNP sample because of the presence of interstructural water molecules, removed during the dehydration process to form WNP [see ESI, Fig. S1(b)]. The relative intensity of this peak, 33%, is half of the relative intensity of the first peak (W–O peak) in the TNP spectrum.
O1s and W4f core level XPS spectra recorded from TNPs and WNPs (TNPs annealed at 300 °C). Intensities are normalized.

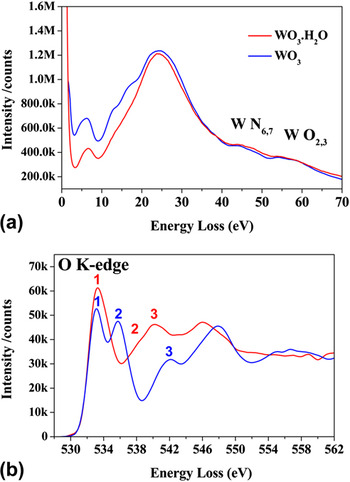
EEL spectra were recorded near the W N6,7, W O1,2 and the O K-edges. The spectra in the region of the W N6,7 and W O1,2 edges are shown in Fig. 4(a), recorded from few TNPs and WNPs (TNPs annealed at 300 °C for 90 min). The peaks below W N6,7 (shoulder of W4f 7/2) are primarily associated with collective excitations from the valence bands (VBs) to the conduction bands (CBs). According to the molecular orbital theory, the VB consists of four orbital components (a1g, t1u, eg, and t2g) to anti-bonding orbital components (see ESI, Fig. S6).
EELS recorded from a few TNPs and WNPs (TNPs annealed at 300 °C) in the low energy-loss (a) and near the O K-edge (b).

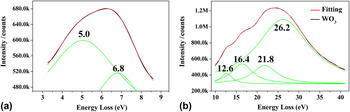
In Fig. 5, the EEL spectrum recorded from the same WO3 sample in the low energy-loss region was fitted with Lorentzian peaks: two peaks at the energies of 5.0 and 6.8 eV [Fig. 5(a)] and four peaks at 12.6, 16.4, 21.8, and 26.2 eV [Fig. 5(b)]. The peak at 26.2 eV corresponds to carbon
Reference Ahn and Krivanek41
(from the ultrathin carbon supporting film of the copper TEM grid; about 3–5 nm thick according to the vendor). Considering that the peaks below W N6,7 are associated with possible excitations between the valence and conduction bands, and also the fact that exciting electrons from the g orbital components to
 ${\rm{e}}_{\rm{g}}^*$
to
 ${\rm{t}}_{2{\rm{g}}}^*$
anti-bonding components is forbidden, the first two low energy peaks are the result of the electron excitation from t1u occupied orbitals to two unoccupied anti-bonding components
 ${\rm{e}}_{\rm{g}}^*$
and
 ${\rm{t}}_{2{\rm{g}}}^*$
resulting in the two peaks at 6.8 and 5.0 eV, respectively. This is in agreement with UV-vis spectroscopy
Reference Ahmadi and Guinel33
which shows the peak separation for these two electron excitations to be 1.7 eV. On the other hand, we should keep mind that these two peaks may be affected by the zero-loss peak and the thickness of the particles resulting in inaccurate measurements. The energies at 12.6, 16.4, and 21.8 eV can be assigned to the electron excitation from t2g/eg to
 ${\rm{t}}_{1{\rm{u}}}^*$
, t1u to
 ${\rm{a}}_{1{\rm{g}}}^*$
, and a1g to
 ${\rm{t}}_{1{\rm{u}}}^*$
, respectively. For tungstite, these peaks cannot be assigned accurately due to the large carbon peak at 26.2 eV.
Experimental EELS and its fitting for WNPs (TNPs annealed at 300 °C).

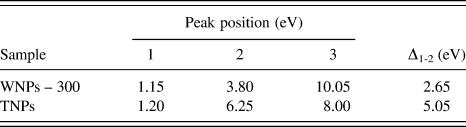
The O K-edge can be influenced by several factors such as the ejection of electrons into the continuum levels, making a saw-tooth shape, while solid state effects and transitions to unoccupied bonds create the fine structures in the edge. Reference Sefat, Amow, Wu, Botton and Greedan42,Reference Ahn and Rez43 The energy-loss near-edge structure (ELNES) at the O K-edge in transition metal oxides is due to the crystal-field splitting of the metallic d orbital into eg and t2g components, creating a double-peak signature Reference Jollet, Petit, Gota, Thromat, Soyer Gautier and Pasturel44,Reference Harvey, Guo, Kennedy, Risbud and Leppert45 as shown in Fig. 4(b). The peaks' positions and peak separation between the two first peaks (Δ1-2) for TNPs and WNPs (annealed at 300 °C) were measured and are listed in Table I. The first peak's position (∼1.20 eV) for both samples was not affected. However, the second peak in TNPs (6.25 eV) was significantly displaced compared with that of WNPs (3.80 eV). The third peak's energy for TNPs (8.00 eV) was less than that of WNPs (10.05 eV). Peaks at higher energy losses should be considered carefully because of the contributions of direct transitions to unoccupied states and multiple scattering resonances. Reference McComb46 The first two peaks are due to the eg and t2g components and their separation (Δ1-2) is given in Table I. Δ1-2 was larger for TNPs. McComb and Harvey reported that the oxygen ELNES of each phase had the same general shape, but that there exist significant differences in the locations and intensities of the individual peaks comprising the ELNES, and that the separation between two peaks was structure-dependent. Reference Harvey, Guo, Kennedy, Risbud and Leppert45,Reference McComb46 The monoclinic structure has a higher density and lower degree of symmetry than the orthorhombic structure, explaining the observed differences. McComb's analysis showed that the observed decreased peak separation is a result of the increased structural complexity, polyhedron variety, and reduced symmetry. These parameters may affect the initial O-1s state and the splitting of the metal 5d level, which is hybridized with the final O-2p state. Therefore, EELS (unlike XEDS) can be used to distinguish between tungstite and tungsten oxide. The band gap (E g) for WNPs sintered at 300 °C was measured to ∼2.6 eV according to McComb's extrapolation method, which is in good agreement with published data (E g = 2.5–2.8 eV at room temperature).
Peak energies (eV) measured from the O K-edge for TNPs and WNPs (heat treated at 300 °C).

IV. CONCLUSIONS
Orthorhombic TNPs (less than 30 nm) were prepared using a low temperature and low pressure HT treatment. Moreover, morphologies can be tuned by making additions during the HT treatment (e.g., the presence of sulfate ions yielded nanorods) and WO3 can be doped (e.g., with cesium). A short annealing to 300 °C in ambient air allowed for the phase transformation to monoclinic WO3, while preserving the morphology. EELS can be used to distinguish between the two phases (unlike XEDS). The advantage of this preparation method is its ease of scalability for industrial applications as it does not require expensive specialty vessels.
Supplementary Material
To view supplementary material for this article, please visit http://dx.doi.org/jmr.2014.155
ACKNOWLEDGMENTS
The partial support from NSEC Center for Hierarchical Manufacturing at the University of Massachusetts (National Science Foundation award 1025020). NSF for its support (award 0701525) to the Nanoscopy Facility, an electron microscopy facility at UPR.