INTRODUCTION
Radiocarbon dates conducted on marine organisms are frequently used for the establishment of absolute chronologies. They are especially widespread in studies of ancient hunters and gatherers, who harvested marine resources. Many settlements and burials of ancient people on the coasts of the northern Pacific and Bering Sea are dated, at least in part, using marine fish, sea mammal bones, or seashells. At the same time, marine organisms are often the only available material for radiocarbon dating during investigations of the sea-bottom cores in paleoclimatology and related fields. Marine-derived radiocarbon dates require calibration with global marine correction curves (Reimer et al., Reference Reimer, Bard, Bayliss, Beck, Blackwell, Bronk Ramsey and Buck2013) to partially compensate for the reservoir offset of the ocean waters. Because the reservoir effect varies by location, a regional correction factor–designated as ΔR–is important and should be used during calibration for greater accuracy (Stuiver and Braziunas, Reference Stuiver and Braziunas1993).
The 14C age offset (ΔR) of marine-derived carbon in the northern Pacific region was previously estimated in a number of papers (Dumond and Griffin, Reference Dumond and Griffin2002; McNeely et al., Reference McNeely, Dyke and Southon2006; Khasanov et al., Reference Khasanov, Nakamura, Okuno, Gorlova, Krylovich, West, Hatfield and Savinetsky2015; Fitzhugh and Brown, Reference Fitzhugh and Brown2018; West et al., Reference West, Khasanov, Krylovich, Hatfield, Khasanov, Vasyukov and Savinetsky2019). However, many questions remain unanswered. The northern and western parts of the region (e.g., Chukotka to Kamchatka) remained uninvestigated. This limits the confidence with which researchers can use marine dates across the wider region. In this paper we summarize previously published data on Bering Sea ΔR values, present new estimates, and synthesize the available evidence. New data have been obtained from the osteological materials unearthed during excavations of archaeological sites Kaniskak (Chukotka; Dinesman et al., Reference Dinesman, Kiseleva, Savinetsky and Khasanov1999) and ATU-061 (Shemya Island in the western Aleutian Islands; Corbett et al., Reference Corbett, West and Lefèvre2010). We also used radiocarbon dates of bones of sea otter (Enhydra lutris) of known collection date for ΔR value assessments in the Commander Islands. We argue that with the expanded data set, a single regional ΔR correction for the central North Pacific and Bering Sea is appropriate.
MATERIALS AND METHODS
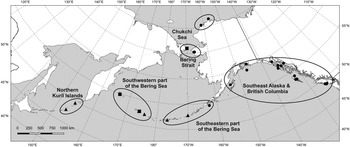
ΔR is defined by Stuiver and Braziunas (Reference Stuiver and Braziunas1993) as the difference between measured radiocarbon age of a marine sample and its value modeled according to the ocean–atmosphere box diffusion model (Oeschger et al., Reference Oeschger, Siegenthaler, Schotterer and Gugelmann1975). To calculate modeled age, one needs an independent assessment of a marine sample's true age. This can be achieved either with marine samples of known collection date or with paired samples of terrestrial and marine origin that are presumed to be of the same age. In the latter case, radiocarbon dates of terrestrial counterparts serve as a true age-independent assessment. Both approaches were used to assess ΔR of the northern Pacific (McNeely et al., Reference McNeely, Dyke and Southon2006; Khasanov et al., Reference Khasanov, Nakamura, Okuno, Gorlova, Krylovich, West, Hatfield and Savinetsky2015; Fitzhugh and Brown, Reference Fitzhugh and Brown2018; West at al., Reference West, Khasanov, Krylovich, Hatfield, Khasanov, Vasyukov and Savinetsky2019). The locales of ΔR estimations conducted for the northern Pacific so far, including those reported in this paper, are presented in Figure 1. We combined all of these assessments into six regions: Chukchi Sea, Bering Strait, the southwestern part of the Bering Sea, northern Kuril Islands, the southeastern part of the Bering Sea, and southeast Alaska and British Columbia (Fig. 1).
Locations of the northern Pacific ΔR estimates combined in six regions. Squares mark sites of the new data sets presented in the paper (see text for details). Triangles mark previously published ΔR estimates conducted on paired radiocarbon dates of coeval marine and terrestrial materials from archaeological sites: Buldir Island (western Aleutians; Corbett et al., Reference Corbett, Causey, Clementz, Koch, Doroff, Lefevre, West, Rick and Erlandson2008, Reference Corbett, West and Lefèvre2010), Adak Island (central Aleutians; Khasanov et al., Reference Khasanov, Nakamura, Okuno, Gorlova, Krylovich, West, Hatfield and Savinetsky2015), Carlisle Island (eastern Aleutians; West et al., Reference West, Khasanov, Krylovich, Hatfield, Khasanov, Vasyukov and Savinetsky2019), and northern Kuril Islands (Fitzhugh and Brown, Reference Fitzhugh and Brown2018). Circles mark locations of radiocarbon-dated shells with known collection dates (McNeely et al., Reference McNeely, Dyke and Southon2006). See detailed information on all data sets in the Supplementary Tables.

Chukchi Sea
In total, seven radiocarbon dates of marine shells of known collection date were reported for the Arctic coast of Alaska (McNeely et al., Reference McNeely, Dyke and Southon2006). Calculated ΔR values along with other information concerning measurements are summarized in the Supplementary Tables.
Bering Strait
New previously unpublished data concerning ΔR assessments are presented here. They originate from the radiocarbon dating of terrestrial and marine materials unearthed during excavations of the Kaniskak archaeological site (Fig. 1). The detailed description of the settlement and excavation was published elsewhere (Dinesman et al., Reference Dinesman, Kiseleva, Savinetsky and Khasanov1999) and is presented in the Supplementary Tables. Briefly, two pits were excavated close to one another in a part of the settlement that appeared to be a kitchen midden. Material was taken in layers from 5 to 25 cm thick. Bones of marine and terrestrial animals were sampled and radiocarbon dated.
Bones of the following terrestrial animals were dated: ptarmigans (Lagopus lagopus, Lagopus muta), reindeer (Rangifer tarandus), mountain hare (Lepus timidus), and Arctic fox (Vulpes lagopus). The first three species have exclusively terrestrial diets, while Arctic foxes can feed on marine animals as well. We measured stable isotope values (carbon and nitrogen) of 100 samples of Arctic fox subfossil bones from several archaeological sites in Chukotka (Zendler, E., unpublished data). The results clustered in three distinct groups: 1 animal with a clearly marine diet (δ13C = −13.0 ‰; δ15N = 18.9‰); 6 animals with mixed diets (δ13C ranges from −19.4‰ to −15.7‰; δ15N ranges from 11.4‰ to 13.8‰); and 93 animals with isotope signatures corresponding to terrestrial diets (δ13C ranges from −22.8‰ to −19.4‰; δ15N ranges from 2.4‰ to 11.8‰). In this study only bones of Arctic foxes with an exclusively terrestrial diet were used.
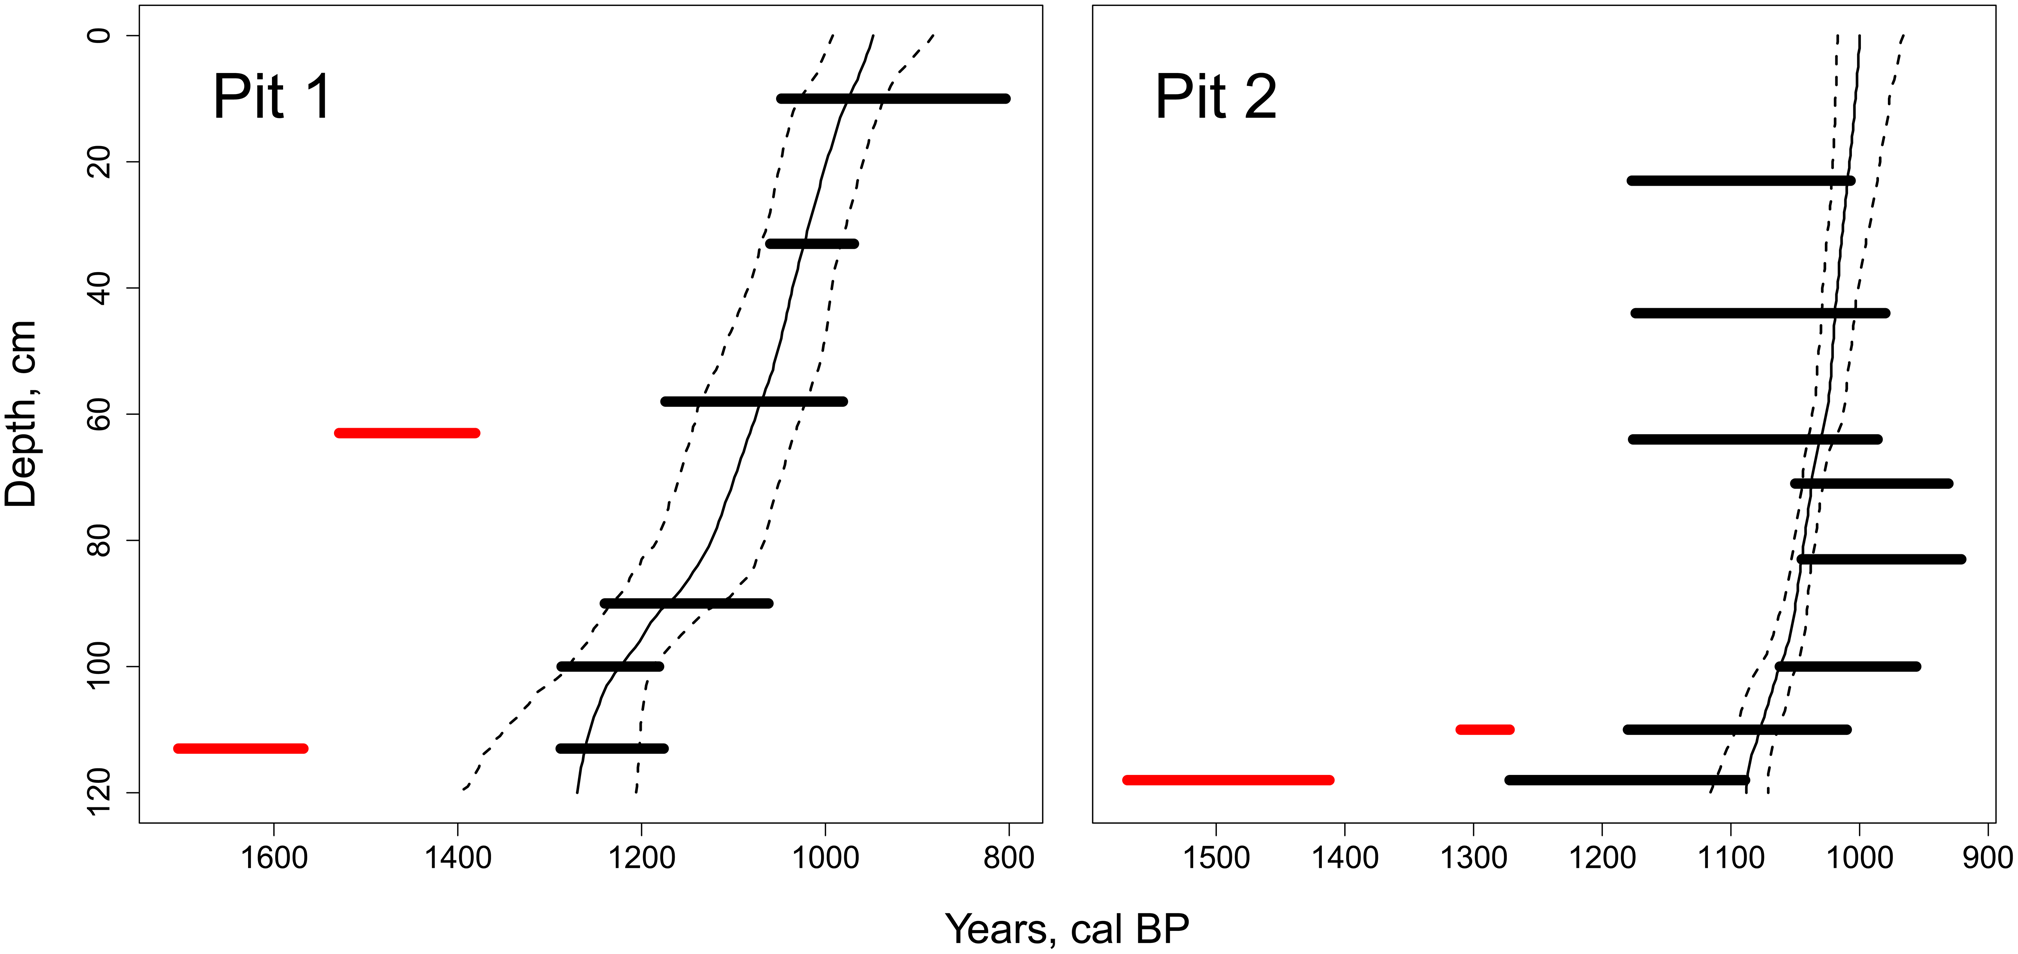
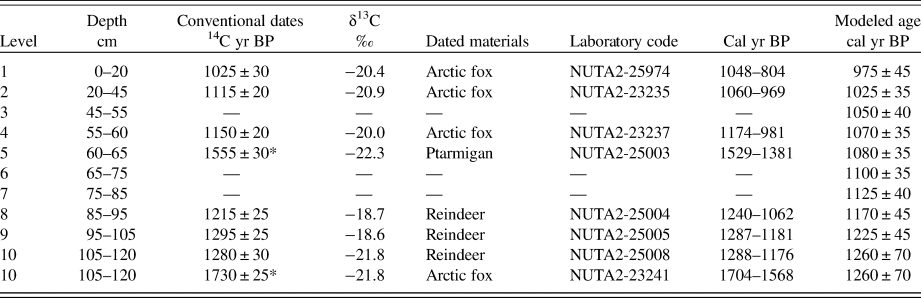
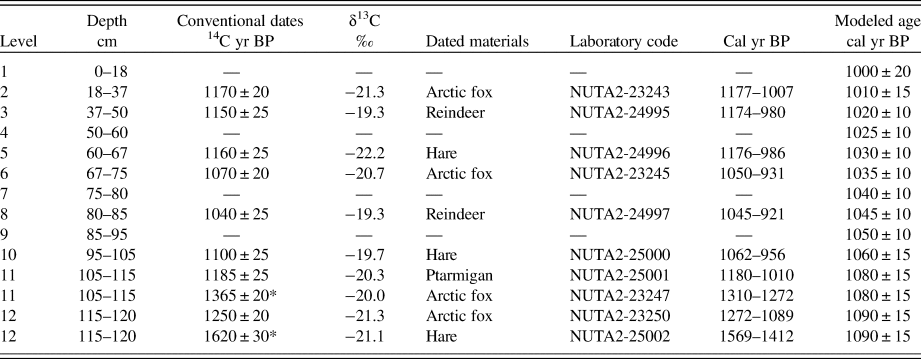
Radiocarbon dates of terrestrial animals from both excavation pits of the Kaniskak archaeological site are presented in Tables 1 and 2. First, we constructed age–depth models of both pits. Modeling was conducted in R package Bchron (Haslett and Parnell, Reference Haslett and Parnell2008; Parnell et al., Reference Parnell, Haslett, Allen, Buck and Huntley2008; Parnell, Reference Parnell2016). The results are presented in Figure 2. At this stage, two radiocarbon dates in each pit were identified as outliers and omitted from further analysis. Age–depth models based on the remaining dates allowed for age assessment of each level (Tables 1 and 2). It is clearly seen that the deposits were accumulating very fast, faster than 0.5 cm/yr. This means that even the thickest levels (20–25 cm thick) had been accumulating during several decades only, thus validating their use for ΔR assessments. Unfortunately, the lower parts of both deposits appear to be contaminated with older materials due to an unrecognized process(es).
Age–depth models constructed for Pit 1 (left) and Pit 2 (right) of the Kaniskak kitchen midden (Chukotka). Black segments show terrestrial radiocarbon dates used to construct age–depth models, red segments represent radiocarbon dates identified as outliers and omitted from the modeling.

Radiocarbon dates of terrestrial materials from the Pit 1 of the Kaniskak archaeological site and the results of the age–depth model construction.a

Note: Calibration was conducted with the OxCal v. 4.3.2 program (Bronk Ramsey, Reference Bronk Ramsey2009) and IntCal13 calibration curve (Reimer et al., Reference Reimer, Bard, Bayliss, Beck, Blackwell, Bronk Ramsey and Buck2013); the resulting intervals correspond to 95.4% probability. Modeling was conducted in R package Bchron (Parnell, Reference Parnell2016); asterisks mark dates identified during modeling as outliers.
Radiocarbon dates of terrestrial materials from Pit 2 of the Kaniskak archaeological site and the results of the age–depth model construction (designations are the same as in Table 1).

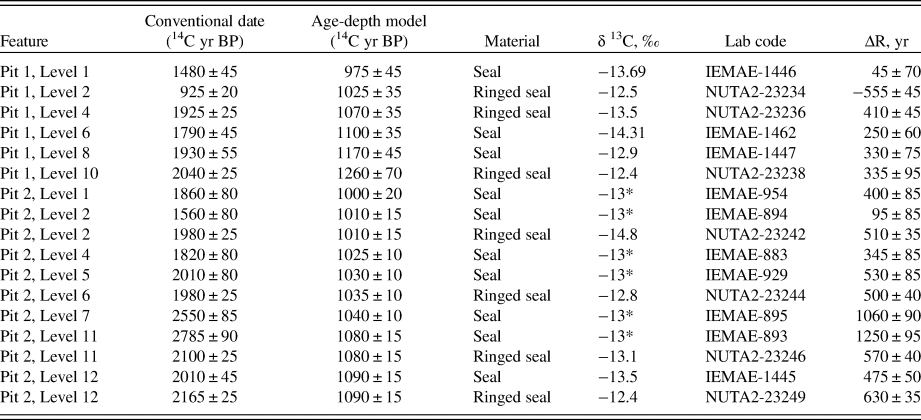
We next compared the age of each level with marine dates determined with bones of seals. The radiocarbon dates, along with age-level assessments, are presented in Table 3. Scintillation dates (laboratory code prefix IEMAE) were obtained with seal bones that were not identified before radiocarbon measurements (denoted as “Seal” in Table 3). However, bones of bearded seal (Erignathus barbatus) and spotted seal (Phoca largha) constitute only 8.1% and 0.2% of all seal bones in the Kaniskak archaeological site, respectively (Savinetsky, Reference Savinetsky2002; Gorlova and Vasyukov, Reference Gorlova and Vasyukov2013). Other seal bones belong to the ringed seal (Pusa hispida), and we can tentatively consider scintillation dates as conducted with remains of the latter species. For accelerator mass spectrometry (AMS) dates (laboratory code prefix NUTA2), limb bones (more precisely, femurs and ulnae) of ringed seal were sampled and identified using the osteological reference collection at the Laboratory of Historical Ecology, Institute of Ecology and Evolution RAS.
Marine radiocarbon dates of the Kaniskak archaeological site and age assessments for levels according to age–depth models.

aAsterisks mark estimated δ13C values.
One marine date (Pit 1, Level 2; 925 ± 20 14C yr BP) is younger than modeled age of the corresponding level (1025 ± 35 cal yr BP; Table 3) and the terrestrial date from the same level (1115 ± 20 14C yr BP; Table 1). Concluding the marine date was erroneous, we excluded this measurement from further analysis. Two marine dates (Pit 2, Levels 7 and 11; Table 3) are much older than others, yielding unusually high ΔR values previously not reported for the northern Pacific. They also appear to be erroneous due to the abovementioned contamination with older materials.
After the exclusion of the erroneous measurements, Pits 1 and 2 of the Kaniskak archaeological site yielded 14 ΔR assessments. Additionally, four marine shell dates (McNeely et al., Reference McNeely, Dyke and Southon2006) are available for Port Clarence and Teller (Seward Peninsula, Alaska; Fig. 1; see details in the Supplementary Tables).
Southwestern part of the Bering Sea
We used bones of sea otter of known collection date for ΔR value assessments in the Commander Islands (Fig. 1). Three sea otter skeletons had been sampled in March of 1939 and stored in the collection of the Moscow State University Zoological Museum. Unfortunately, the museum records do not specify the sampling site any further, but based on the completeness of sea otter skeletons, they were either hunted or, most likely, their carcasses were collected on the beach. According to observations conducted on Bering Island during 25 yr (1983–2007), from 38 to 700 (mean 280.6) bodies of sea otters per year were counted on the beach (Nikulin et al., Reference Nikulin, Vertyankin, Fomin and Tokranov2008). The results of radiocarbon dating of sea otter bones are presented in Table 4.
Radiocarbon dates of sea otter bones of known collection dates and their ΔR values for the Commander Islands.

We made another ΔR assessment with radiocarbon dates of marine and terrestrial materials from the archaeological site ATU-061 on Shemya Island in the western Aleutian Islands. ATU-061 is located on the southwestern coast of the island, west of Laundry Lake. It was investigated by the Western Aleutians Archaeological and Paleobiological Project (Corbett et al., Reference Corbett, West and Lefèvre2010). Pit 1 of this site (area: 2 m2) was excavated mostly in 10-cm-thick levels. Stratigraphically, it was represented by layers of sea urchin shells alternating with mammal, bird, and fish bones. We assayed three unidentified fish bones from different levels: Level 11 (110–120 cm), 3095 ± 155 14C yr BP (IEMAE-1175); Level 7 (70–80 cm), 3080 ± 110 14C yr BP (IEMAE-1205); and Level 2 (20–30 cm), 2965 ± 30 14C yr BP (NUTA2-24993). These dates suggest that the deposit accumulated very rapidly. The only terrestrial material available for dating, a right scapula of cackling goose (Branta hutchinsii), was found in Level 2 dating to 2130 ± 30 14C yr BP, δ13C = −23.3 ‰ (NUTA2-24992). The ΔR assessment for this location is based on this terrestrial date, paired with the marine date from the same level.
Corbett et al. (Reference Corbett, Causey, Clementz, Koch, Doroff, Lefevre, West, Rick and Erlandson2008) reported 14C dates of marine and terrestrial samples from the same archaeological context on Buldir Island. A detailed description of site KIS-008 was provided by Corbett (Reference Corbett2011). Age determination of an unidentified marine mammal bone excavated in Pit 4, Unit E of the site yielded a date of 1240 ± 40 14C yr BP (Beta-200551). Along with this value, samples of grass (330 ± 40 14C yr BP; Beta-200550) from the same location within the site can be used for ΔR calculations.
In total, five ΔR assessments were conducted for the western Aleutians, including the Commander Islands. Detailed information concerning these assessments is summarized in the Supplementary Tables.
Northern Kuril Islands
Fitzhugh and Brown (Reference Fitzhugh and Brown2018) estimated the ΔR for the northern and central Kuril Islands of Makarushi and Rasshua. Charcoal was used as the terrestrial material for each pair, while various invertebrates (sea urchins and gastropods) served as their marine counterparts. In total, 13 ΔR measurements were made (Fitzhugh and Brown Reference Fitzhugh and Brown2018; Supplementary Tables).
Southeastern part of the Bering Sea
Khasanov et al. (Reference Khasanov, Nakamura, Okuno, Gorlova, Krylovich, West, Hatfield and Savinetsky2015) reported results of ΔR assessments conducted for the Adak Islands (central Aleutian Islands). This data set consists of nine pairs of marine and terrestrial radiocarbon dates originating from three archaeological sites. West et al. (Reference West, Khasanov, Krylovich, Hatfield, Khasanov, Vasyukov and Savinetsky2019) studied radiocarbon dates of marine and terrestrial materials comprising six pairs of coeval samples from Carlisle Island (eastern Aleutian Islands). In both studies terrestrial dates were generated from ptarmigan bones or charred twigs of local shrubs, and marine dates came from bones of rockfish (Sebastes sp.) or greenlings (Hexagrammos sp.). Additionally, a radiocarbon date from a marine shell of known collection date was reported for Pavlof Harbor (Alaska Peninsula; Robinson and Thompson, Reference Robinson and Thompson1981). See the Supplementary Tables for detailed information on these ΔR assessments.
Southeast Alaska and British Columbia
Under this heading we consider 26 radiocarbon dates of marine shells of known collection date reported by McNeely et al. (Reference McNeely, Dyke and Southon2006) and spanning the area from Kodiak Island in the northwest to Vancouver Island in the southeast (Fig. 1, Supplementary Tables).
Radiocarbon dating
We collected samples of bone tissue of marine and terrestrial animals using a bone-cutting drill. Collagen was extracted using a modified Longin (Reference Longin1971) method. Bone fragments (0.5–0.3 g) were sampled from compact bone. Samples were washed, dried, and weighed. Bone fragments were soaked in 1 M HCl (4°C) until completely demineralized. Samples were then rinsed to neutrality with distilled water; then the demineralized bones were transferred to a slightly acidic solution (pH ~2.5) and heated in plastic tubes at 70°C for 24–36 h to gelatinize the collagen. The sample was then centrifuged, and the gelatinized collagen was transferred into glass vials. Vials were placed in a sealed oven at 80°C until all water was evaporated.
Radiocarbon dates of bone collagen were obtained by liquid scintillation counting methods (LSC) in the Laboratory of Historical Ecology (A.N. Severtsov Institute of Ecology and Evolution RAS, laboratory code prefix IEMAE) and by AMS at the Center for Chronological Research at Nagoya University (laboratory code prefix NUTA2). In the latter case, sample preparation for AMS (graphitization) was performed in the Radiocarbon Laboratory of the Institute of Geography RAS using an AGE-3 graphitization system (Ionplus).
ΔR calculations and statistics
In the case of marine samples of known collection date, modeled age is derived using the Marine13 calibration curve (Reimer et al., Reference Reimer, Bard, Bayliss, Beck, Blackwell, Bronk Ramsey and Buck2013), and ΔR is calculated as the difference between the measured radiocarbon age and modeled age. Estimation of a marine sample true age via radiocarbon dating of coeval terrestrial materials can be done in two ways. According to Stuiver and Braziunas (Reference Stuiver and Braziunas1993), the reservoir deficiency can be calculated without a direct calibration. One can plot model marine conventional 14C ages against atmospheric ones. The measured 14C age of the terrestrial sample is then converted into a model marine 14C age that is used for ΔR calculation. Due to the intricate form of the calibration curve, multiple marine 14C ages are characteristic for some atmospheric 14C ages (see example in Khasanov et al., Reference Khasanov, Nakamura, Okuno, Gorlova, Krylovich, West, Hatfield and Savinetsky2015). In these cases, several ΔR values would be obtained for a pair of marine and terrestrial materials, all of which must be used in the analysis. ΔR assessments obtained in this way are reported in the Supplementary Tables.
The other method of ΔR assessment is implemented in the R package deltar (West et al., Reference West, Khasanov, Krylovich, Hatfield, Khasanov, Vasyukov and Savinetsky2019). Detailed description of the deltar package is available at https://cran.r-project.org/web/packages/deltar/deltar.pdf. Briefly, the radiocarbon date of a terrestrial sample is calibrated with the IntCal13 calibration curve (Reimer et al., Reference Reimer, Bard, Bayliss, Beck, Blackwell, Bronk Ramsey and Buck2013), producing an often intricate probability distribution, from which one has to choose marine sample age assessments. In the deltar package, this is done through a numerical iterations approach: terrestrial calibrated dates are chosen from a grid of ages produced during calibration according to their probability, and a ΔR value is calculated for each. With a reasonable number of iterations, a representative series of ΔR value assessments is established. Central tendencies (mean and median), variance, and quantiles are then calculated with this series. The same approach is realized for marine samples, the true age of which is either known (samples from museum collections) or estimated via other dating methods. Another tool for ΔR assessments named “deltar” was recently developed (Reimer and Reimer, Reference Reimer and Reimer2017). It uses a similar calculation method and is available online (http://calib.org/deltar).
The ΔR assessments of the six predefined regions were first tested with a nonparametric Kruskal-Wallis rank sum test to ascertain whether samples map to the same distribution. Then regions were compared pairwise with a nonparametric rank sum test to identify which region has significantly different ΔR values. Series of ΔR value assessments obtained in a number of iterations using the deltar package were combined for each region, and corresponding probability distributions were plotted. In the resulting plot, the area under the curve is set equal to one. This procedure is analogous to combining radiocarbon dates in the OxCal program (Bronk Ramsey, Reference Bronk Ramsey2009). All computations and plots were conducted in the R environment (R Core Team, 2017).
RESULTS
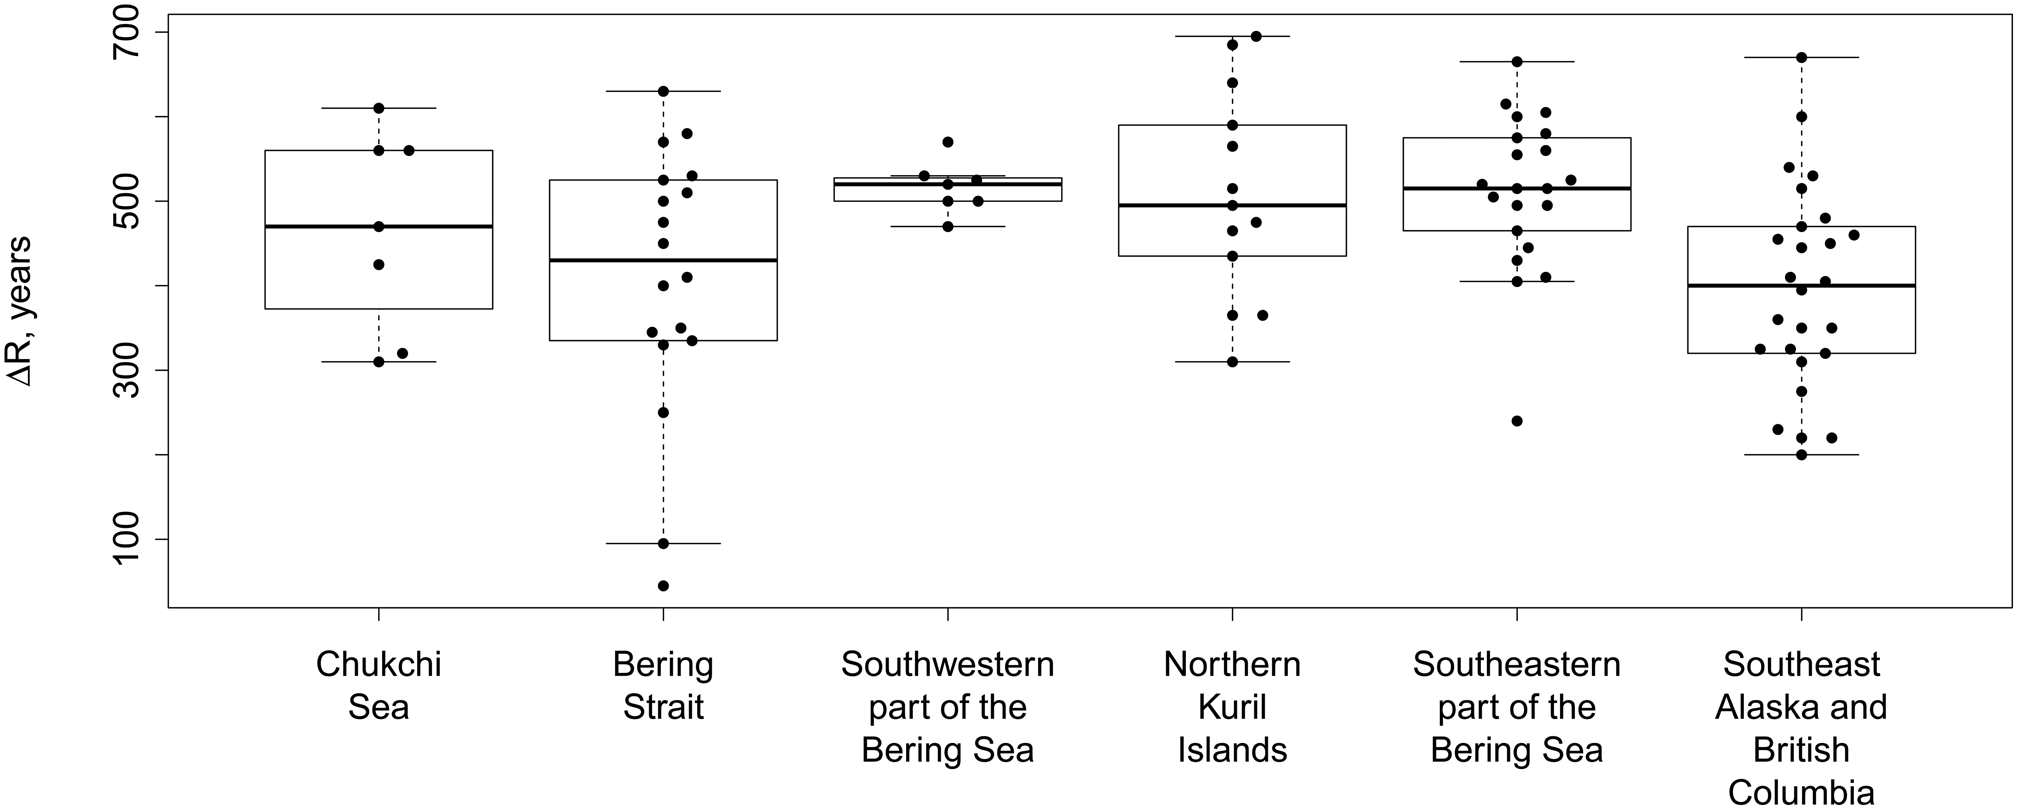
All ΔR assessments obtained for each of the six regions (Fig. 1) are presented in the Supplementary Tables. The resulting values are plotted in Figure 3. A Kruskal-Wallis rank sum test shows (χ2 = 15.655, df = 5, P = 0.008) that there are significant differences in ΔR values between these regions. The pairwise tests show that southeast Alaska and British Columbia have significantly lower ΔR than those of the southeastern (P = 0.001) and the southwestern (P = 0.008) regions of the Bering Sea and the northern Kuril Islands (P = 0.015). No other pairs show statistically significant differences.
Box plot of the ΔR estimates conducted for the six regions of the northern Pacific.

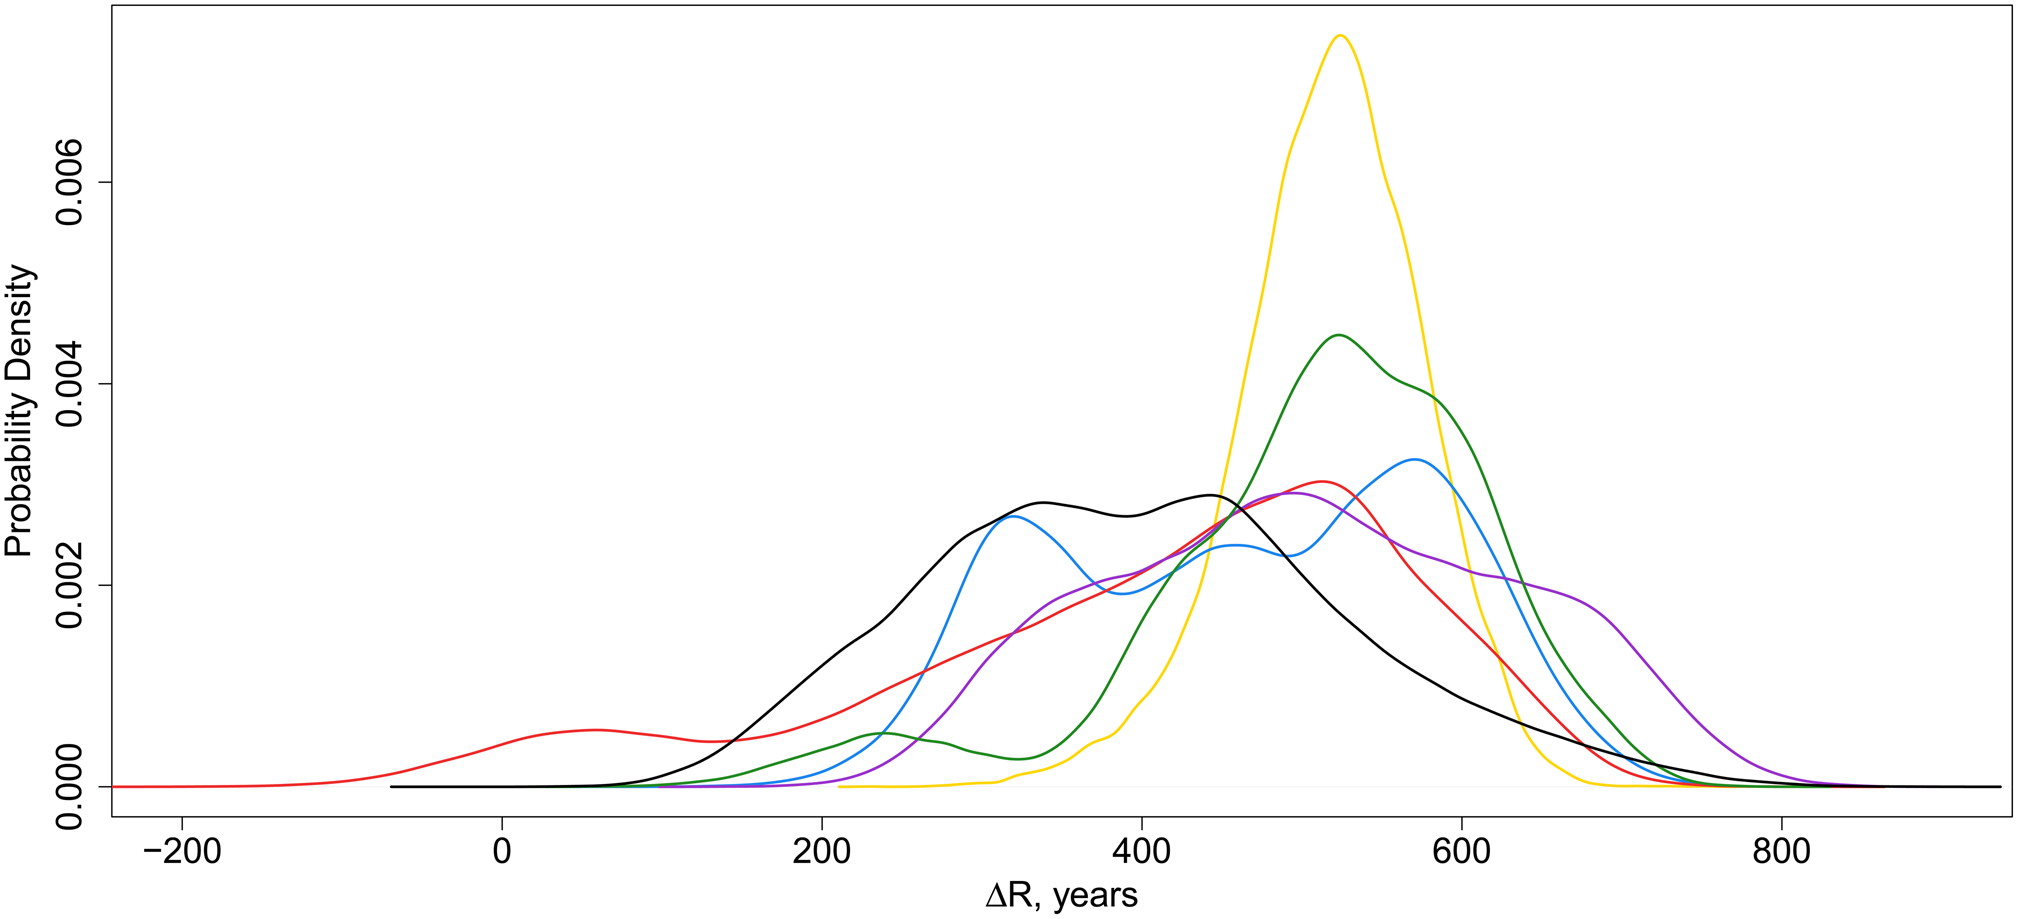
Figure 3 reveals large intraregional ranges of ΔR values. This variability can also be illustrated with probability density plots (Fig. 4). We make several observations from these figures. First, the shapes of curves obtained for most of the regions are similar: they are skewed to the right, they have a mode ΔR value around 525 yr, and the probability of a given ΔR value gradually diminishes toward lower ΔR values. The ΔR assessments obtained for southeast Alaska and British Columbia (black line in Fig. 4) are again different from the others. Taking into account the results of rank sum tests and probability density plots, we can conclude that the character of the distribution of the ΔR assessments is essentially the same in all studied regions except southeast Alaska and British Columbia.
Probability density plots of the ΔR estimates conducted for the six regions of the northern Pacific, the area under the each curve is equal to one. Blue line, Chukchi Sea; red line, Bering Strait; gold line, southwestern part of the Bering Sea; violet line, northern Kuril Islands; green line, southeastern part of the Bering Sea; black line, southeast Alaska and British Columbia.

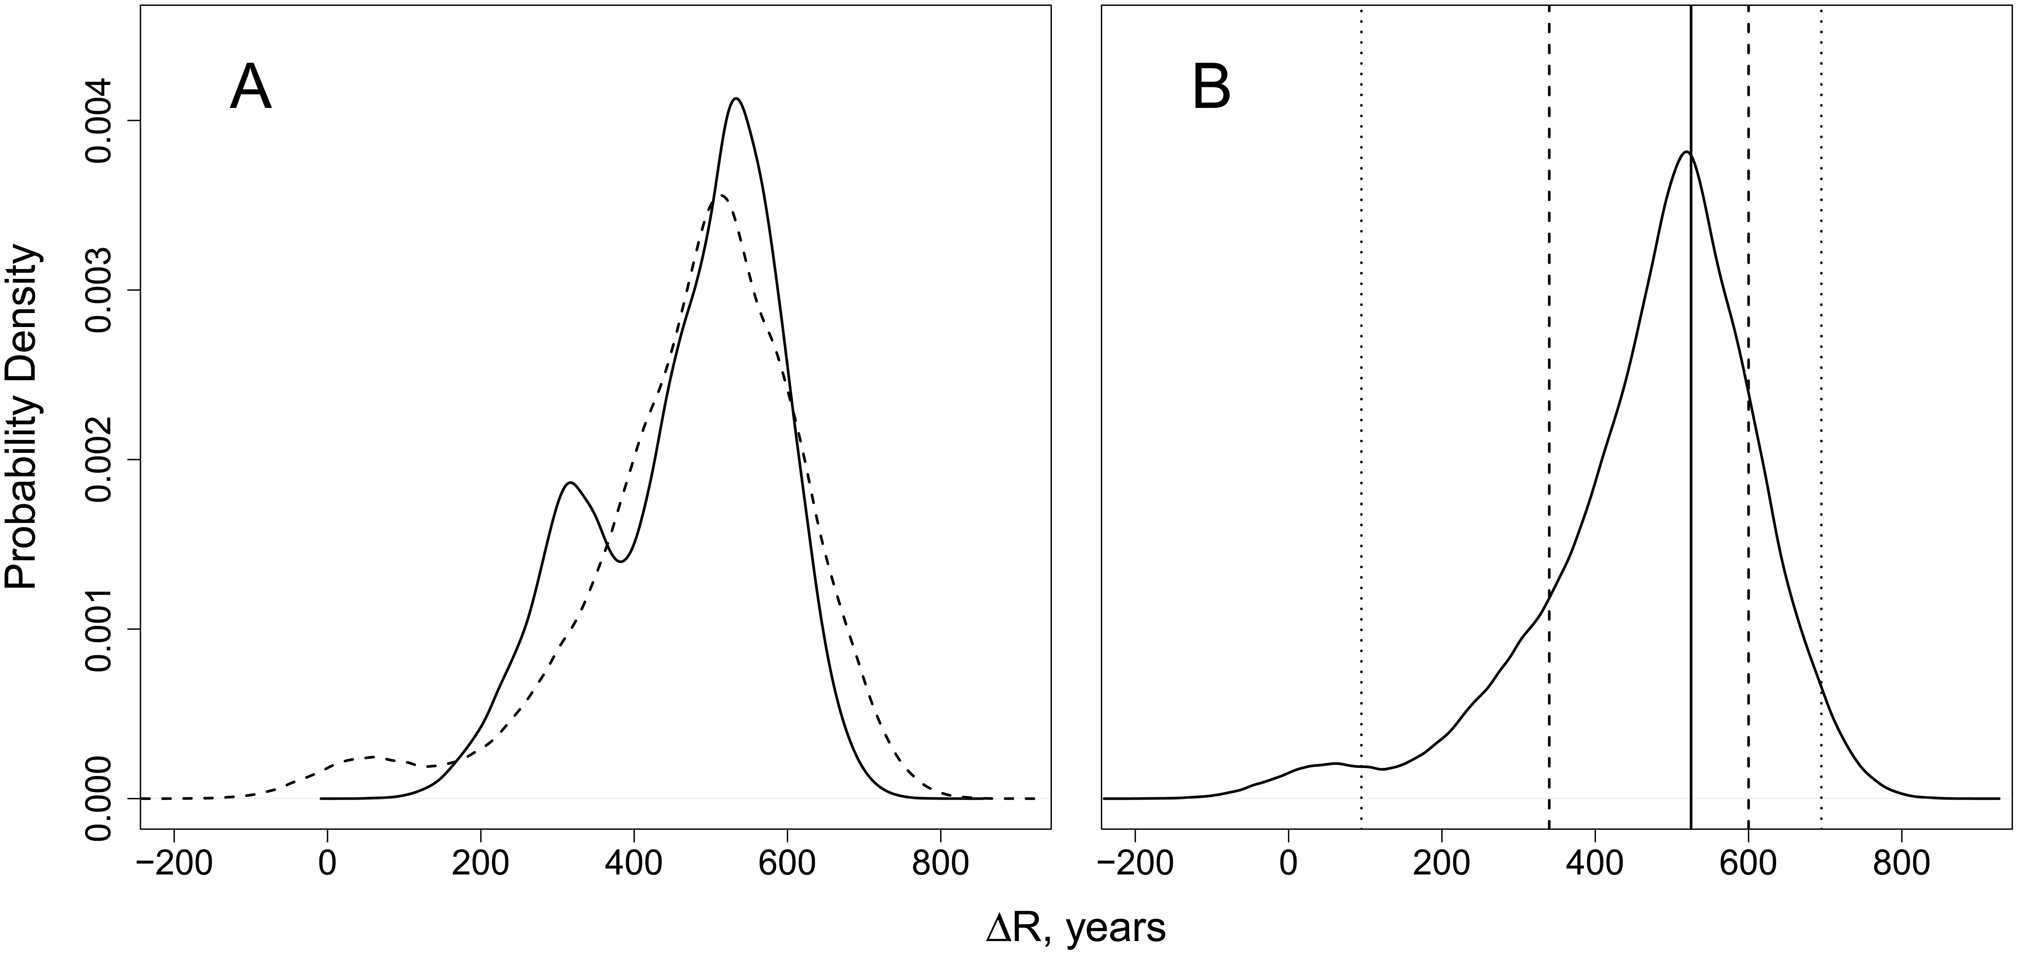
The ΔR assessments described above were obtained either through dating marine organisms with known collection dates or comparing radiocarbon ages of marine and terrestrial materials originating from the same archaeological context. In the latter case, archaeological data are supposed to secure the assumption that marine and terrestrial organisms of each pair are coeval. However, there are many reasons why this assumption may be misleading. In Figure 5A we compared probability density plots of ΔR assessments conducted using both approaches across the northern Pacific (Fig. 1), except southeast Alaska and British Columbia. Both curves have very similar shape (skewed to the right, modes around 525 yr, probability gradually diminishing toward lower ΔR values). Yet the “archaeological” curve has wider variability, no doubt related to the additional uncertainties surrounding archaeological data. Nevertheless, we combined both curves (Fig. 5B) in order to estimate a single ΔR distribution for the northern Pacific. The 95% confidence interval for this value ranges from 95 to 695 yr, the 68% confidence interval ranges from 340 to 600 yr, and the mode is 525 yr.
Probability density plots of the ΔR estimates combined for the five regions of the northern Pacific (ΔR assessments for southeast Alaska and British Columbia are excluded). (A) Probability density plots of the ΔR estimates conducted with samples of known collection date (solid line) and with paired samples from archaeological sites (dashed line). (B) Probability density plots of the ΔR estimates conducted with all samples. Vertical dashed and dotted lines show 68.2% and 95.4% confidence intervals, respectively; solid vertical line shows most frequent value, 525 yr.

The most prominent feature of the resulting probability density curve is its asymmetry. We suggest that an explanation can be derived from the description of marine organisms used for ΔR assessments. Paired dates in the Kuril Islands (Fitzhugh and Brown, Reference Fitzhugh and Brown2018) were conducted on marine shells, namely echinoderms and gastropods, collected by ancient humans in the littoral zone. The data set presented by McNeely et al. (Reference McNeely, Dyke and Southon2006) consists of measurements conducted on various species of shells as well. By contrast, bones of ringed seals caught by ancient hunters and bones of sea otters of known collection date were used for ΔR assessments in the Chukotka and Commander Islands, respectively, and bones of rockfish and greenlings constituted marine counterparts in the Aleutian Islands (Khasanov et al., Reference Khasanov, Nakamura, Okuno, Gorlova, Krylovich, West, Hatfield and Savinetsky2015; West et al., Reference West, Khasanov, Krylovich, Hatfield, Khasanov, Vasyukov and Savinetsky2019).
The shapes of the probability density curves of the ΔR assessments obtained for various regions of the northern Pacific are compared in Figure 4. It is seen that ΔR assessments conducted in southwestern and southeastern parts of the Bering Sea (golden and green lines, respectively) are closer to a symmetric curve and have narrower ranges. The narrowness of their ranges is also seen in Figure 3 (note that the lowermost point in southeastern part of the Bering Sea is the radiocarbon date of a shell). The ΔR assessments were made with bones of sea otters and rockfish and greenlings. These species reside within coastal waters throughout their life histories. ΔR assessments obtained with shells and ringed seals (Chukchi Sea, Bering Strait, and northern Kuril Islands) have wider ranges and more asymmetric probability density curves (Figs. 3 and 4).
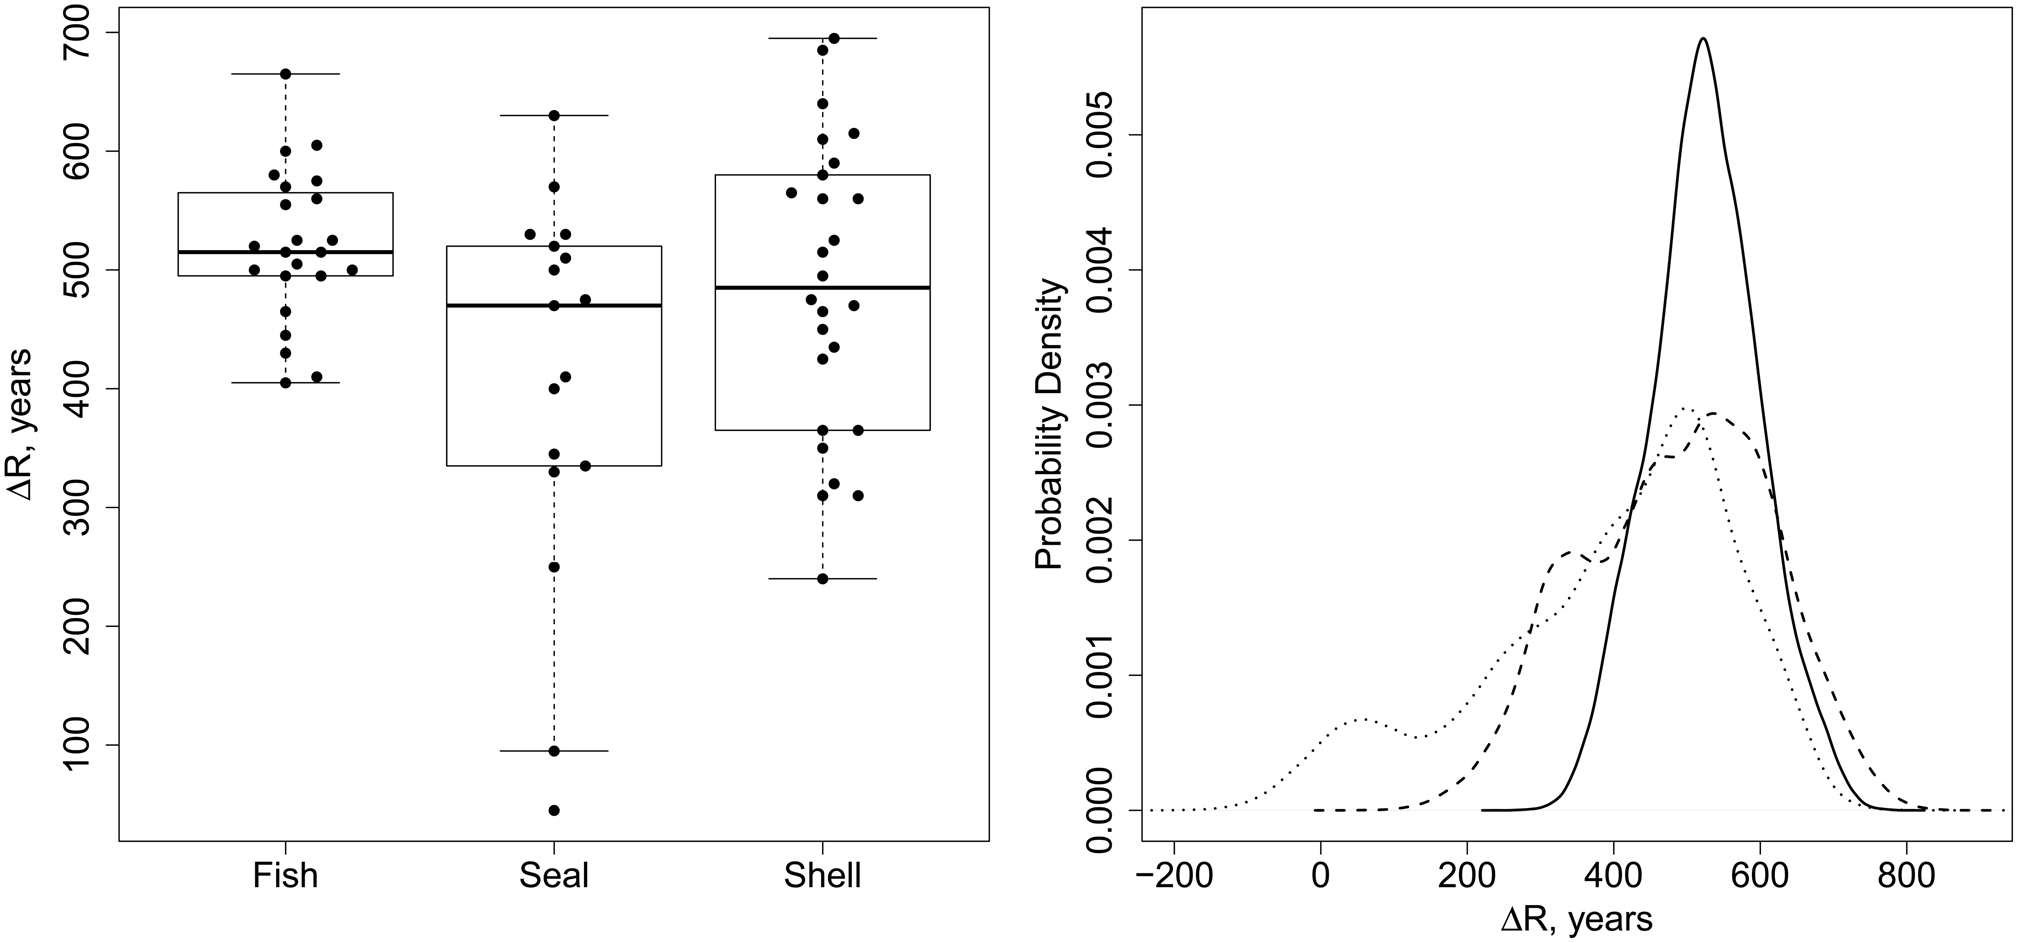
We can compare ΔR assessments made with various species of marine animals (Fig. 6). Here, the Fish group represents ΔR estimates obtained with sea otters and small fish in the Commander and Aleutian Islands (Supplementary Tables), the Seal group consists of measurements made with ringed seals in Chukotka, and the Shell group incorporates radiocarbon dates of shells from the northern Kuril Islands (Fitzhugh and Brown, Reference Fitzhugh and Brown2018) and the data set presented by McNeely et al. (Reference McNeely, Dyke and Southon2006). The Kruskal-Wallis rank sum test does not show significant differences between these groups, but an F-test of variances does show that variance of the Fish group is significantly lower than those of the Seal and Shell groups (P = 0.0001 and 0.003, respectively). Shapes of the probability density curves are also different. While those of the Seal and Shell groups have characteristically asymmetric forms with mode values around 525 yr, the probability density curve of the Fish group is symmetric (mean and median are both equal to 525 yr).
Box plot (left) and probability density plots (right) of the ΔR estimates combined for various species of marine animals. Fish group (solid line) represents ΔR estimates obtained with sea otters and small fish in the Commander and Aleutian Islands (see the Supplementary Tables); Seal group (dotted line) consists of measurements made with ringed seals in Chukotka; Shell group (dashed line) incorporates radiocarbon dates of shells from the northern Kuril Islands (Fitzhugh and Brown, Reference Fitzhugh and Brown2018) and the data set presented by McNeely et al. (Reference McNeely, Dyke and Southon2006).

DISCUSSION
The data sets included in this analysis were obtained across the northern Pacific (Fig. 1) from the Chukchi Sea in the north to Kuril Islands and British Columbia in the south. It is shown that character of the distribution of the ΔR values is essentially the same across the studied area except for southeast Alaska and British Columbia. ΔR assessments estimated for this region were significantly lower than in the other parts of the North Pacific. Similar results have been recently obtained for Prince Rupert Harbour in British Columbia (Edinborough et al., Reference Edinborough, Martindale, Cook, Supernant and Ames2016; Martindale et al., Reference Martindale, Cook, McKechnie, Edinborough, Hutchinson, Eldridge, Supernant and Ames2018). Decreased ΔR values observed from Kodiak to Vancouver Island (Fig. 1) can be explained by the fact that their assessments were conducted with shells, many of which were from organisms that inhabited narrow straits and inlets between the islands of the highly indented coast of the Pacific Ocean. In these environments, freshwater runoff from North America mixes with marine waters, shifting 14C content closer to atmospheric ranges, which could bias regional reservoir offset in southeast Alaska and British Columbia, and we decided to exclude data for this region from the analysis.
The data included in this analysis were obtained using two methods. ΔR assessments for the Commander Islands (Table 4) were conducted on sea otter bones of known collection dates. Radiocarbon dating of seashells from museum collections yielded 12 ΔR measurements for the Chukchi Sea, Norton Sound, and Alaska Peninsula (Fig. 1, Supplementary Tables). On the other hand, multiple paired radiocarbon dates of coeval marine and terrestrial materials from archaeological sites were obtained for Chukotka; the western, central, and eastern Aleutian Islands; and the northern Kuril Islands (see the Supplementary Tables for details). Probability density plots of ΔR assessments conducted through both approaches (Fig. 5A) showed that the resulting curves had essentially the same shapes. Both are skewed to the right and have a mode ΔR value around 525 yr, and the probability of a given ΔR value more or less gradually diminishes toward lower ΔR values. The similarity of the results of both methods supports combining them (Fig. 5B). The resulting curve incorporates all ΔR assessments made for the following regions of the North Pacific (Fig. 1): Chukchi Sea, Bering Strait, southwestern part of the Bering Sea, northern Kuril Islands, and southeastern part of the Bering Sea (Supplementary Tables). ΔR values lie within a range from 95 to 695 yr with 95% probability, the 68% confidence interval ranges from 340 to 600 yr, and the modal value is 525 yr.
However, ΔR assessments recently obtained for Point Barrow (Chukchi Sea; Krus et al., Reference Krus, Jensen, Hamilton and Sayle2019) yielded a value of 450 ± 84 yr, which is in agreement with the abovementioned confidence interval but somewhat smaller than the modal value. It is worth noting that the Chukchi Sea is influenced not only by the Pacific waters coming from the Bering Strait but by waters of another origin as well. Significant differences between Chukchi Sea waters and those of the Bering Sea may arise due to input of freshwater from the mouths of the Colville and Mackenzie Rivers, currents bringing water of the Beaufort Gyre from the east and the North Atlantic Ocean from the west, upwelling of the deep ocean water, and so on (Krus et al., Reference Krus, Jensen, Hamilton and Sayle2019). Moreover, ΔR values of the Chukchi Sea, as well as those of the northern Pacific, might be subjected to natural variability over time caused by fluctuations of the annual thawing patterns of sea ice or changes in the annual discharge of riverine terrigenous carbon (Krus et al., Reference Krus, Jensen, Hamilton and Sayle2019). Unfortunately, the available data do not permit assessment of this issue in a more comprehensive way.
As in this paper, Fitzhugh and Brown (Reference Fitzhugh and Brown2018) also analyzed ΔR estimates available for the North Pacific. The present analysis adds original ΔR estimates for Chukotka, the Commander Islands, and Shemya Island (Supplementary Tables), which have been reported here for the first time. We also include recently published data from Carlisle Island (West et al., Reference West, Khasanov, Krylovich, Hatfield, Khasanov, Vasyukov and Savinetsky2019). Without these new data, Fitzhugh and Brown (Reference Fitzhugh and Brown2018) argued that the central North Pacific is represented by well-mixed, 14C-depleted waters characterized by the same ΔR value. The mean of all ΔR assessments analyzed by Fitzhugh and Brown (Reference Fitzhugh and Brown2018) yielded a ΔR estimate in the range of 440 ± 127 yr. The authors suggested that this value is a reasonable correction for any coastal marine organism in the region, but noted that “this estimate can be improved in the future with new marine-terrestrial paired date comparisons covering a greater temporal range and at more locations throughout the region, but especially the Aleutians and western Bering Sea” (Fitzhugh and Brown Reference Fitzhugh and Brown2018, p. 10). With the addition of new data to fill these gaps, we support the conclusion of a well-mixed central North Pacific, Bering Sea, and Chukchi Sea. Even so, the shape of the combined North Pacific probability density distribution (Fig. 5B) is asymmetric, suggesting that the arithmetic mean value is a less appropriate measure of the ΔR central tendency.
The observed asymmetry of the resulting probability density curve can be rooted in the differences of the isotopic signatures of the radiocarbon-dated marine animals. ΔR assessments obtained with shells and ringed seals (Chukchi Sea, Bering Strait, northern Kuril Islands, and Alaska Peninsula) have wider ranges and asymmetric probability density curves (Fig. 6) than fish and sea otters (the Fish group). We suggest that the isotopic composition of shells as slowly moving animals can be significantly affected by local conditions. For example, creeks adding freshwater into more or less closed lagoons and estuaries can alter reservoir effects seasonally. The combination of samples more and less influenced by fresh- and saltwater could drive the asymmetric (right-skewed) probability density curves (Fig. 6, right). Observed variations of the ΔR values obtained with shells may also arise as a result of differences between molluscan species being used for radiocarbon measurements (McNeely et al., Reference McNeely, Dyke and Southon2006).
On the other hand, ringed seals can seasonally migrate at substantial distances in Beaufort, Chukchi, and Bering Seas (Kelly et al., Reference Kelly, Badajos, Kunnasranta, Moran, Martinez-Bakker, Wartzok and Boveng2010; Crawford et al., Reference Crawford, Frost, Quakenbush and Whiting2012; Harwood et al., Reference Harwood, Smith and Auld2012), thus residing in waters with various isotopic signatures (Dumond and Griffin Reference Dumond and Griffin2002). Migration ranges and regions differ between ringed seals of various geographic groups and ages. For example, juvenile and subadult seals are more mobile than adults (Crawford et al., Reference Crawford, Frost, Quakenbush and Whiting2012). This difference may even affect isotopic signatures of their bone collagen (Gorlova et al., Reference Gorlova, Krylovich, Savinetsky and Khasanov2012). If North Pacific oceanic surface waters are typically influenced by old carbon, shells and ringed seals experiencing more terrestrial conditions locally and through their life histories would bias their ΔR assessments toward lower values.
By contrast, sea otters and small fish reside within coastal waters throughout their life histories. They neither engage in long migrations nor remain tied to microregions. These animals move through habitats at scales of a few to tens of kilometers, averaging the isotopic composition of seawaters in their bone collagen. As a result, it appears that organisms like sea otters and small fish provide more reliable “average” ΔR values for North Pacific surface waters. ΔR assessments made for the Fish group yielded a mean value of 525 yr. As the shape of the probability density curve for this group turned out to be symmetric (Fig. 6, right), we are able to provide estimation of the variance, 525 ± 75 yr.
We believe that this value is a reasonable assessment of the northern Pacific reservoir offset, which can be used during calibration of radiocarbon dates conducted with coastal marine organism. However, it should be stressed that not all marine species are equally appropriate for establishing an absolute chronology. It is obvious that migrating animals represent a special case, and estimation of the ΔR suitable for them needs special treatment. Yet, as has been shown here, marine shells, a traditional material for dating, can be significantly influenced by local conditions due to their very restricted living area. In any case, revision of the reservoir offset estimates would benefit from additional dating of small coastal fish and nonmigrating mammals.
CONCLUSION
This study provides additional support to the hypothesis (Fitzhugh and Brown, Reference Fitzhugh and Brown2018) that regions of the North Pacific Subarctic Gyre and oceanographically derivative regions of the North Pacific, Bering, and adjacent seas are characterized by a roughly equivalent reservoir offset. In this respect it is worth noting that ΔR estimates for waters of the Oyashio and East Sakhalin Currents and the Okhotsk Sea yielded values of 393 ± 32 and 578 ± 50 yr, respectively (Kuzmin et al., Reference Kuzmin, Burr, Gorbunov, Rakov and Razjigaeva2007; Yoneda et al., Reference Yoneda, Uno, Shibata, Suzuki, Kumamoto, Yoshida, Sasaki, Suzuki and Kawahata2007), which fall within the range of estimates reported for the northern Pacific so far (McNeely et al., Reference McNeely, Dyke and Southon2006; Khasanov et al., Reference Khasanov, Nakamura, Okuno, Gorlova, Krylovich, West, Hatfield and Savinetsky2015; Fitzhugh and Brown, Reference Fitzhugh and Brown2018; West at al., Reference West, Khasanov, Krylovich, Hatfield, Khasanov, Vasyukov and Savinetsky2019; this study).
Having a secure ΔR estimate is essential for the calibration of marine radiocarbon dates for the construction of absolute chronologies. Many archaeological sites excavated in the coastal environment of the northern Pacific do not provide terrestrial materials sufficient for dating. The results presented here demonstrate that ΔR estimates conducted for the studied region are characterized by wide ranges and asymmetric probability density curves, and it is hard to select a ΔR value to use during calibration. Nonetheless, we show that some species of marine organisms are probably better suited for ΔR measurements than others. Sea otters and small fishes residing within coastal waters throughout their life histories appear to provide more consistent estimates of the northern Pacific reservoir offset converging on a ΔR value of 525 ± 75 yr.
ACKNOWLEDGMENTS
The authors are greatly indebted to the Aleut Corporation and the Alaska National Maritime Refuge for supporting the work conducted on Adak and in the Islands of the Four Mountains. Authors are also very thankful to A.A. Lissovsky from the Moscow State University Zoological Museum for providing samples of sea otter bones collected in the Commander Islands. This study was financially supported by the National Science Foundation (grants OPP 1301927 and OPP 0353065) and the Russian Foundation for Basic Research (grant 18-04-00782-a). The Russian programs Living Nature, Bioresources, and Origin and Evolution of Biosphere provided additional funding and support. The authors are greatly indebted to E.P. Zazovskaya for invaluable help with sample graphitization. Any opinions, findings, and conclusions or recommendations expressed in this material are those of the authors and do not necessarily reflect the views of the National Science Foundation.
SUPPLEMENTARY MATERIAL
The supplementary materials for this article can be found at https://doi.org/10.1017/qua.2020.27.