




No CrossRef data available.
Article contents
- Abstract
- PREVIOUS SLA RESEARCH
- PREVIOUS NON-SLA RESEARCH
- METHOD
- RESULTS
- DISCUSSION
- CONCLUSION
- APPENDIX A: ENHANCED WRITTEN TEXT
- APPENDIX B: COMPREHENSION TASK
- APPENDIX C: MULTIPLE-CHOICE RECOGNITION TASK
- APPENDIX D: FILL-IN-THE-BLANK CONTROLLED WRITTEN PRODUCTION TASK
- APPENDIX E: WORKSHEET
- References
TO THINK ALOUD OR NOT TO THINK ALOUD: The Issue of Reactivity in SLA Research Methodology
Published online by Cambridge University Press: 05 February 2004
Article contents
- Abstract
- PREVIOUS SLA RESEARCH
- PREVIOUS NON-SLA RESEARCH
- METHOD
- RESULTS
- DISCUSSION
- CONCLUSION
- APPENDIX A: ENHANCED WRITTEN TEXT
- APPENDIX B: COMPREHENSION TASK
- APPENDIX C: MULTIPLE-CHOICE RECOGNITION TASK
- APPENDIX D: FILL-IN-THE-BLANK CONTROLLED WRITTEN PRODUCTION TASK
- APPENDIX E: WORKSHEET
- References
Abstract
Recently, several studies in SLA (e.g., for discourse, Alanen, 1995; Leow, 2001b; Rott, 1999; for problem-solving tasks, Leow, 1998a, 1998b, 2000, 2001a; Rosa & Leow, in press a, in press b; Rosa & O'Neill, 1999) have addressed the operationalization and measurement of attention (and awareness) in their research methodology. Studies have employed think-aloud protocols to gather concurrent, on-line data on learners' cognitive processes while they interacted with L2 data. However, the issue of reactivity—the act of thinking aloud potentially triggering changes in learners' cognitive processes while performing the task—has not been empirically addressed in the SLA field. The present study empirically addresses the effects of thinking aloud during the reading process on learners' comprehension, intake, and controlled written production. Participants were first-year college-level students of Spanish exposed to the same passage, pretest, and posttest assessment tasks but differed on type of condition (±think aloud). Results indicate that reactivity does not play a significant role in learners' subsequent performances.We would like to especially thank the SSLA statistician and our own statistician Dr. Rusan Chen for improving the statistical section of our study.
Information
- Type
- Research Article
- Information
- Copyright
- 2004 Cambridge University Press
Several strands of studies in SLA over the last decade have attempted to theoretically and empirically address the role of attention (and awareness) in classroom foreign language learning. Strands include types of formal instruction (e.g., processing instruction, focus on form, and consciousness-raising) and types of formal exposure (e.g., input enhancement, input flooding, and implicit vs. explicit learning conditions). To address the effects of formal instruction or exposure, most SLA studies have employed a pretest + instruction-exposure + posttest research design to draw conclusions about the benefits or lack thereof of such instruction or exposure on learners' subsequent processing of the second or foreign language (L2) data. More recently, one line of theoretical and empirical investigation (e.g., Leow, 1997a, 1998a, 1998b, 1999, 2000, 2001a, 2001b; Rosa & Leow, in press a, in press b; Rosa & O'Neill, 1999) has begun to address the methodological issue of internal validity (for further discussion, see Leow, 1999, 2000), which has clearly not been considered as part of the research design of previous research conducted within an attentional framework. To operationalize and measure the role of attention (and awareness) in their studies, these researchers have employed verbal reports (e.g., the think-aloud protocol) to gather concurrent data on learners' cognitive processes while they interacted with the L2 data.
The use of verbal reports to investigate cognitive processes in many areas of psychology, cognitive science, and education is not a new data-elicitation procedure. Indeed, this source of data has been enjoying quite a substantial increase in its importance for elucidating a clearer picture of internal processes employed by adult learners (for reviews, see Ericsson & Simon, 1993; Faerch & Kasper, 1987; Pressley & Afflerbach, 1995). However, all verbal reports are not equal. It is important to point out the different methods of eliciting verbal reports, broadly categorized as either introspective (concurrent or on-line) or retrospective (on-line or off-line) and metalinguistic or nonmetalinguistic (Ericsson & Simon). In metalinguistic verbalization, the researcher may ask for specific information (e.g., reasoning or explanation), and learners provide a metacognitive report on what they think their processes are. In nonmetalinguistic verbalization, learners are focused on the task with the think-aloud secondary and only voice their thoughts without explaining them. Cohen (2000) distinguished metalinguistic verbalizations from nonmetalinguistic verbalizations by characterizing the former as self-observational and the latter as self-revelational.
The introspective-retrospective distinction is at least as important to clarify as the metalinguistic or nonmetalinguistic distinction. Introspective verbalization is gathered as participants are performing a task. Hence, verbalizations are not constrained by memory. Retrospective verbalization is usually conducted immediately after some form of processing has taken place, either during specific breaks in the actual task (on-line) or immediately after the completion of the task (off-line). This type of verbalization has been critiqued for the potential effects of memory constraints and reconstructive processes—that is, additional information reported in one's recall of the data (Nisbett & Wilson, 1977). For verbalizations to reflect learners' processes, it has been recommended that introspective, nonmetalinguistic verbalizations be gathered (Cohen, 2000; Ericsson & Simon, 1993).
For verbalizations to be captured efficiently and to be reliable and complete, established and dependable procedures such as those laid out by Ericsson and Simon (1993), Cohen (2000), and Wade (1990) should be followed. It has been suggested that, before collecting verbal protocols, a researcher should consider the characteristics of both the participants and the materials to be used. Tasks should be carefully selected on the basis of their compatibility with thinking aloud. Also, hypotheses and a coding procedure should ideally be determined a priori to collecting the verbal reports. While collecting protocols, it is vital that researchers give participants clear instructions that do not lead them to provide speculation on their metalinguistic reasoning. A warm-up period is recommended to accustom participants to thinking aloud while completing the tasks. Finally, for verbal reports to be complete, reminders to think aloud should be provided when there is a lapse in participants' verbalization. After verbal reports are collected, they must be transcribed and encoded, and interrater reliability should be assessed. With adequate coding, both qualitative and quantitative analyses can be carried out. Qualitative analyses of verbal reports can provide unique insights into learners' processing. Quantitative analyses can offer firm and generalizable conclusions. Whether qualitatively or quantitatively, results should be systematically analyzed and finally reported.
PREVIOUS SLA RESEARCH
Verbal reports in SLA studies have been mainly used to explore the cognitive strategies adult learners use while reading an L2 text and their potential effects on subsequent comprehension (e.g., Carrell, 1989; Cohen, 1986; Pritchard, 1990). Pressley and Afflerbach (1995) surveyed 38 studies of first language (L1) reading that use verbal reports and were able to classify strategies as before reading, during reading, after reading components, evaluating, and monitoring. Verbal reports have also provided insight into links between L1 and L2 reading strategies (Davis & Bistodeau, 1993; Nevo, 1989). Likewise, L2 test-taking strategies have been observed using verbal reports (Cohen, 2000; Norris, 1992).
Verbal reports have not only been used to determine L1 and L2 strategies but also in empirical research, typically with problem-solving tasks. These verbal reports provided a more robust type of data that cannot be obtained through pretest + treatment + posttest research methodology. Leow (1997a, 1998a, 1998b, 2000, 2001a, 2001b), Rosa and Leow (in press a, in press b), and Rosa and O'Neill (1999) assessed attention and awareness and found that different levels of attention and awareness appear to correlate with performance. Alanen (1995) employed on-line think-alouds to compare explicit information versus implicit textual enhancement. She reported that participants who noticed the linguistic form, regardless of treatment type, demonstrated acquisition of at least some aspects of the targeted forms. The quantitative use of verbal reports in addition to behavioral data can strengthen an empirical study's support for a hypothesis or theory, given that it offers converging evidence not otherwise available.
Although verbal reports offer many benefits, they are not without controversy. The validity of the use of concurrent think-aloud protocols to elicit metalinguistic on-line data of learners' processes as they interact with L2 experimental data has been critiqued. Nisbett and Wilson (1977) suggested that access to metalinguistic information is limited and that participant reports often do not coincide with behavior. Olson, Duffy, and Mack (1984) suggested that verbal reports results may vary due to at least one of the following variables: instructions given, type of material, and nature of data analysis. Lyons (1986) purported that participants may not fully report information.
As pointed out by Leow (2002), a more serious critique for concurrent verbal reports is the issue of reactivity in SLA methodology: By thinking aloud, participants' internal processes may differ from what they would have been had they not performed the verbalization. In SLA, this critique appears to be leveled against introspective, metalinguistic verbalization that potentially promotes “dual processing—performing some learning task and commenting on their thinking processes” (Ellis, 2001, p. 37, note 14). Similarly, Jourdenais (2001), drawing from the findings of an unpublished doctoral dissertation (Jourdenais, 1998) that employed on-line, nonmetalinguistic verbalizations gathered while learners were engaged in written production but not during exposure to the L2 data, cautioned that “the think aloud data collection method itself acts as an additional task which must be considered carefully when examining learner performance” (2001, p. 373). However, the caution that thinking aloud while completing an L2 reading task may impede learners' natural cognitive processes and result in data that are not rational or logically coherent is based more on anecdotal rather than empirical evidence (see also Seliger, 1983; Stratman & Hamp-Lyons, 1994). The potential impact of reactivity in studies that employ concurrent data elicitation procedures remains to be empirically tested in the SLA field.
PREVIOUS NON-SLA RESEARCH
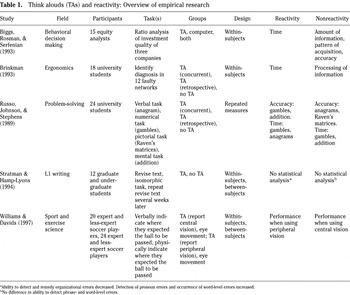
The validity of problem-solving tasks to elicit concurrent data (e.g., Leow, 1997a, 1998a, 1998b, 2000, 2001a; Rosa & Leow, in press a, in press b; Rosa & O'Neill, 1999) finds empirical support from studies in other scientific fields in which think-aloud protocols have served as a data-elicitation procedure. Ericsson and Simon (1993) reviewed a series of studies that address the issue of reactivity and found that, although participants completing verbal reports may take longer to complete a task, there is no evidence that their internal processes are altered. Three studies reviewed by Ericsson and Simon reported nonreactivity on learners' performances during problem-solving tasks, perhaps due to the nature of the task. In the field of ergonomics, Brinkman (1993) reported nonreactivity when students think aloud while solving fault-diagnosis problems. In speech and cognition research, Deffner (1984, 1989) found no evidence of reactivity for geometric puzzles or N-term series problems. Finally, in psychology, Rhenius and Heydemann (1984) reported nonreactivity for Raven's matrices. These non-SLA disciplines provide evidence that performance immediately after thinking aloud during a problem-solving task is not significantly different from that obtained after a silent version of the task. After an extensive search in the literature, only a few empirical studies directly addressing the issue of reactivity but not reviewed by Ericsson and Simon (1993) were found. The results of these studies, along with key studies reviewed by Ericsson and Simon (see Table 1), will be briefly summarized.
Think alouds (TAs) and reactivity: Overview of empirical research

In the field of memory and cognition, Russo, Johnson, and Stephens (1989) asked 24 university students to complete four tasks under three conditions: concurrent verbalization, retrospective verbalization, and no verbalization. The tasks included (a) a verbal task, anagrams; (b) a numerical task, simple gambles; (c) a pictorial task, Raven's matrices; and (d) a mental task, addition. Russo et al. compared the concurrent and silent conditions for reactivity. No reactivity for accuracy was found for anagrams or for Raven's matrices. Nor was extended time required when thinking aloud on addition and Raven's matrices. However, reactivity was found for accuracy on gambles and addition and for time on gambles and anagrams. These results need to be considered in light of the fact that participants did not perform these tasks only under the two conditions but also under a retrospective condition that prompted students to provide metalinguistic introspection. Because the conditions were randomly generated, participants who were asked for retrospection prior to the concurrent condition may have been more metalinguistic under the concurrent condition. As noted previously (Ericsson & Simon, 1993), introspective, metalinguistic verbalizations are not considered to be reliable. As such, these results may not truly reflect concurrent, nonmetalinguistic verbalizations. Taking into consideration the conflicting results, Russo et al. suggested that, when using verbal protocols, it may be wise to add a silent group to the research design to control for accuracy. Overall, they stated: “We believe that nothing can match the processing insights provided by a verbal protocol. Given the unique benefits, the challenge is to identify and reduce causes of their invalidity” (p. 767).
A study in the field of behavioral decision making (Biggs, Rosman, & Serfenian, 1993) examined the issue of reactivity by asking 15 equity analysts to provide a ratio analysis of the investment quality of three companies. The researchers predicted nonreactivity for their task on the basis of the cognitive theory of verbalization proposed by Ericsson and Simon (1984), which states that “the degree to which verbalizing interferes with the primary task should be negligible if verbalization is limited to items in short-term memory and the task does not require intermediate processing to translate nonverbal stimuli into a verbal form” (p. 190). Participants used computer-based information to rate three firms and were instructed to search for as much information as necessary to be able to make a rating. Biggs et al. found that adding concurrent, nonmetalinguistic verbalization to the task did not prove reactive, as it did not cause changes in the amount of information searched for, the pattern of acquisition of the information, or the accuracy of the final ratings, which were compared to industry-standard ratings. The only evidence of reactivity was the amount of time required to complete the task.
An important study reviewed by Ericsson and Simon (1993) was Brinkman (1993), in the field of ergonomics. In this study, 18 university students were asked to diagnose faults in graphically displayed networks consisting of rows and columns of interconnected logical and gate components for 12 problems. Brinkman carefully followed verbal-report procedures laid out by Ericsson and Simon, including providing participants with a warm-up period. Participants then attempted to diagnose faults under three conditions: (a) concurrent verbalization, (b) retrospective verbalization, and (c) no verbalization. For the concurrent verbalization condition, no evidence of reactivity for processing information was found. Results did, however, indicate reactivity for time. This study demonstrated the typical pattern found for concurrent, nonmetalinguistic verbal protocols.
Given that the studies reviewed thus far used fairly well defined tasks, Stratman and Hamp-Lyons (1994), in a pilot study, asked whether the same conclusions would hold for ill-defined tasks as are typical in L1 writing. Twelve graduate and undergraduate university students were asked to revise two faulty texts at different time periods separated by several weeks. Each participant revised one text while thinking aloud and the other text under a silent condition. Stratman and Hamp-Lyons were unable to carry out any statistical analyses of their results due to the small number of participants and tasks performed. They found no difference in participants' ability to detect phrase- and word-level errors. However, they suggested that the ability to detect and remedy organizational errors decreased and the detection of pronoun errors and the occurrence of word-level errors increased when participants thought aloud. Although these results may suggest that verbal protocols are not valid for some tasks, this study cannot be considered strong empirical evidence for this conclusion. Thus, further research is necessary before conclusions can be made regarding the use of verbal reports and L1 writing.
Williams and Davids (1997) conducted two experiments in sport and exercise science. One of their primary questions was whether verbalization while performing a task had any effect on performance. Twenty participants were divided into two groups of experienced and less experienced soccer players. Each participant then watched a video series of actual 11-versus-11 soccer simulations under two conditions. In the first condition the participants' attention was assessed by measuring their eye movements, and in the second condition the participants concurrently verbalized to which area of the screen they were paying attention. As a final task, participants indicated the anticipated destination of the final pass. Williams and Davids reported no difference in performance for either group across the two conditions and concluded that concurrent verbalization did not result in reactivity. In a second experiment, 24 experienced and less experienced soccer players watched 3-versus-3 soccer simulations under an eye-movement condition and a verbal-report condition. Again, participants indicated where they expected the ball to be passed. However, in this second experiment, under the verbal condition, participants were asked to report where they were extracting information from, not which area of the screen they were focusing on. This design was used because experienced players tend to rely more on their peripheral vision than less experienced players. Results from the second experiment indicated a difference between the two conditions. Williams and Davids proposed that the use of peripheral vision is often subconscious and that asking participants to consciously verbalize this subconscious information results in reactivity. Nonetheless, their results indicated that verbal reports were more veridical than eye-movement measures because the latter did not detect use of peripheral vision. They concluded that both methods are valid measures of selective attention for tasks dependent on the use of central vision (e.g., computer programming, machine operation, industrial inspection, and radiography) but that verbal reports are preferred for tasks requiring the extraction of information through peripheral vision (e.g., driving a car, flying, landing helicopters, and sports simulations).
Taken together, the results obtained by Biggs et al. (1993), Brinkman (1993), Russo et al. (1989), Stratman and Hamp-Lyons (1994), and Williams and Davids (1997) suggest that verbal reports, although extending time-on-task, do not result in altered internal processing. These studies provide further support for Ericsson and Simon's (1993) statement that in general, “thinking aloud does not lead to a reliable change in the cognitive process as reflected in accuracy of response” (p. xx). To be confident that this assumption of nonreactivity is applicable to tasks in SLA, direct empirical evidence is necessary.
The increasing need to address the internal validity of studies conducted within an attentional framework in SLA is clearly manifested in current research designs (e.g., discourse in Alanen, 1995; Leow, 2001b; Rott, 1999; problem-solving tasks in Leow, 1997a, 1998a, 1998b, 2000, 2001a; Rosa & O'Neill, 1999; stimulated recalls in Mackey, 1999; computer-based tasks in Rosa & Leow, in press a, in press b). These research designs have included some form of a concurrent data-elicitation procedure to measure whether attention was indeed paid to the L2 data. However, the critique of the possible reactivity of think-aloud protocols needs to be noted and empirically validated in the field of SLA. Due to the inherent limitations of introspective metalinguistic verbalization, the present study investigates only concurrent think-aloud protocols produced by learners instructed to verbalize their thoughts, without further request to comment or focus on any specific aspect of the L2 data. This study empirically investigates the effects of thinking aloud while reading an L2 text on learners' subsequent comprehension, intake, and controlled written production, guided by the following three research questions:
- Does thinking aloud while performing a reading task have any detrimental effect on adult readers' comprehension when compared to readers not thinking aloud?
- Does thinking aloud while performing a reading task have any detrimental effect on adult readers' intake when compared to readers not thinking aloud?
- Does thinking aloud while performing a reading task have any detrimental effect on adult readers' controlled written production when compared to readers not thinking aloud?
METHOD
Participants
Participants were adult college-level students enrolled in a first-year Spanish language program. At the time of the experiment, the targeted linguistic form (the Spanish impersonal imperative) had not been formally presented to participants, who already had approximately 52 hours of formal exposure to Spanish within an information-sharing curriculum that focused on all four skills (reading, listening, speaking, and writing). However, they had received formal exposure to the familiar imperative form in Spanish. The scores on the pretest (4 or fewer of 17 forms) and a debriefing questionnaire administered after exposure (whether they recognized or knew 4 or fewer of 17 forms) were used to include only participants who had minimal knowledge or ability to recognize and produce these forms in writing. Participants in the think-aloud group (the same reported in Leow, 2001b) were randomly assigned to an enhanced or an unenhanced group. Participants in the nonthink-aloud group were also randomly assigned to either an enhanced or unenhanced group but were not requested to think aloud during the reading process. There were 38 and 39 participants in the think-aloud group and nonthink-aloud groups, respectively.1
Of the original participants in the experimental group (n = 74), a total of 36 were excluded from the study (20 from the unenhanced group and 16 from the enhanced group). The final groups comprised 21 participants in the enhanced group and 17 participants in the unenhanced group. For the control group, 12 were excluded (original n = 51) for failing to attend all sessions or scoring above the cutoff point on the pretest.
Targeted Linguistic Form
The targeted linguistic form was the impersonal imperative in Spanish, as in Leow (1997b). The present study shared the same rationale for selection of this form—namely, contextual guessing of the imperatives was highly possible due to the type of experimental text and the fact that learners needed to pay attention to these forms to demonstrate comprehension of the content, as measured on the comprehension task.
Materials
The texts used in the present study were enhanced and unenhanced versions of the short text (384 words) used in Leow (1997b). The text in the previous study was a modified version of an article in the weekly Spanish magazine mía entitled “Consejos útiles para llevar una vida saludable” (“Useful advice to lead a healthy life”). The text contained 17 targeted forms (see Appendix A).
Assessment Tasks
To measure participants' comprehension, an 11-item comprehension task was designed to elicit 17 pieces of information based exclusively on the advice, tips, or recommendations provided through the imperatives found in the text. The information was elicited predominantly via short and multiple-choice answers. All the items were presented in the participants' native language (English), which was also used, for the most part, in the answers (see Appendix B).
To measure participants' intake of the targeted forms, a multiple-choice recognition task was prepared.2
As in Leow (1993, pp. 337–338), intake was defined as stored linguistic data that has been attended to by the L2 learner and may be used for immediate recognition. Therefore, intake was operationalized in this study as the participants' ability to indicate recognition of the targeted form on a multiple-choice task with the correct form and three distractors.
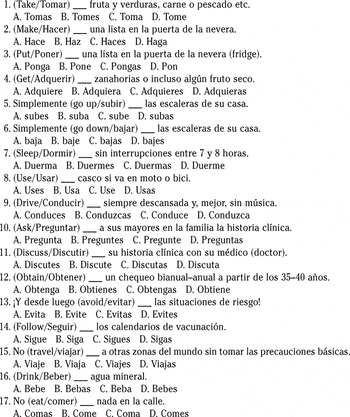
To measure participants' controlled written production of the targeted forms, a fill-in-the-blank task, comprising 17 items that provided a list of advice for leading a healthy life, was prepared. Like the recognition task, both the infinitive and English equivalent of the targeted verbs were provided. Participants wrote the appropriate Spanish form of the verb that formally provided the tip, piece of advice, or recommendation (see Appendix D).
Testing Procedure
The pretest consisted of the recognition and controlled written production tasks and was administered 3 weeks before participants were exposed to the experimental input. Additionally, 2 days before exposure to the experimental input, participants received a take-home worksheet composed of two vocabulary-matching tasks designed to reduce the processing load of content words. On the first task, participants had to match the English equivalents of the infinitives of important verbs in the text with their Spanish equivalents from a list of verbs presented on the take-home test. On the second task, participants had to match the Spanish description of important words in the text with the appropriate English equivalents from the list. For both tasks, participants wrote the answer next to the item. Ninety-five percent of the worksheets were returned and correctly completed (see Appendix E).
On the day of the experimental exposure, the worksheets were submitted. Participants in the think-aloud group reported to the language laboratory, whereas those in the control group remained in their classrooms. They were then randomly assigned a packet of material presented in the following order: (a) a participation agreement sheet, (b) instructions, (c) either the enhanced or unenhanced text, (d) the comprehension task, (e) the controlled written production task, and finally (f) the recognition task. The controlled written production task was administered before the recognition task to avoid providing additional input to participants. In the instructions, all participants were informed that they were going to read an article entitled “Consejos útiles para llevar una vida saludable” (“Useful advice to lead a healthy life”) at their own pace. For the think-aloud group, participants were informed to put on headphones and to clearly speak their thoughts aloud throughout the entire experiment—that is, while they read the article and completed the subsequent tasks.3
No formal training of the think-aloud procedure was deemed necessary for these participants, who had participated in a previous study employing a similar concurrent data-elicitation procedure. Also note that, because participants in the think-aloud group were instructed to think aloud during the treatment and the assessment tasks, the lack of significant differences does not indicate that think alouds do not affect the results of assessment tasks taken under equivalent conditions; rather, it shows that think alouds do not have an impact on the overall behavioral product obtained from our sample.
Given that the focus of the study was methodological and not process-oriented, no quantitative or qualitative analyses of the think-aloud protocols are reported. For a process-oriented report of these data, see Leow (2001b).
Scoring Procedure
For the recognition and controlled written production tasks, one point was awarded to each correct answer, and no points for incorrect answers, for a total of 17 points. The comprehension task was scored in the following manner: For all items except item 1, one point was awarded for each correct answer, and zero for an incorrect one. For item 1, five out of seven correct responses were required before one point was awarded. For item 11, answers could have been provided in either English or Spanish.
RESULTS
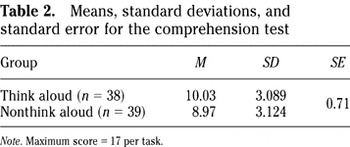
The data were submitted to the Statistical Package for the Social Sciences (SPSS) with the alpha level set at .05. To address research question 1—namely, the impact of reactivity on learners' comprehension—the mean scores (10.03 [+think aloud] vs. 8.97 [–think aloud]) of correct answers on the comprehension task were submitted to a parametric t-test.5
A parametric t-test was appropriate for the comprehension test given that the scores on this test were normally distributed (the Anderson-Darling statistic was .35, p = .25).
Means, standard deviations, and standard error for the comprehension test

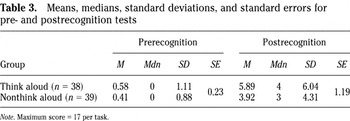
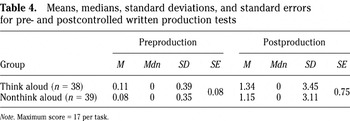
To answer research questions 2 and 3, which address the impact of reactivity on learners' intake and controlled written production, median scores on the recognition and controlled written production pretests and posttests (see Tables 3 and 4 for descriptive statistics) were submitted to nonparametric t-tests (Mann Whitney U).6
Nonparametric t-tests were appropriate for the recognition and written production pretests and posttests because of the absence of a normal distribution of scores obtained on these tests. The Anderson-Darling statistics were 15.35, p < .005, and 25.95, p < .01, for the recognition and written production pretests, respectively; for the recognition and written production posttests, the Anderson-Darling statistics were 4.66, p < .01, and 16.10, p < .01, respectively.
Means, medians, standard deviations, and standard errors for pre- and postrecognition tests

Means, medians, standard deviations, and standard errors for pre- and postcontrolled written production tests

The Cronbach coefficient alpha test performed on the posttest scores obtained on the three tasks revealed the following reliability index for each task: a high reliability index for both the recognition (.93) and controlled written production (.93) tasks and a relatively low reliability index for the comprehension task (.61).
To address any potential impact of [±enhancement], additional post hoc analyses were performed on the data.7
For further information on the effects of written or textual input enhancement in L2 reading, see Leow (2001b).
In summary, thinking aloud while performing a reading task does not seem to have detrimental effects on learners' comprehension, intake, or controlled written production when compared to a nonthink-aloud group performing the same task.
DISCUSSION
The first research question—does thinking aloud while performing a reading task have any detrimental effect on adult readers' comprehension when compared to readers not thinking aloud—was answered negatively by the findings of the study. One plausible explanation for the nonsignificant difference in learners' comprehension between the think-aloud and nonthink-aloud groups comes from the data from the think-aloud protocols. As reported by Leow (2001b), the think-aloud protocols revealed that translation was the preferred reading strategy for many learners. Assuming this to also be the dominant strategy employed by the nonthink-aloud group, it may be argued that the process of translation from the L2 to the L1, silently or aloud, may not differ much in terms of required cognitive effort, thereby reducing the potential for reactivity to be an issue. However, because of the relatively low reliability index found for the comprehension task, caution is recommended in interpreting the data.
The second and third research questions, which sought to address whether thinking aloud while performing a reading task had any detrimental effect on adult readers' intake and controlled written production, were also answered negatively. In other words, reactivity was not an issue in learners' subsequent ability to recognize and produce in controlled writing targeted forms in the input. These findings in SLA discourse provide further support to those found in other fields of science—for example, psychology (Rhenius & Heydemann, 1984), speech and cognition (Deffner, 1984), and ergonomics (Brinkman, 1993)—as well as the overall conclusions made by Ericsson and Simon (1993) that verbal reports do not result in altered internal processing during problem-solving tasks.
Limitations of the Study and Future Research
Although the present study appears to provide empirical support for studies employing concurrent data-elicitation procedures, such as think-aloud protocols used to address the internal validity issue of much SLA research conducted within an attentional framework, the results cannot be extended to other types of linguistic items. The targeted items in the study were morphological in nature, which could have played a role in terms of their saliency or meaning-bearing potential. Likewise, given that the participants of the study were first-semester learners with relatively low prior knowledge of the targeted items in the input and appeared to have predominantly employed a translation strategy while reading, no extrapolation is being made to other levels of language experience. In other words, it remains to be empirically explored whether the issue of reactivity is affected by prior knowledge of targeted items or different reading strategies, which are most likely to be obtained at higher levels of language experience.
The length of text and its potential impact on reactivity also warrants future investigation. Leow (1997b) compared the comprehension of learners exposed to two different text lengths (384 vs. 631 words) and found text length to be a significant factor in their subsequent comprehension of the content matter in the input. Somewhat related to text length—or more specifically, longer exposure to the L2—is the role of multiple exposures. Would learners exposed to L2 information more than once and given additional time to process L2 information more deeply shed light on the issue of reactivity in SLA? For example, given that, during the early stages of L2 learning, most learners appear to rely on the strategy of translation while reading an L2 passage for the first time, would this strategy change with a second reading and subsequently increase the potential for reactivity, as argued? Whether length of text or multiple exposures play a role in reactivity in SLA processing while thinking aloud remains to be empirically investigated.
A logical extension of the present study and clearly fruitful research area relates to retrospective verbal reports, used for tasks when concurrent think alouds are not possible. The relevant investigation is that of veridicality—that is, whether retrospective protocols accurately reflect cognitive processes employed while interacting with L2 data. Veridicality concerns studies conducted within an interactional framework that employ, for example, stimulated recall procedures in an effort to document learners' processes while engaged in a previous L2 interaction with another person (Gass & Mackey, 2000). As Leow (2002) pointed out, memory decay or double-input exposure are variables that need empirical investigation.
Although the current study has focused on reactivity, an issue related to methodological validity, future researchers might also want to empirically address the reliability of verbal reports in SLA research methodology. Studies that have employed concurrent data-elicitation procedures (think-aloud protocols) to investigate levels of awareness (e.g., Leow, 1997a, 2000, 2001a, 2001b; Rosa & Leow, in press a, in press b; Rosa & O'Neill, 1999) have revealed protocols depicting similar characteristics pertaining to different levels of awareness. For example, protocols coded as demonstrating awareness at the level of understanding all report instances of hypothesis testing and rule formation. However, these reports are cross-sectional and therefore do not provide robust evidence to determine whether verbal reports obtained from the same individuals at different times are indeed reliable.
CONCLUSION
The study was designed to address the important issue of reactivity in SLA research methodology with regard to the validity of concurrent data-elicitation procedures such as nonmetalinguistic think-aloud protocols, recently employed by several studies in an attentional framework. To determine the effects of thinking aloud while completing an L2 reading task, the comprehension, intake, and controlled written production median scores of two groups (think aloud vs. nonthink aloud) of college-level students were statistically compared after the completion of the reading task. The results of the study revealed the following: For this sample of participants (adult first-semester students of Spanish), thinking aloud while performing an L2 reading task of 384 words did not appear to have detrimental or facilitative effects on comprehension, intake, or controlled written production when compared to a nonthink-aloud group performing the same task. In other words, thinking aloud was nonreactive in this study, and these results provide empirical support for the validity of the use of such procedures to gather concurrent data on learners' cognitive processes. We suggest that the predominant reading strategy revealed in the think-aloud protocols could account for a nonsignificant difference in the amount of cognitive effort required for either reading aloud or silently, thereby reducing the potential for reactivity to play a role. For studies in SLA that employ concurrent data-elicitation procedures such as think-aloud protocols to operationalize and measure the constructs of attention and awareness, the questions of reactivity and veridicality are clearly fruitful areas of investigation in SLA research methodology. Such empirical evidence would certainly improve the internal validity of relevant studies. Finally, given the many variables that potentially impact the issue of reactivity in SLA research methodology, it is suggested that studies employing concurrent data-elicitation procedures include a control group that does not perform verbal reports as one way of addressing this issue.
APPENDIX A: ENHANCED WRITTEN TEXT
Please read the following article that provides useful advice and recommendations on how to lead a healthy life. As you read the article, THINK ALOUD your thoughts as naturally as you can. Also, CIRCLE ANY UNKNOWN VERB FORM(S) you come across as you read. When you are finished, please turn the page and complete the following tasks. You can now turn on the recorder.
Medicina Preventiva
Consejos útiles para llevar una vida saludable.
Primero, tiene que comer bien. Cada día tome fruta y verduras, carne o pescado, dos o tres huevos por semana, leche o queso a diario…. Haga y ponga una lista en la puerta de la nevera. Y de vez en cuando, adquiera zanahorias o incluso algún fruto seco mejor que bollos o pan.
El ejercicio físico es también imprescindible. No tiene que convertirse en una gran atleta; simplemente suba y baje las escaleras de su casa.
Sabe perfectamente cuáles son los hábitos que son peligrosos, pero otros no son tan obvios. Por ejemplo, si es necesario trabajar hasta altas horas de la noche o salir con los amigos por la noche, duerma sin interrupciones entre 7 y 8 horas para que su organismo pueda recuperarse. Otros hábitos importantes tienen que ver con su seguridad: use casco si va en moto o bici y conduzca siempre descansada y, mejor, sin música.
Puede evitar muchas enfermedades. En ocasiones, existen en las familias antecedentes de enfermedades a las que usted puede tener propensión. Pregunte a sus mayores en la familia la historia clínica y discuta esta historia con su médico de cabecera. En cualquier caso, obtenga un chequeo bianual–anual a partir de los 35–40 años.
¡Y desde luego evite las situaciones de riesgo! Siga los calendarios de vacunación; no viaje a otras zonas del mundo sin tomar las precauciones básicas: vacunación si es necesaria, beba agua mineral, no coma nada en la calle. C.G.
N.B. Because of publishing constraints, the original bolded imperative endings employed in the study are represented here by italicized endings.
APPENDIX B: COMPREHENSION TASK
Now see if you can answer the following questions based on the article “Consejos para llevar una vida saludable.” Answer in English wherever appropriate.

APPENDIX C: MULTIPLE-CHOICE RECOGNITION TASK
Here is a list of tips or advice for a healthy life from a stranger. For each sentence, circle the letter which you recognize from the article as formally providing the tip, piece of advice, or recommendation in Spanish. Please do NOT skip a number and then return to it.
DON'T FORGET TO KEEP THINKING ALOUD!!
APPENDIX D: FILL-IN-THE-BLANK CONTROLLED WRITTEN PRODUCTION TASK
Here is a list of tips or advice for a healthy life you would like to give to a stranger. For each sentence, write the appropriate form of the verb that formally provides the tip, piece of advice, or recommendation in Spanish.
DON'T FORGET TO KEEP THINKING ALOUD!!

APPENDIX E: WORKSHEET

References
REFERENCES
Alanen, R.
(1995).
Input enhancement and rule presentation in second language
acquisition. In
R. Schmidt (Ed.),
Attention and awareness in foreign language learning (pp.
259–302).
Honolulu:
University of Hawai‘i Press.
Biggs, S. F.,
Rosman, A. J., &
Serfenian, G. K.
(1993)
Methodological issues in judgment and decision-making research:
Concurrent verbal protocol validity and simultaneous traces of process
data.
Journal of Behavioral Decision Making,
9,
234–248.Google Scholar
Brinkman, J. A.
(1993)
Verbal protocol accuracy in fault diagnosis.
Ergonomics,
36,
1381–1397.Google Scholar
Carrell, P. L.
(1989)
Metacognitive awareness and second language reading.
Modern Language Journal,
73,
121–134.Google Scholar
Cohen, A.
(1986)
Mentalistic measures in reading strategy research: Some recent
findings.
English for Specific Purposes,
5,
131–145.Google Scholar
Cohen, A.
(2000).
Exploring strategies in test taking: Fine-tuning verbal reports
from respondents. In
G. Ekbatani &
H. Pierson (Eds.),
Learner-directed assessment in ESL (pp.
127–150).
Mahwah, NJ:
Erlbaum.
Davis, J., &
Bistodeau, L.
(1993)
How do L1 and L2 reading differ? Evidence from think aloud
protocols.
Modern Language Journal,
77,
459–472.Google Scholar
Deffner, G.
(1984).
Think aloud: An investigation of the validity of a data-collection
procedure.
Bern:
Peter Lang.
Deffner, G.
(1989)
Interaction of thinking aloud, solution strategies, and task
characteristics? An experimental test of the Ericsson and Simon
model.
Sprache und Kognition,
9,
98–111.Google Scholar
Ericsson, K., &
Simon, H.
(1984).
Protocol analysis: Verbal reports as data.
Cambridge, MA:
MIT Press.
Ericsson, K., &
Simon, H.
(1993).
Protocol analysis: Verbal reports as data
(Rev. ed.).
Cambridge, MA:
MIT Press.
Faerch, C., &
Kasper, G.
(1987).
From product to process: Introspective methods in second language
research. In
C. Faerch &
G. Kasper (Eds.),
Introspection in second language research (pp.
5–23).
Clevedon, UK:
Multilingual Matters.
Gass, S., &
Mackey, A.
(2000).
Stimulated recall methodology in second language research.
Mahwah, NJ:
Erlbaum.
Jourdenais, R.
(1998).
The effects of textual enhancement on the acquisition of the
Spanish preterit and imperfect.
Unpublished doctoral dissertation,
Georgetown University,
Washington, DC.
Jourdenais, R.
(2001).
Protocol analysis and SLA. In
P. Robinson (Ed.),
Cognition and second language acquisition (pp.
354–375).
New York:
Cambridge University Press.
Leow, R. P.
(1993)
To simplify or not to simplify: A look at intake.
Studies in Second Language Acquisition,
15,
333–355.Google Scholar
Leow, R. P.
(1997a)
Attention, awareness, and foreign language behavior.
Language Learning,
47,
467–506.Google Scholar
Leow, R. P.
(1997b)
The effects of input enhancement and text length on adult L2
readers' comprehension and intake in second language
acquisition.
Applied Language Learning,
8,
151–182.Google Scholar
Leow, R. P.
(1998a)
The effects of amount and type of exposure on adult learners'
L2 development.
Modern Language Journal,
82,
49–68.Google Scholar
Leow, R. P.
(1998b)
Toward operationalizing the process of attention in SLA: Evidence
for Tomlin and Villa's (1994) fine-grained analysis of
attention.
Applied Psycholinguistics,
19,
133–159.Google Scholar
Leow, R. P.
(1999).
The role of attention in second/foreign language classroom
research: Methodological issues. In
F. Martínez-Gil &
J. Gutiérrez-Rexach (Eds.),
Advances in Hispanic linguistics: Papers from the 2nd Hispanic
Linguistics Symposium (pp.
60–71).
Somerville, MA:
Cascadilla Press.
Leow, R. P.
(2000)
A study of the role of awareness in foreign language behavior:
Aware versus unaware learners.
Studies in Second Language Acquisition,
22,
557–584.Google Scholar
Leow, R. P.
(2001a)
Attention, awareness, and foreign language behavior.
Language Learning,
51,
113–155.Google Scholar
Leow, R. P.
(2001b)
Do learners notice enhanced forms while interacting with the L2? An
online and offline study of the role of written input enhancement in L2
reading.
Hispania,
84,
496–509.Google Scholar
Leow, R. P.
(2002)
Models, attention, and awareness in SLA: A response to Simard and
Wong's (2001) “Alertness, orientation, and detection: The
conceptualization of attentional functions.”
Studies in Second Language Acquisition,
24,
113–119.Google Scholar
Lyons, W.
(1986).
The disappearance of introspection.
Cambridge, MA:
MIT Press.
Mackey, A.
(1999)
Input, interaction, and second language development.
Studies in Second Language Acquisition,
21,
557–587.Google Scholar
Nevo, N.
(1989)
Test-taking strategies on a multiple-choice test of reading
comprehension.
Language Testing,
6,
199–215.Google Scholar
Nisbett, R. E., &
Wilson, T. D.
(1977)
Telling more than we can know: Verbal reports on mental processes.
Psychological Review,
84,
231–259.Google Scholar
Norris, S.
(1992)
A demonstration of the use of verbal reports of thinking in
multiple-choice critical thinking test design.
The Alberta Journal of Educational Research,
38,
155–176.Google Scholar
Olson, G.,
Duffy, S. A., &
Mack, R. L.
(1984).
Thinking-out-loud as a method for studying real-time comprehension
processes. In
D. E. Kieras &
M. A. Just (Eds.),
New methods in reading comprehension research (pp.
253–286).
Mahwah, NJ:
Erlbaum.
Pressley, M., &
Afflerbach, P.
(1995).
Verbal protocols of reading: The nature of constructively
responsive reading.
Mahwah, NJ:
Erlbaum.
Pritchard, R.
(1990)
The effects of cultural schemata on reading processing strategies.
Reading Research Quarterly,
25,
273–295.Google Scholar
Rhenius, D., &
Heydemann, M.
(1984)
Think aloud during the administration of Raven's matrices.
Zeitschrift für experimentelle und angewandte Psycholgie,
31,
308–327.Google Scholar
Rosa, E. M., &
Leow, R. P.
(in press a).
Awareness, different learning conditions, and L2 development.
Applied Psycholinguistics,
25.
Rosa, E. M., &
Leow, R. P.
(in press b).
Computerized task-based exposure, explicitness, and type of feedback on
Spanish L2 development.
Modern Language Journal,
88.
Rosa, E. M., &
O'Neill, M.
(1999)
Explicitness, intake, and the issue of awareness: Another piece to
the puzzle.
Studies in Second Language Acquisition,
21,
511–556.Google Scholar
Rott, S.
(1999).
Relationships between the process of reading, word inferencing,
and incidental vocabulary acquisition. In
J. F. Lee &
A. Valdman (Eds.),
Form and meaning: Multiple perspectives (pp.
255–282).
Boston:
Heinle & Heinle.
Russo, L. E.,
Johnson, E. J., &
Stephens, D.
(1989)
The validity of verbal protocols.
Memory and Cognition,
17,
759–769.Google Scholar
Seliger, H. W.
(1983)
The language learner as linguist: Of metaphors and realities.
Applied Linguistics,
4,
179–191.Google Scholar
Stratman, J. F., &
Hamp-Lyons, L.
(1994).
Reactivity in concurrent think-aloud protocols. In
P. Smagorinsky (Ed.),
Speaking about writing: Reflections on research methodology (pp.
89–112).
London:
Sage.
Wade, S. E.
(1990)
Using think alouds to assess comprehension.
The Reading Teacher,
43,
442–451.Google Scholar
Williams, A. M., &
Davids, K.
(1997)
Assessing cue usage in performance contexts: A comparison between
eye-movement and concurrent verbal report methods.
Behavior Research Method, Instruments, and Computers,
29,
364–375.Google Scholar
Think alouds (TAs) and reactivity: Overview of empirical research
Means, standard deviations, and standard error for the comprehension test
Means, medians, standard deviations, and standard errors for pre- and postrecognition tests
Means, medians, standard deviations, and standard errors for pre- and postcontrolled written production tests
 You have
Access
- 9
- Cited by