


1. Introduction
Polynyas are persistent and recurrent areas of open water and/or thin ice that occur at locations within Sea-ice zones where a more consolidated and thicker ice cover would be climatologically expected (Reference smith, Muench and PeaseSmith and others, 1990; Reference Martin, Steele, Turekian and ThorpeMartin, 2002). most antarctic coastal polynyas are latent-heat features, which are formed by divergent ice motion due to prevailing winds and/or oceanic currents (Reference Morales Maqueda, Willmott and BiggsMorales maqueda and others, 2004). in reality, the open-water fraction present is typically Small in winter (extending a few kilometres offshore; Reference PeasePease, 1987) compared to the overall polynya ‘régime’ (Reference Arrigo and van DijkenArrigo and van dijken, 2003). the latter also includes ice newly formed within the polynya, and can extend up to and beyond 100 km from the coast. moreover, intermittent temporary cessations of Strong winds can lead to ephemeral freezing-over of polynyas under calm cold conditions (Reference Massom, Hill, Lytle, Worby, Paget and AllisonMassom and others, 2001). thus, most of the area is covered with thin ice. in winter, heat loss over the thin-ice region is very large. as most of the heat loss is balanced by Sea-ice production, antarctic coastal polynyas are often Sites of high Sea-ice production (Reference Gordon and ComisoGordon and comiso, 1988). given the Sensitivity of ocean–atmosphere heat loss to Sea-ice thickness (Reference Maykut and UntersteinerMaykut, 1986), more accurate measurement of the distribution and thickness of thin Sea ice within polynyas is a high priority.
The most effective, and indeed only practical, means of measuring thin Sea-ice distribution on the large Scale is Satellite remote Sensing. to date, most work has occurred in the arctic. Reference Yu and RothrockYu and rothrock (1996) developed a method of Sea-ice thickness estimation based upon input of data from the advanced very high resolution radiometer (avhrr) on board the us national oceanic and atmospheric administration (noaa) Series of polar-orbiting Satellites (Reference CracknellCracknell, 1997) to the heat-flux calculation. they compared ice thicknesses obtained from avhrr data with those from moored upward-looking Sonar (uls) in the beaufort and greenland Seas. the uncertainty of their estimation was ∽3% for thicknesses of <0.2m and ∽9% for thicknesses approximating 1m. Reference Drucker, Martin and MoritzDrucker and others (2003) applied a Similar method of thickness estimation in the St lawrence island polynya in the bering Sea. their comparison of avhrr-derived ice thicknesses with coincident uls thickness data Showed an agreement within the observational uncertainty for thicknesses of less than ∽0.5 m.
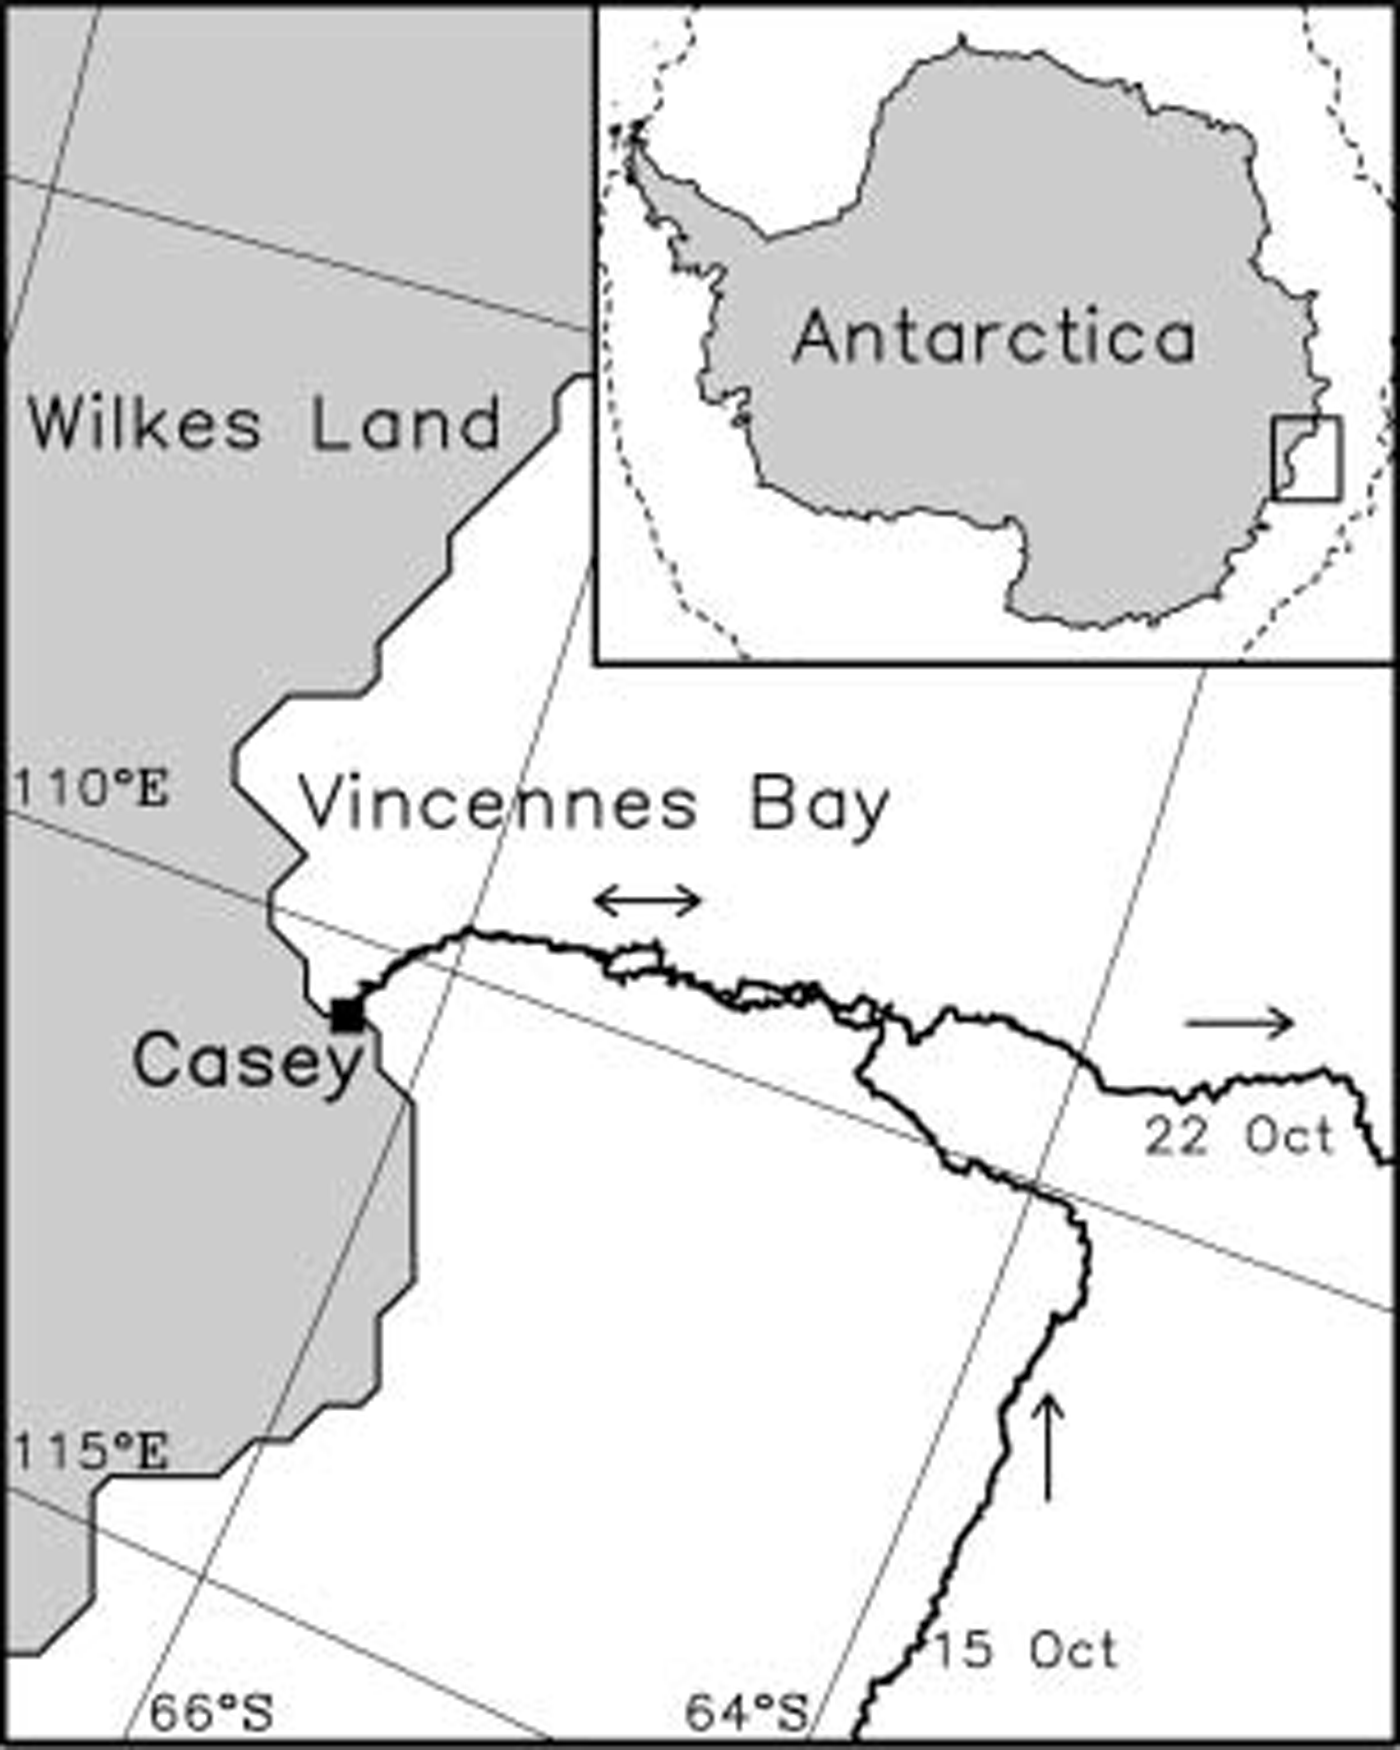
In this Study, we apply the heat-flux calculation approach to estimating Sea-ice thickness from cloud-free avhrr data in the vincennes bay polynya (naming is based upon Reference Massom, Harris, Michael and PotterMassom and others, 1998) in the vicinity of casey base, east antarctica. results are then compared with coincident in Situ observations obtained during the australian-led antarctic remote ice Sensing experiment (arise) on board the R/v Aurora Australis in September–october 2003 (see Reference MassomMassom and others, 2006). the cruise track is given in figure 1. the goal of this Study is to examine the validity of the method of Sea-ice thickness estimation from avhrr when applied to the antarctic ocean, and to provide a first estimate of thin Sea-ice thickness and its distribution in this important polynya. a comparison is also made with coincident Satellite passive-microwave polarization ratio data.
Map of the Vincennes Bay region of East Antarctica Showing the cruise track of the R/V Aurora Australis during the 2003 ARIsE experiment. The Study region is demarcated by the box in the inset map of Antarctica. The dashed line in the inset denotes the location of the Sea-ice edge, derived from Special Sensor Microwave/Imager (SSM/I/I) ice-concentration data on 19 October 2003, at the time of the experiment.
2. Data and Methods
Avhrr data of noaa 12, 15 and 16 were acquired by the Seaspace terascan System on board the Ship. cloud-free Scenes were used in this analysis, their Selection being based upon visual inspection of avhrr channel 4 (10.3–11.3 μm) imagery. this also enabled detection of ice fog and water vapour, which can Significantly bias ice-surface temperature retrievals using Satellite thermal infrared data (Reference Martin, Drucker, Kwok and HoltMartin and others, 2004). in Situ measurements of ice-surface (skin) temperature were obtained along the cruise track from a downward-looking radiation thermometer (8.0–12.0 μm) fixed to the bow of the vessel. the thermometer was attached in a manner Such that it Sensed Sea ice undisturbed by the Ship’s hull, and acquired measurements every minute from 25 September to 23 october 2003. meteorological data obtained by the Ship’s data-logging System (i.e. air temperatures, dew-point temperatures, winds, atmospheric pressure and cloud cover) are also used in the heat-flux calculation. these data were averaged over 8 hours, for reasons that will become apparent later. estimates of Sea-ice thickness for comparison with the Satellite estimates come from a downward-looking video camera installed on the Ship’s Side. this monitored ice turned onto its Side by the Ship, enabling manual estimation of ice thickness (Reference Toyota, Ukita, Ohshima, Wakatsuchi and MuramotoToyota and others, 1999) and the along-track occurrence of thin Sea ice and open water as the Ship traversed the polynya en route to and from casey base (66.28˚ S, 110.53˚ e). the reading error is considered to be <10% at most (Reference Toyota, Kawamura, Ohshima, Shimoda and M. Waka-tsuchiToyota and others, 2004). in addition, we use ice-thickness data from hourly observations from the Ship’s bridge using the Standard protocol described by Reference Worby and AllisonzWorby and allison (1999). the uncertainty of this ice-thickness estimate is considered to be 0.1 m at most for Sea ice with a thickness of <0.5 m.
Ice thickness is estimated from avhrr data using the technique outlined by yu and rothrock (1996) and Reference Drucker, Martin and MoritzDrucker and others (2003). this algorithm is applicable to Sea ice with thicknesses of <0.5 m. the heat-flux calculation in this method is based upon the following three assumptions. first, the heat exchange between Sea ice and atmosphere is immediate. Second, the water temperature under Sea ice is constant at the freezing-point temperature (271.29 k). third, the vertical temperature profile through Sea ice is linear. a further assumption is of a uniform ice thickness in each gridcell. because this thickness is not Simply an arithmetical average, it is termed the AVHRR ice thickness here. the Spatial resolution of avhrr is ∽1.25 km, with coverage over a wide Swath (>2000 km).
In what follows, we describe the procedure for calculating the avhrr ice thickness Specifically. the heat-flux calculation is modified to follow Reference Nihashi and OhshimaNihashi and ohshima (2001). the intensity of net longwave radiation is calculated from Reference König-Langlo and AugsteinKönig-langlo and augstein’s (1994) empirical formula. the turbulent heat flux is calculated from the bulk formula, using the bulk transfer coefficients proposed by Reference KondoKondo (1975), which incorporate the effect of Stability of the atmospheric Surface layer. ice-surface temperature data are calculated from avhrr channel 4 and 5 (11.5–12.5 μm) data using Reference Key, Collins, Fowler and StoneKey and others’ (1997) empirical equation. the use of this Split-window approach removes water-vapour effects to minimize their impact. estimates of Surface atmospheric variables used in the heat-flux calculation, i.e. air temperatures at 2 m, dew point temperatures at 2 m, winds at 10 m, and mean Sea-level pressure data, are derived from the european centre for medium-range weather forecasts (ecmwf; Spatial resolution 2.5˚×2.5˚) dataset. we choose night-only cases to minimize the ambiguity associated with the absorption of Shortwave radiation into the ice volume (Reference Grenfell and MaykutGrenfell and maykut, 1977), i.e. heat flux is calculated without a Shortwave radiation component.
We estimate the avhrr ice thickness from the Sea-ice internal conductive heat flux calculated from the residual of the Sum of net longwave radiation and turbulent heat flux, where the conductivity of Sea ice is assumed to be 2.03wm–1k–1 (Reference MaykutMaykut, 1985). Snow cover is neglected here, based upon the visual observation of a lack of Snow on thin ice. using a Similar method, we estimate ice thickness using the Sea-ice Surface temperature obtained from the radiation thermometer and meteorological data on board the vessel. we term this thickness the thermometer ice thickness.
Meteorological data are averaged over the 8 hours leading up to each ice-thickness estimate to minimize the effects of thermal inertia. the thermal inertia component accounts for only ∽7% of the net heat flux when the air temperature is assumed to change by 2 k in 8 hours (a typical change) for thin ice with a thickness of 0.1 m under typical meteorological conditions, i.e. where air temperature is 258 k and net heat flux is –170wm–2. when the heat exchange is averaged over this 8 hour period, the thermal inertia is considered to be negligible as a zeroth approximation.
The contribution of Shortwave radiation is also considered to be negligible. under the assumption that all Shortwave radiation apart from that reflected is absorbed by the Sea-ice Surface, we calculate Shortwave radiation incident on the ice Surface averaged over 8 hours before the estimation time, in accordance with the other flux calculations. this Shows that the percentage of the Shortwave radiation to the net heat flux is <3% when making the ice-thickness calculation during the period 0200–0600 h (local time).
Finally, we apply the avhrr ice-thickness data to an asseSSM/Ient of Satellite passive-microwave remote Sensing as a means of gaining wider estimates of thin Sea-ice distribution, as reported from the arctic by Reference CavalieriCavalieri (1994) and Reference Martin, Drucker, Kwok and HoltMartin and others (2004). the advantage of Satellite passive-microwave data compared to visible/thermal-infrared data is that complete coverage of the Southern ocean can be obtained on a daily basis unaffected by cloud cover and darkness. moreover, the multi-frequency dataset extends back to 1978. according to the arctic Studies, the polarization ratio (pr) of passive microwave brightness temperature (T B) data, (T Bv–T Bh)/(T Bv+T Bh), at a given frequency decreases as Sea-ice thickness increases from new/young ice (<0.3m thick) to first-year ice (>0.3m thick), where ‘v’ and ‘h’ are vertical and horizontal polarization respectively. in this Study, we use twice-daily (ascending and descending orbit) us defense meteorological Satellite program (dmsp) Special Sensor microwave/imager (SSM/I/I) T B data from the 37 and 85 ghz channels (mapped Spatial resolution ∽12.5 and 25km respectively) in the equal-area Scalable earth grid (ease-grid) projection.
3. Results and Discussion
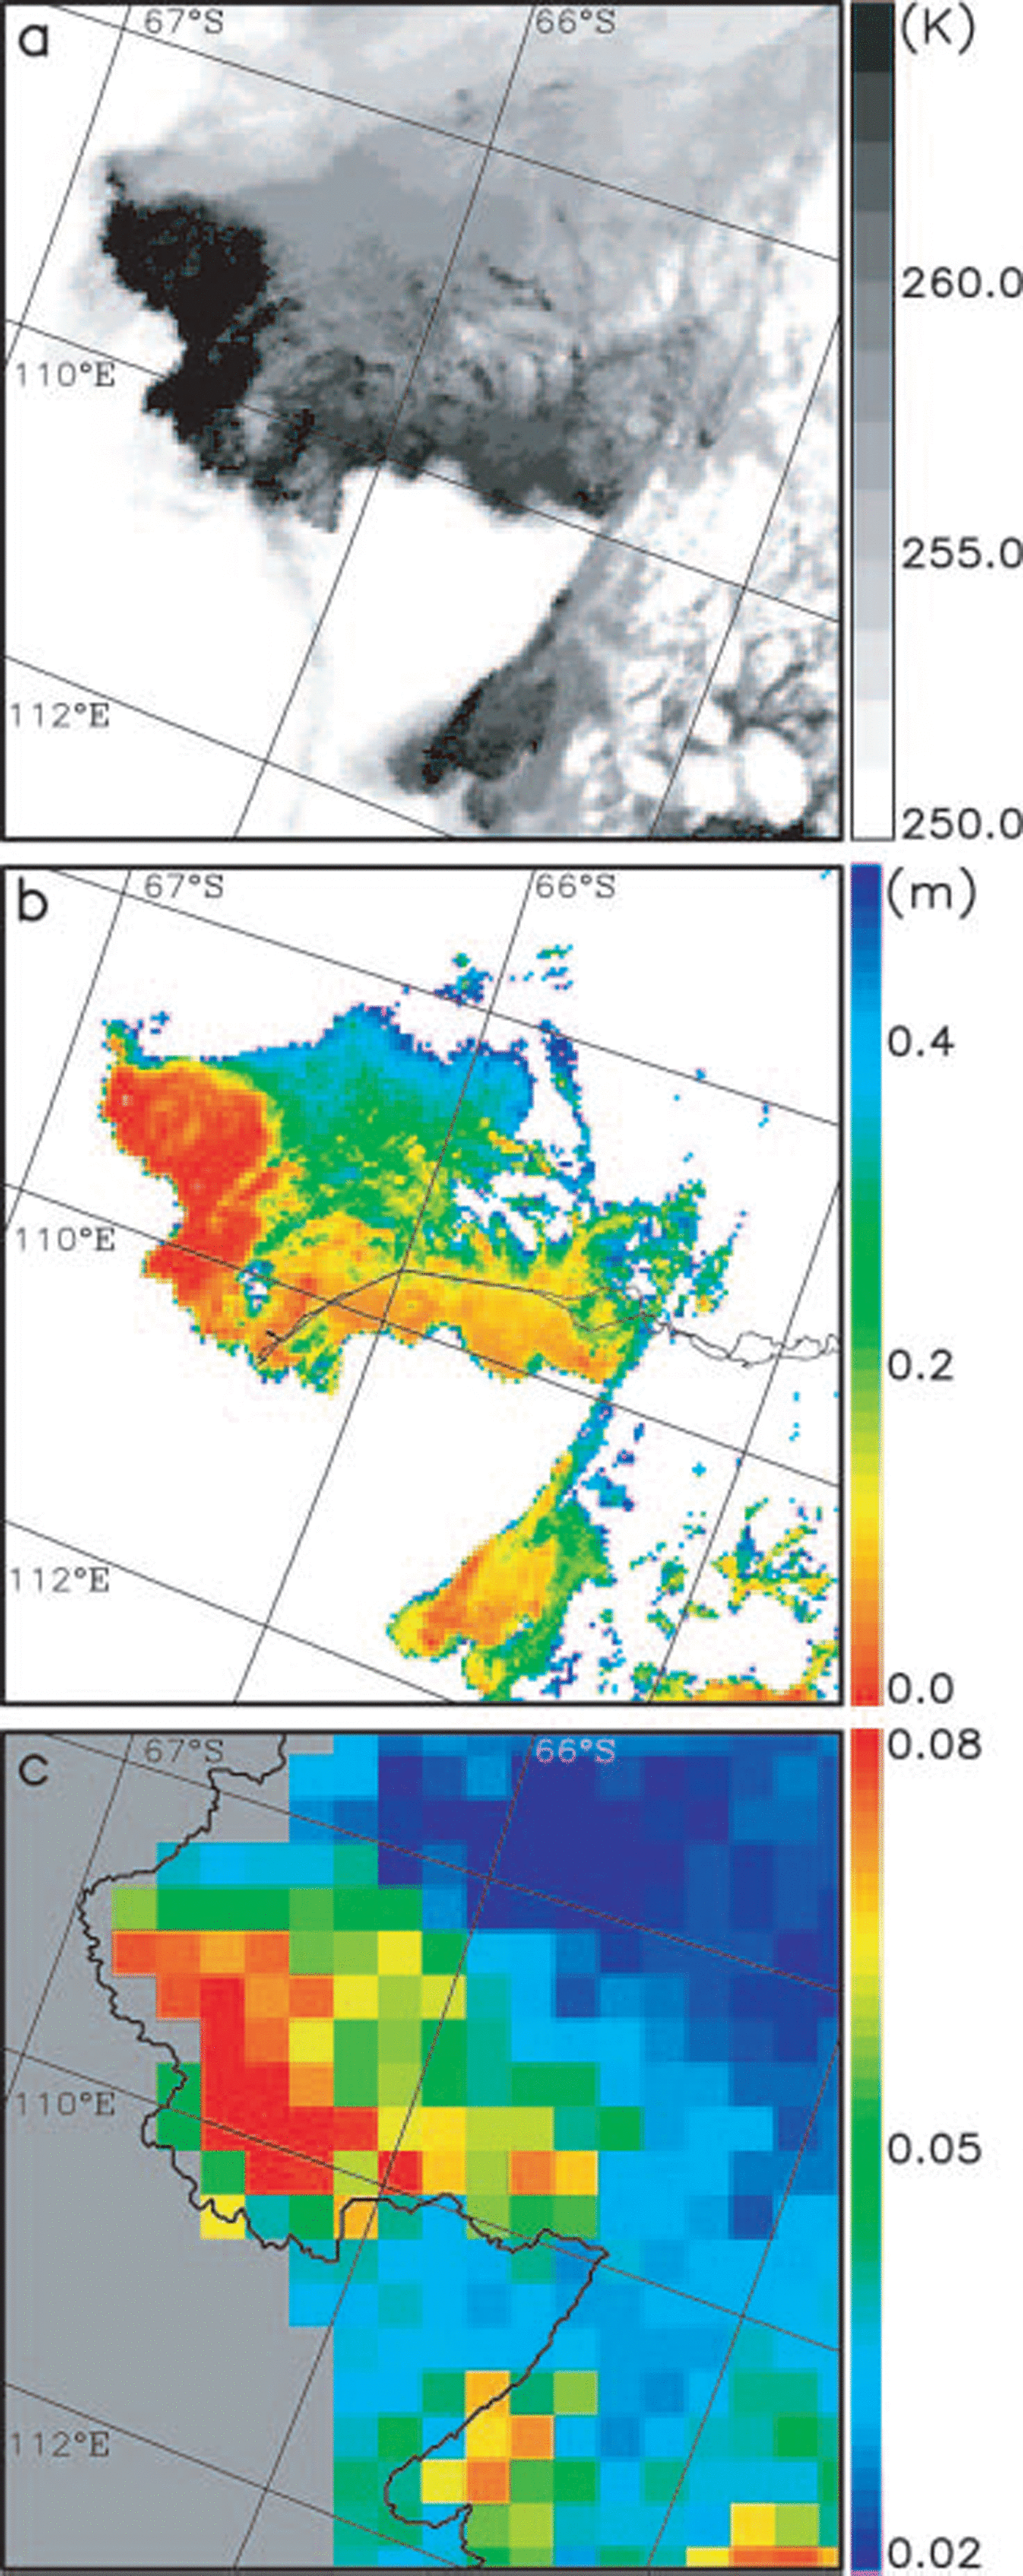
figure 2a and b Show examples of the Spatial distribution of the avhrr Surface temperature and avhrr ice thickness around vincennes bay (for 19 october 2003). the thin-ice distribution is dominated by the presence of a well-developed polynya, with a gradation of increasing ice thickness with increasing distance away from the coast as expected. the meteorological conditions at this time were cold (air temperature ∽257 k), calm (wind Speed ∽5ms–1) and cloud-free. for the Same geographic region, figure 2c Shows the SSM/I/I pr values at 85 ghz (pr85), which are discussed further below.
Comparison of the AVHRR and SSM/I/I imagery for the Vincennes Bay region of East Antarctica on 19 October 2003. Maps of (a) the AVHRR ice-surface temperature; (b) the AVHRR ice thickness with the cruise track Superimposed; and (c) the SSM/I/I polarization ratio at 85 GHZ (PR85) with the ice-shelf edge inferred from the AVHRR data Superimposed. The white pixels in (b) Show an area of thick ice with thicknesses of >0.5m including ice Shelf and continental ice Sheet.
Prior to carrying out the heat-flux calculation, we validated the avhrr-derived Surface temperatures by comparing them with Simultaneous Surface-temperature data from the Ship-borne radiation thermometer (fig. 3a). Satellite data from the pixel closest to the Ship position at that time are used for this purpose, resulting in 16 data points from both day- and night-time. those avhrr data affected by water vapour are excluded. from figure 3a, the bias of the avhrr minus thermometer temperatures is –0.50 k, and the Standard deviation of the difference between the two is 0.73 k. this error is less than that reported by Reference Lindsay and RothrockLindsay and rothrock (1994) and Reference Key, Collins, Fowler and StoneKey and others (1997). this result Shows that the Sea-ice Surface temperature calculated from avhrr data is Sufficiently robust and accurate to be applicable to the heat-flux and ice-thickness calculations below.
Scatter plots of (a) the AVHRR temperature vs thermometer temperature; and (b) the AVHRR ice thickness vs the thermometer ice thickness.
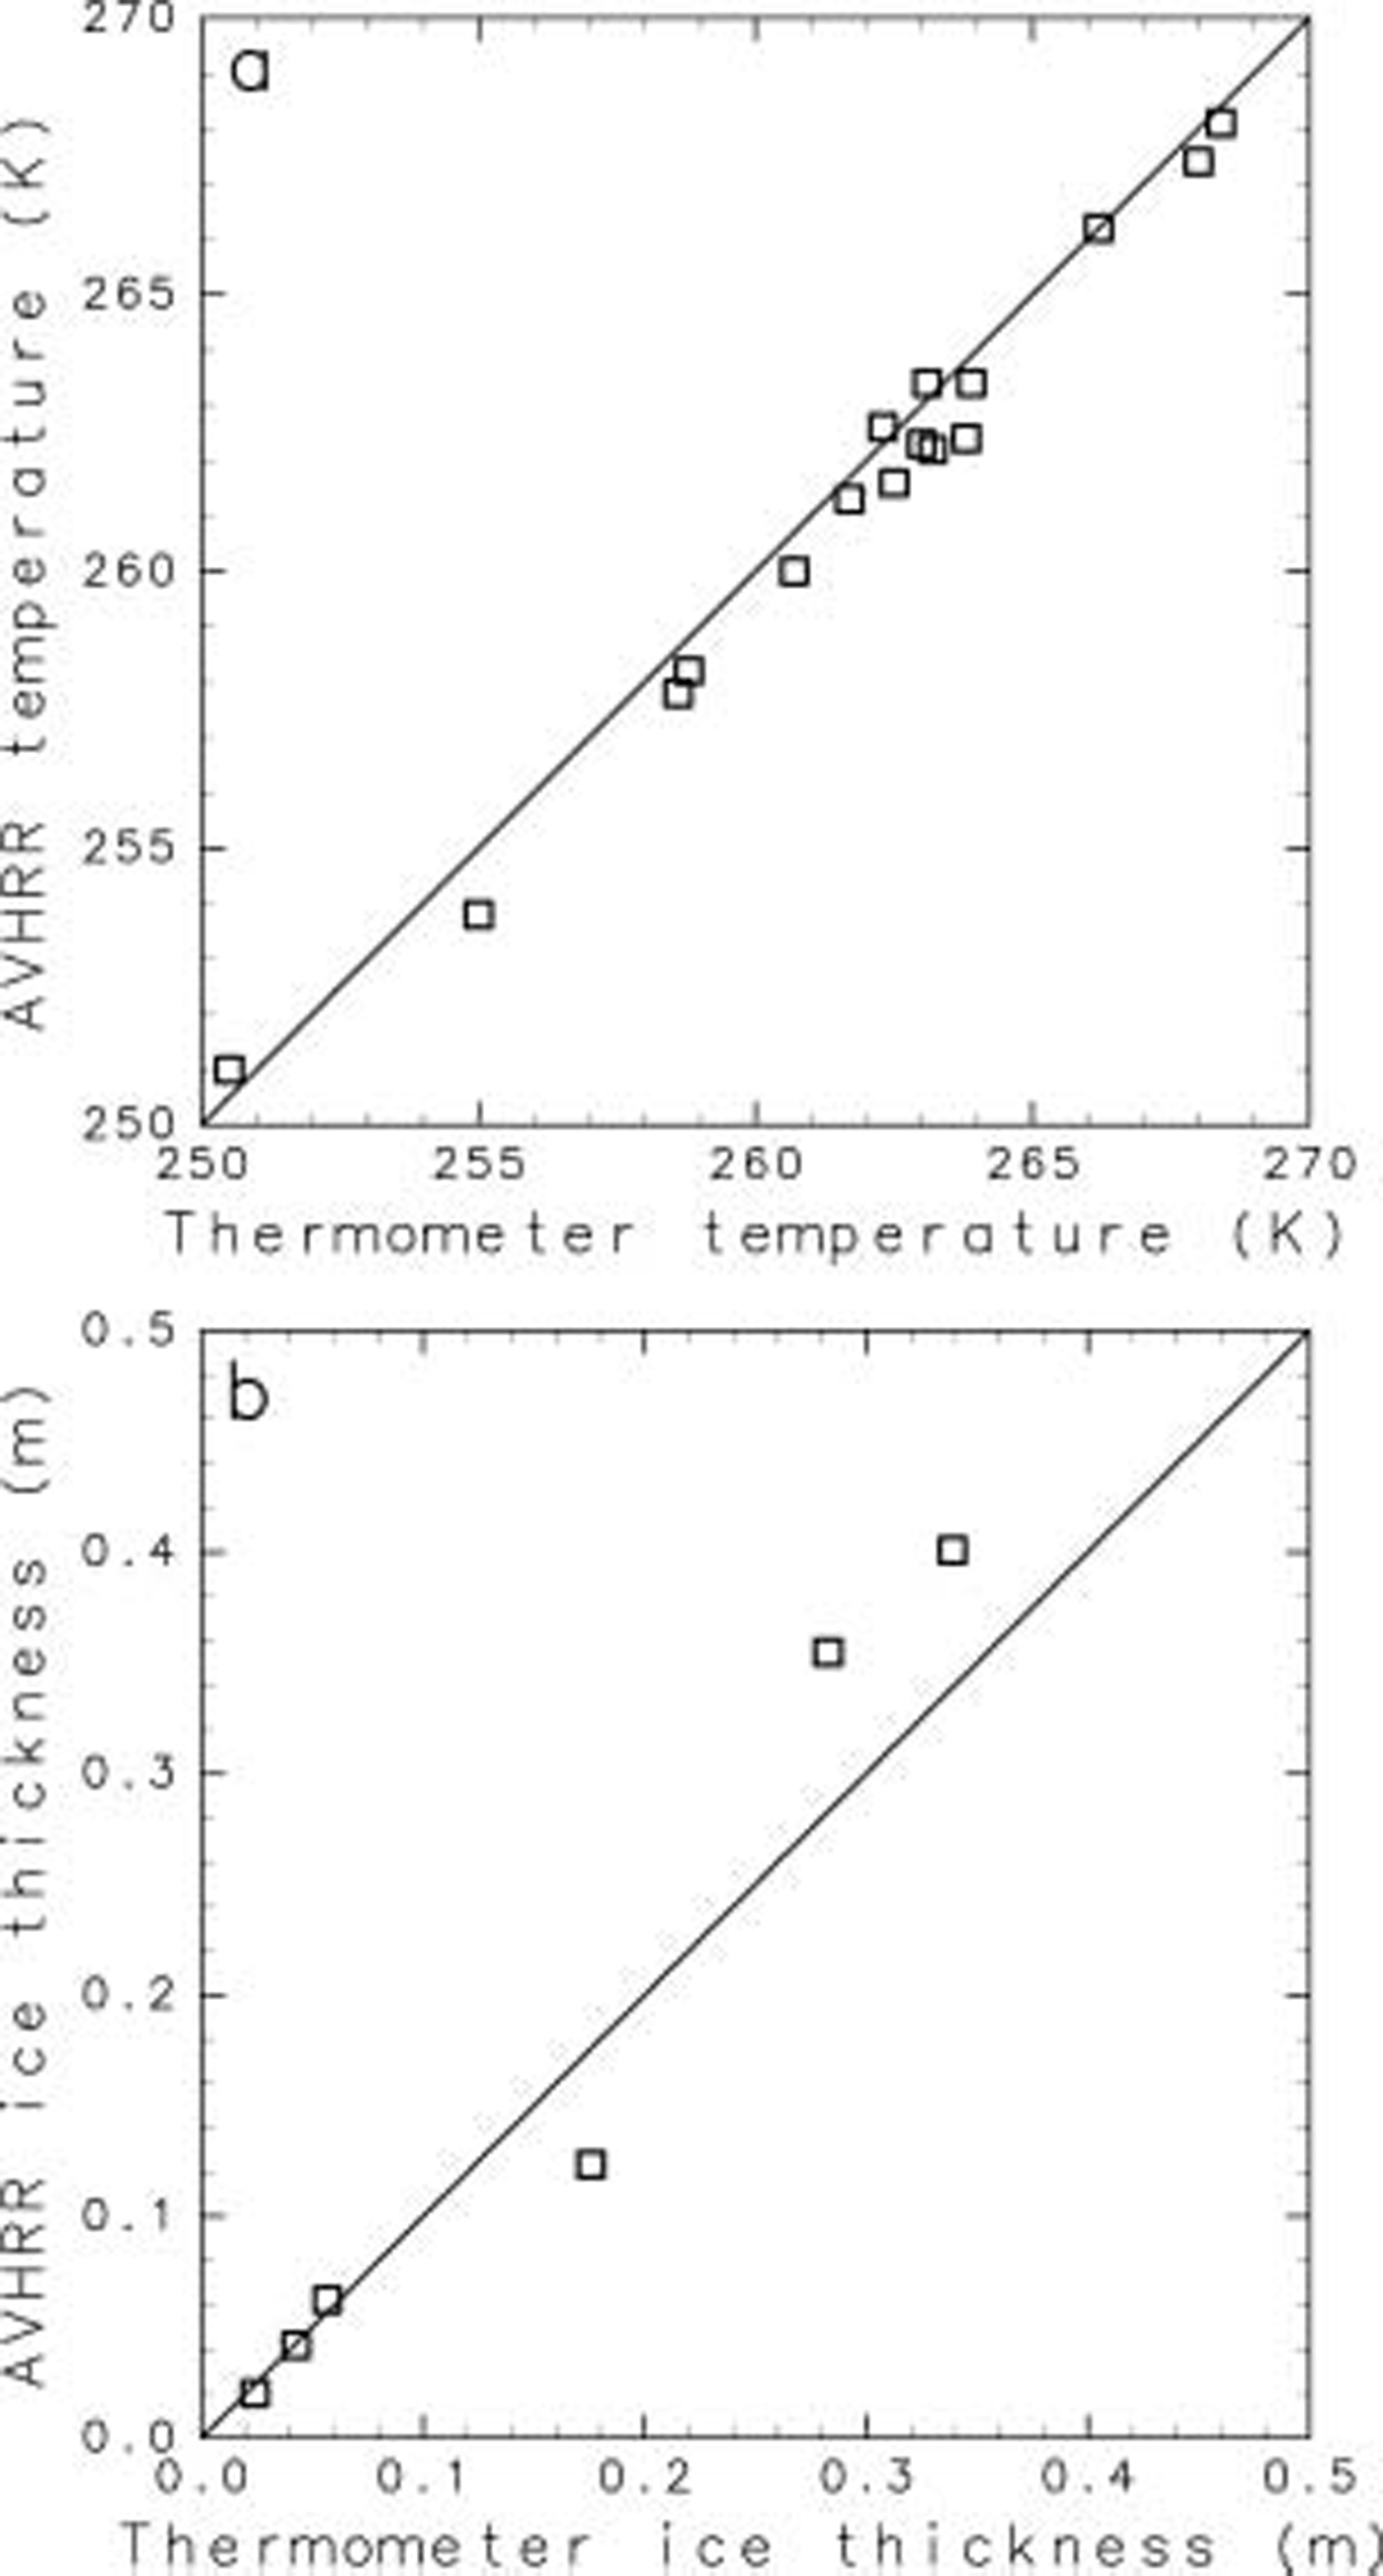
figure 3b compares Simultaneous avhrr and thermometer ice thicknesses estimated by the heat-flux calculation. there are fewer points than in figure 3a because the thickness estimate is valid only between 0200 and 0600 h local time, as described above. moreover, only Sea ice less than 0.5m thick is plotted, as this is the threshold upper thickness applied in the algorithm by yu and rothrock (1996). the avhrr and thermometer ice thicknesses have Similar values, with an average difference of 0.033 m.
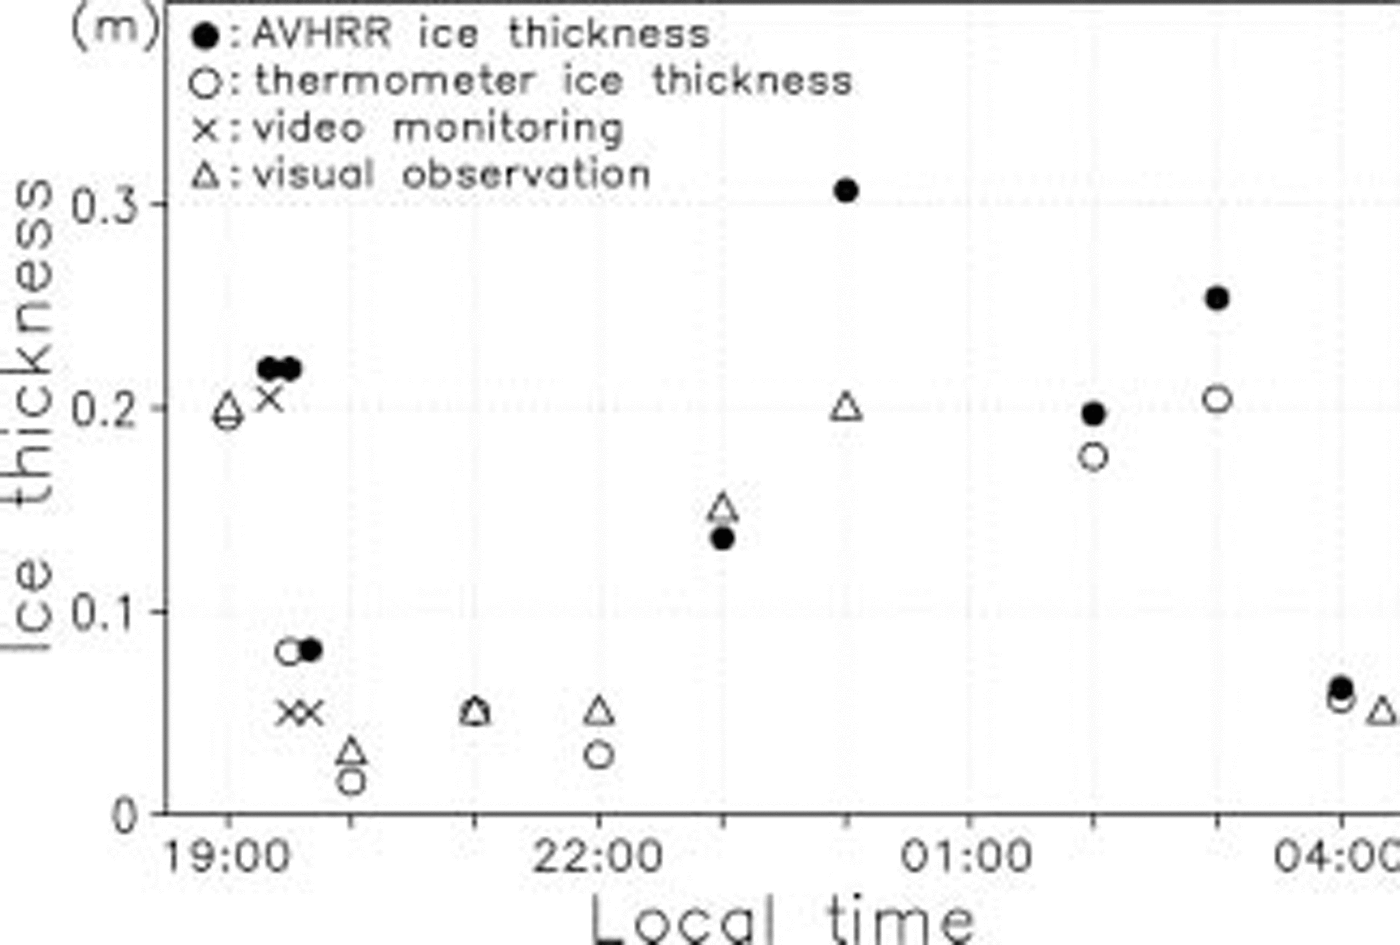
figure 4 compares ice-thickness information acquired from the avhrr, Ship-borne thermometer, video monitoring, and hourly visual observation along the cruise track during the night-time from 17 to 18 october, when the vessel traversed the vincennes bay polynya en route to casey Station. all except the avhrr ice thickness Show values at the time of the abscissa. the avhrr ice thickness is derived from avhrr data at 0412 h (local time) on 18 october, where the thickness at a grid nearest to the Ship position corresponding to the time of the abscissa is used. in Some regions, the avhrr ice thickness cannot be estimated due to water-vapour contamination effects, giving deficits in the figure. Sea-ice growth in the polynya during this particular night (2000–0400 h local time) is estimated to be ∽0.02m from the heat-flux calculation (i.e. an average net heat flux of ∽–170wm–2). the avhrr ice thickness at 0412 h is plotted in this figure without any correction because the difference of ice thicknesses caused by the Sea-ice growth back from this time is at most only 0.02 m. the reliability of thermometer ice thicknesses calculated for the period 1900–2200 h is Somewhat less, due to the effect of Shortwave radiation. in Some regions, the thermometer ice thickness cannot be estimated because the Ship-borne thermometer temperature record exhibits a large range of values due to the presence of many types (thicknesses) of ice within its field of view. the difference between the avhrr ice thicknesses and other ice thicknesses varies between ∽0.005 and 0.025 m.
Comparison of Sea-ice thickness derived from Several methods along the cruise track in the Vincennes Bay polynya during the night-time, with the abscissa being local time.
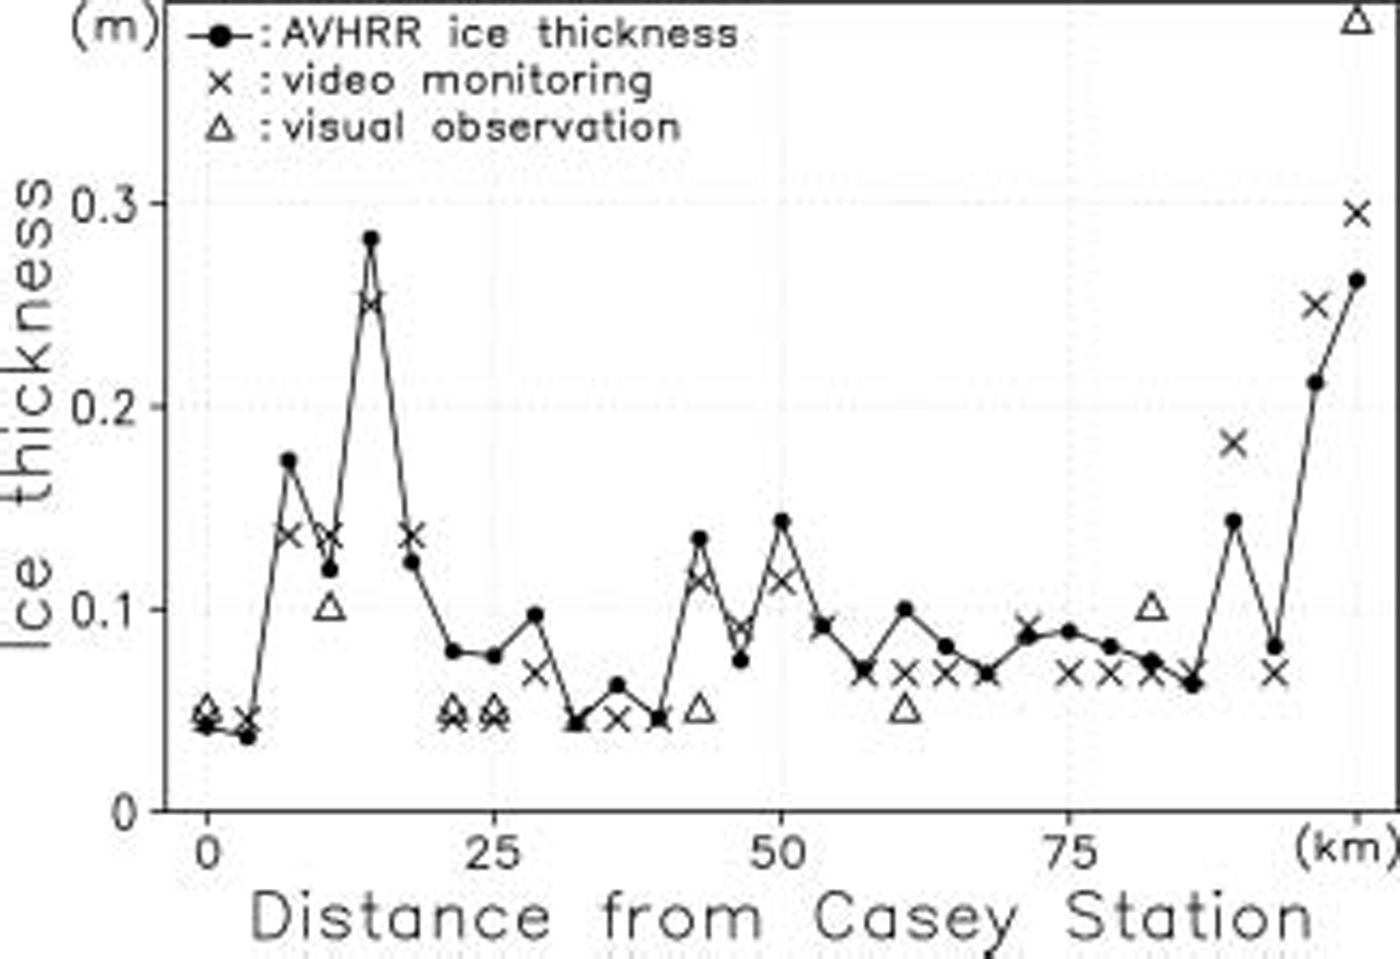
Another comparison, which is more reliable, is carried out on data acquired along the cruise track during the daytime of 19 october (fig. 5), when the vessel left casey Station and traversed the vincennes bay polynya in a northward direction (fig. 1). once again, all ice thicknesses except the avhrr ice thickness Show values at the time of the Ship position of the abscissa. the avhrr thickness is derived from avhrr data at 0529 h (local time) on 19 october, again using the thickness from a pixel nearest to the Ship position corresponding to the abscissa. local time at 0 and 100 km in figure 5 corresponds to 0600 and 1400 h, respectively. because the average net heat flux in this polynya from 0600 to 1400 h on this day is ∽–20wm–2, the corresponding change in ice thickness due to the Sea-ice growth or decay is very Small, i.e. of the order of 0.001 m. thus, the avhrr ice thickness at 0529 h can be applied to all data in this figure without any correction. the bias of the avhrr ice thicknesses minus the ice thicknesses estimated from video monitoring is +0.005 m, and the Standard deviation of the difference between the two is 0.022 m. also, the avhrr ice-thickness estimates are comparable with those from the hourly visual observation dataset.
Comparison of Sea-ice thickness derived from the three methods along the cruise track in the Vincennes Bay polynya during the daytime, with the abscissa being the distance from Casey Station.
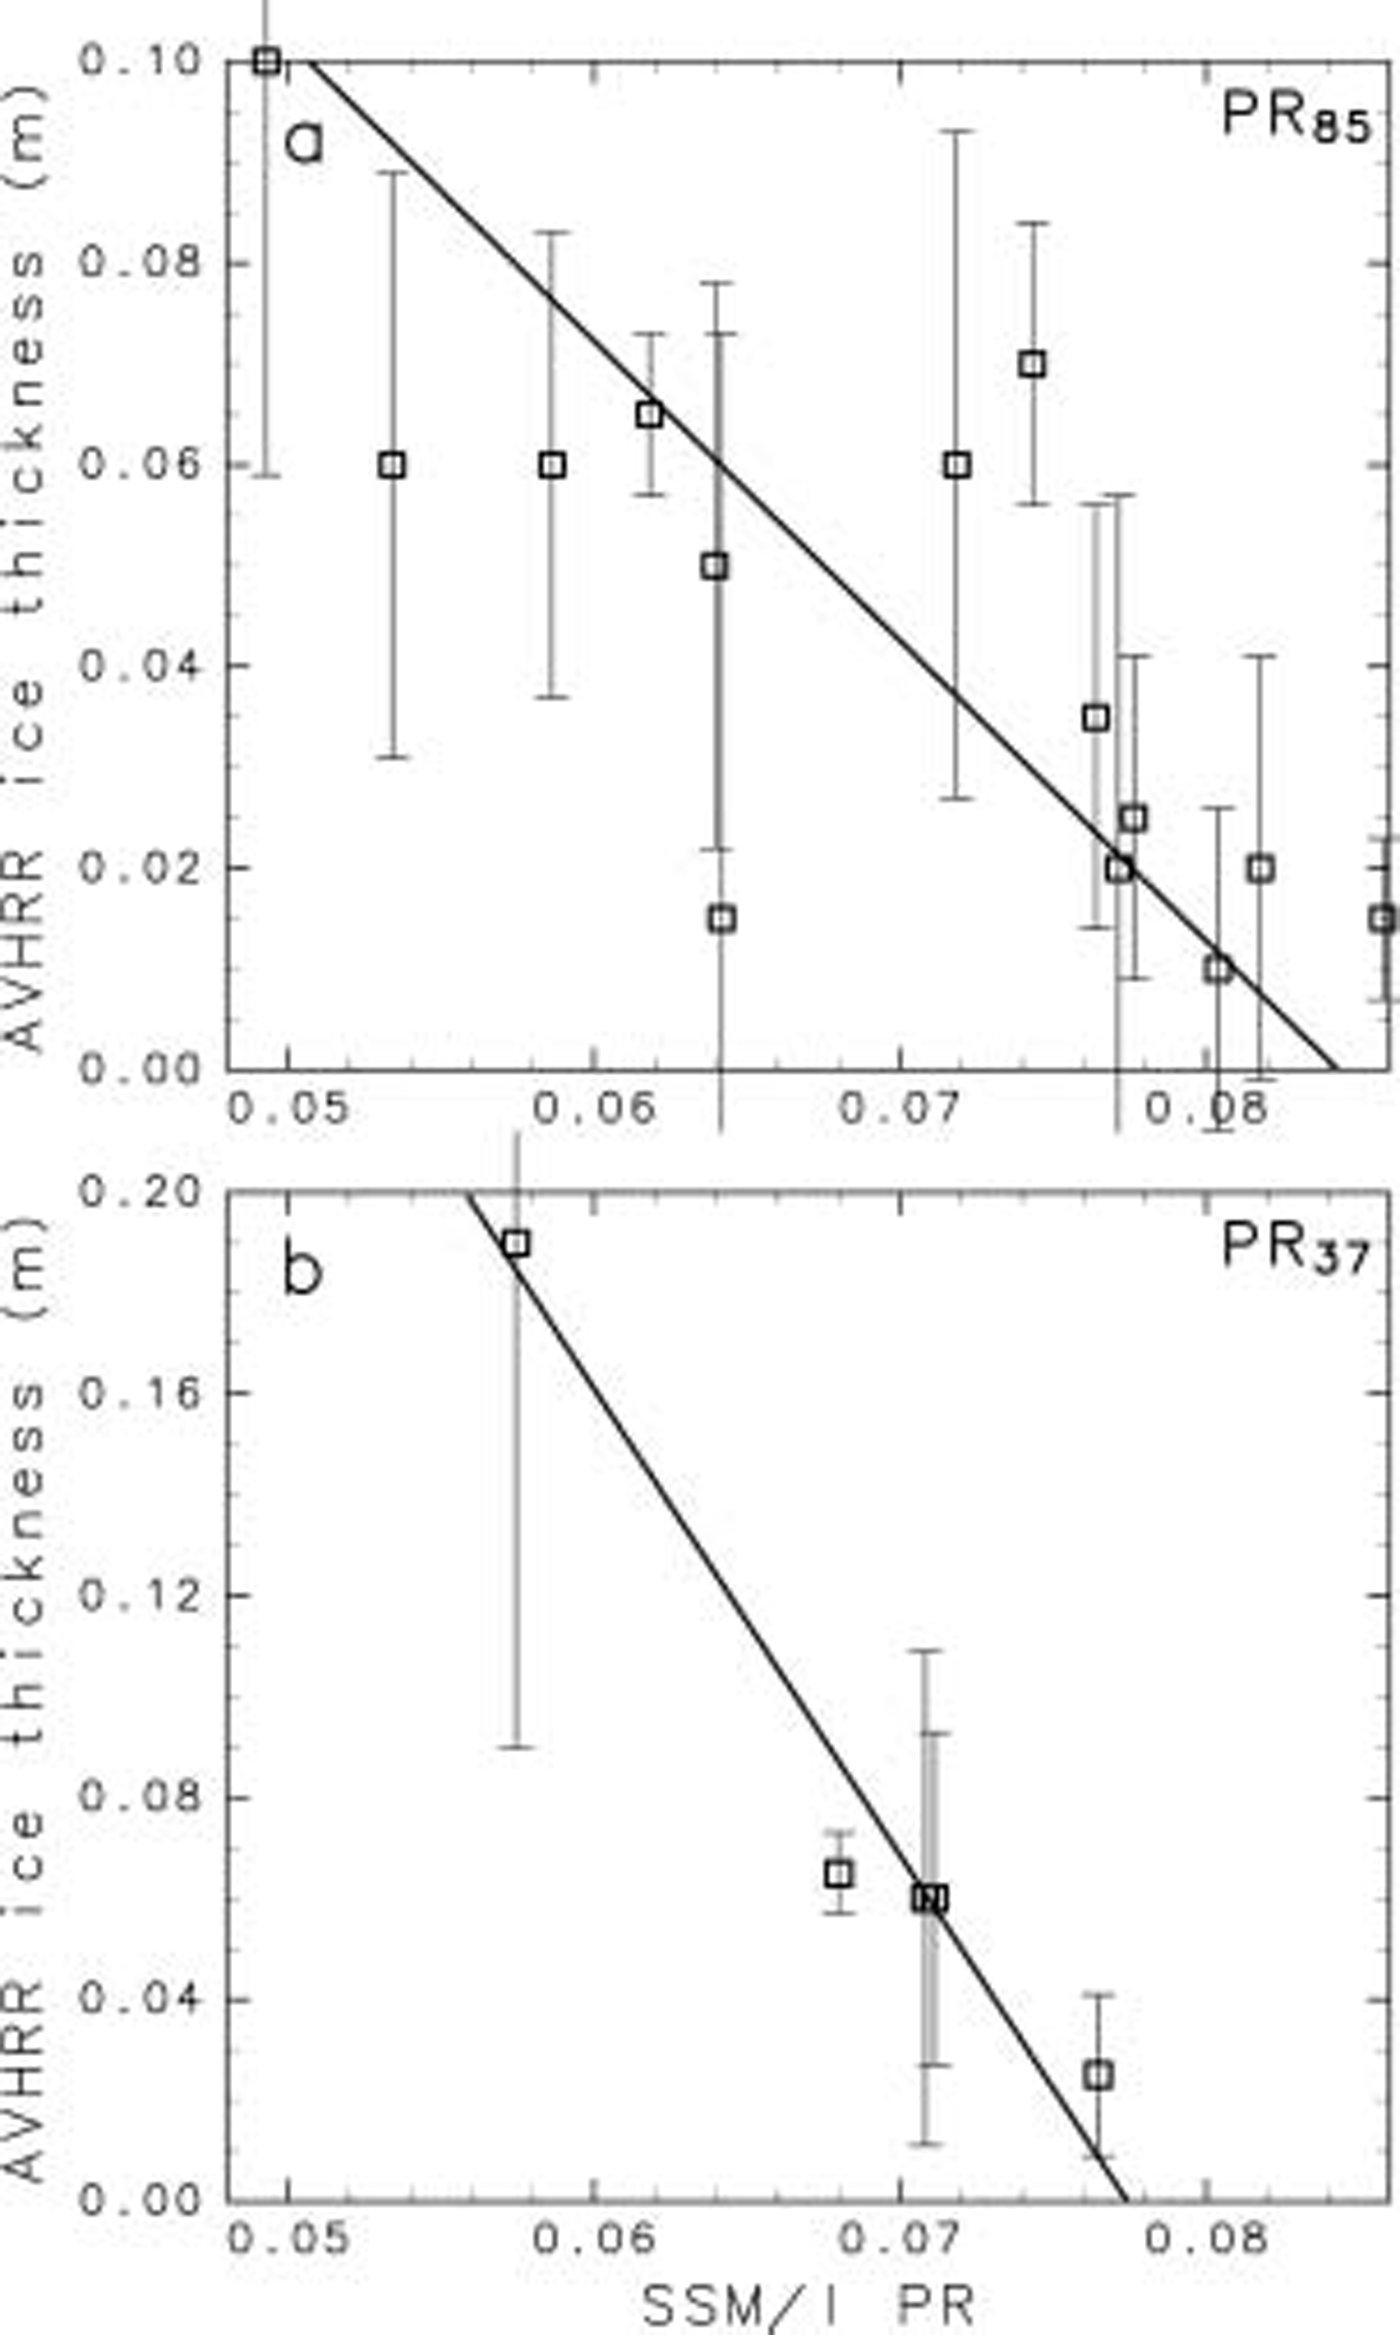
Given its apparent accuracy, we finally apply the avhrr ice-thickness product to an asseSSM/Ient of the potential use of passive-microwave data as a means of determining thin-ice thickness on a wider Scale. referring to previous Studies in the arctic by Reference CavalieriCavalieri (1994) and Reference Martin, Drucker, Kwok and HoltMartin and others (2004), we compare SSM/I/I pr85 and pr37 at a Spatial resolution of SSM/I/I with the retrieved avhrr ice thicknesses (fig. 2b and c). figure 2c Shows the Spatial distribution of pr85 in the vincennes bay polynya region on 19 october 2003. comparison of these results with those in figure 2b Shows that high values of pr generally and consistently coincide with regions of thin avhrr ice thickness within the polynya. we Select two avhrr Scenes in which the vincennes bay polynya can be clearly Seen and Show the relationship between the pr values and the avhrr ice thicknesses (fig. 6a and b). for the comparison, we choose avhrr data whose distance from the center of the SSM/I/I gridcell is less than 6.25 km (for 85 ghz) and 12.5 km (for 37 ghz). thus, the numbers of avhrr data that are used for the comparison with SSM/I/I gridcell data are ∽80 (for 85 ghz) and ∽300 (for 37 ghz). for the SSM/I/I gridcell, we use the hypothetical thermal ice thickness for which the total heat loss can be calculated under the assumption of uniform ice thickness, instead of a Simple arithmetic average of the avhrr thickness. in figure 6a and b, we Show the Standard deviation of avhrr ice thicknesses in the SSM/I/I gridcell in each plot. the Standard deviation is not Small in Some plots because of outlier data (thickness of 0.2–0.5 m), although the number of Such data is limited. (the proportion of ice with thicknesses of >0.2m for 85 ghz is 0–4%, and of ice with thicknesses of >0.4m for 37 ghz is 0–5%, for all the plots.) the random errors caused by the pr values are ∽0.002 for pr85 and ∽0.001 for pr37, based upon the assumption that the brightness temperature has a random error of 0.6 k for pr85 and 1.1 k for pr37 (Reference Hollinger, Peirce and PoeHollinger and others, 1990; Reference Martin, Drucker, Kwok and HoltMartin and others, 2004). taking account of the Skin depth of bare Sea ice for 85 and 37 ghz (Reference Eppler and CarseyEppler and others, 1992), only ice <0.1m thick is Shown for pr85, and only ice <0.2m thick is Shown for pr37. with respect to the principal-component axes of these plots, the explained variance of the principal component is 94% for pr85 and 99% for pr37, and the correlation coefficient is –0.76 for pr85 and –0.98 for pr37. although the Sample number is limited, figure 6a and b Suggest that the avhrr ice thicknesses are Significantly related to the pr values. this result provides a first Step towards the development of an algorithm to estimate the distribution of thin antarctic Sea ice from the Satellite passive-microwave data Stream. as a word of caution, a trade-off is that the higher the frequency, the better the Spatial resolution but the greater the atmospheric contribution. indeed, the latter can be Significant at 85 ghz (Reference st-GermainSt-germain, 1994).
Scatter plot of the AVHRR ice thickness vs SSM/I/I PR for (a) 85 GHZ and (b) 37 GHZ. The Solid line denotes the principal-component axis of these plots. The vertical lines with crossbars Show the Standard deviation of AVHRR ice thicknesses in the SSM/I/I gridcell in each plot.
4. Concluding Remarks
In this Study, we used a variety of data collected during the arise field programme in east antarctica to examine and confirm the validity of avhrr-derived estimates of thin Sea-ice thickness, based upon the heat-flux calculation combined with ecmwf data, in the vincennes bay polynya region. the Satellite-derived estimates Show good agreement with three Sets of independent data acquired in the field. the Standard deviation of the difference between the avhrr-derived and in Situ data is ∽0.02 m. we also validated the avhrr ice-surface temperature algorithm (Reference Key, Collins, Fowler and StoneKey and others, 1997) that forms the basis of the ice-thickness algorithm. issues remain regarding the detection and removal of the variable effects of unresolved high thin clouds and ice fog (Reference Martin, Drucker, Kwok and HoltMartin and others, 2004). the former result in a cold bias in Surface-temperature retrievals from Satellite thermal-infrared data, making the ice appear colder and thicker than it actually is. ice fogs, which are generated by intense vapour flux from polynyas and leads, result in a warming bias. in Spite of these limitations and the difficulty of cloud obscuration of the Surface and its detection/masking, the ready availability of avhrr data makes them attractive for Studies of polynya Surface temperature and ice thickness, especially when combined with Satellite passive-microwave data, as previously Shown in the arctic by Reference Martin, Drucker, Kwok and HoltMartin and others (2004). indeed, this Study underlines the potential of passive-microwave polarization ratio techniques as a means of determining thin-ice thickness and enabling estimates of heat flux and Sea-ice production on a wider Scale, uninterrupted by cloud cover or darkness. while the results presented here are encouraging, these techniques require further testing to determine their circumpolar applicability over a wider range of conditions. the application of the moderate resolution imaging Spectroradiometer (modis) data and the advanced microwave Scanning radiometer-eos (AMsR-E) data would provide more reliable estimates of Sea-ice thickness at higher Spatial resolution. this is the focus of future work.
Acknowledgements
We acknowledge the excellent Support given by the captain and crew of the R/v Aurora Australis. we are grateful to t. Scambos and t. haran of the national Snow and ice data center (NsIDC), boulder, co, UsA, for Supplying the avhrr data, to i. allison, v. lytle, t. worby, f. nishio and k. naoki for Support and cooperation, and to t. toyota, y. fukamachi, S. nihashi and m. wakatsuchi for Support and encouragement. we also thank anonymous reviewers for useful comments. SSM/I/I data were obtained from the nasa earth observing System distributed active archive center (daac) at the NsIDC. t.t. was Supported by the 21st century center of excellence program funded by the japanese ministry of education, culture, Sports, Science and technology (mext). k.o. was Supported by the fund from the research revolution 2002 of the project for Sustainable coexistence of human, nature and the earth within mext. for r.m., this work was Supported by the australian government’s cooperative research centres programme through the antarctic climate and ecosystems cooperative research centre (ace crc), was carried out as part of aas project 2298, and formed part of nasa’s AMsR-E validation program through nra-oes-03.



