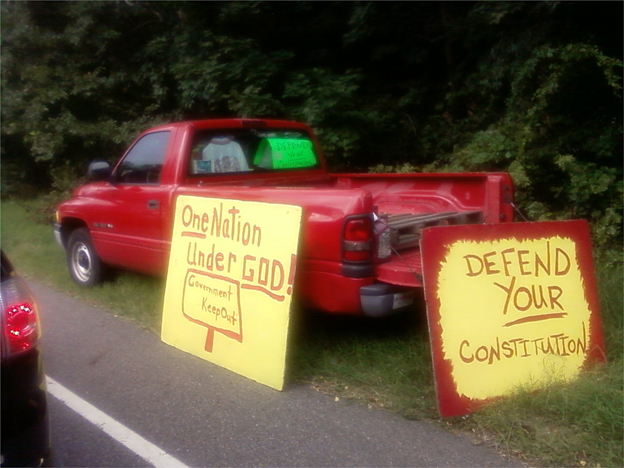
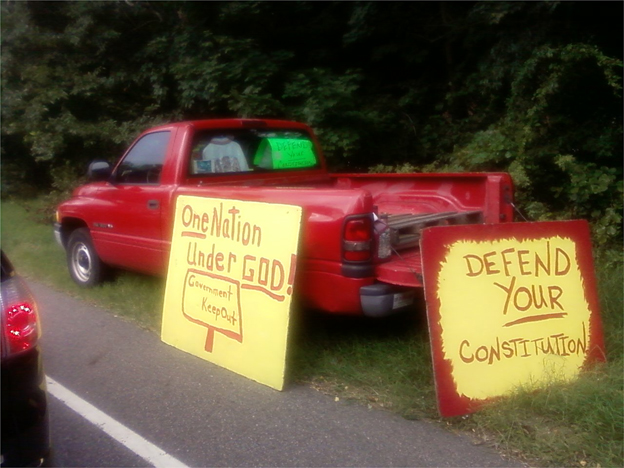
God is not in the Constitution, contrary to a common belief expressed by the signs on the pickup truck in figure 1. If anything needs defending, it is the First Amendment’s prohibition of a state religion: “Congress shall make no law respecting an establishment of religion.” When the Constitution was written, people in most parts of the world belonged to a church because that is what the ruler dictated and it was the ruler’s church. While ensuring a rich diversity of religious faiths in the United States, a ban against a state-imposed religion also raises the prospect that a good portion of the population will stay aloof from any church. Indeed the first survey of religious affiliation, conducted in 1937, revealed that one-quarter of Americans professed none. This exceeded the share of any religious group (Catholics being the largest, followed by Methodists, Baptists, and other Protestant denominations). In other words, “None” was the largest denomination nearly a century ago and has remained so, with its ranks topping 30% by 1980 and 40% by 2012, while the shares of nearly all other denominations have shrunk. Given the fact that surveys overreport religious behavior, just like voting turnout, the true proportion of nonreligious Americans in all likelihood exceeds those poll numbers. Whatever their exact number, secular Americans have long formed a bloc large enough to rival any religious group as an electoral power broker. Yet neither of the major parties has wooed them, nor have nonreligious Americans been in the habit of making political waves. But this is changing with the rise of the Religious (Christian) Right and the GOP’s embrace of its agenda.
Beliefs about God and Constitution
Photo taken by the author in Setauket, NY, September 8, 2012.
CHURCH MEMBERSHIP
Ever the pioneer, George Gallup in February 1937 launched a poll on religion in the United States. He posed a simple question: “Are you a member of a church?” From then on until 2012, the Gallup Organization asked this question, with some tweaking of the wording, in more than 200 polls.Footnote 1 In 1950, “synagogue” was added as an option, although its omission in earlier polls did not seem to discourage Jewish respondents from volunteering their affiliation; the option “mosque” was added in 2005. Another 1937 Gallup Poll, this one in September, followed up the church question for those who professed membership with one about their denomination, although Gallup did not make a habit of this practice in his polling. The September 1937 poll is the first to provide a ranking of familiar denominations by popularity (size of the flock): Catholic, Methodist, Baptist, Presbyterian, Lutheran, Episcopalian, and more. It also lets us see how well each stacks up against the no-church flock.
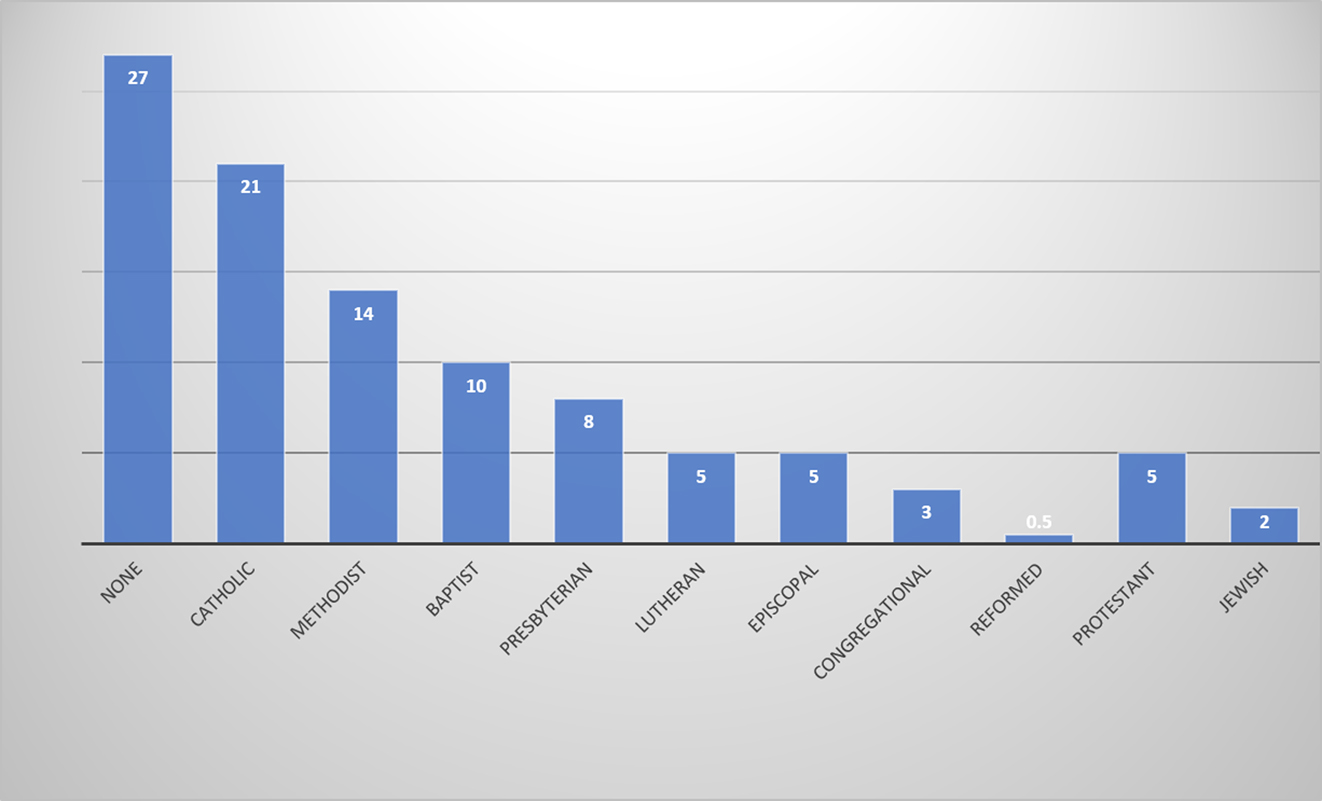
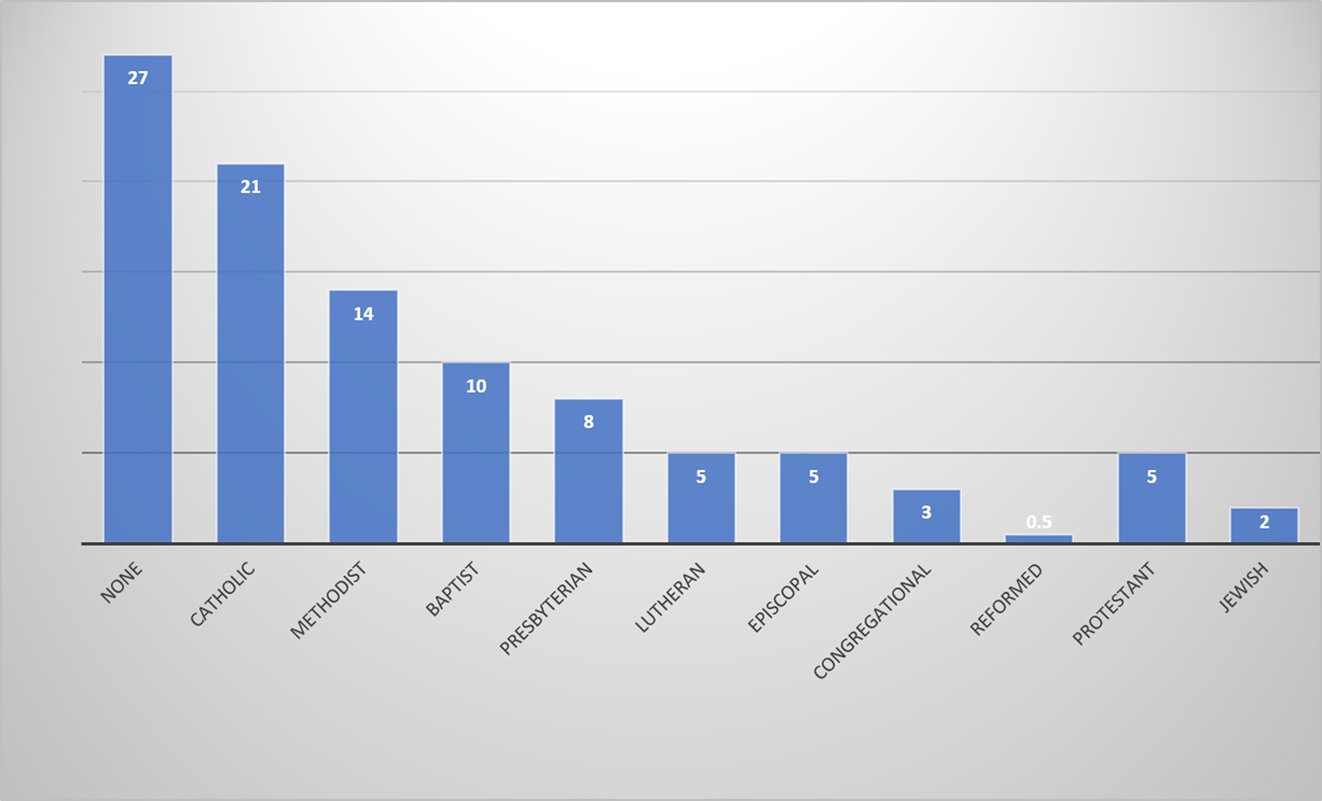
Americans without a church (None) commanded 27% in that 1937 survey, topping all but Catholics by sizable margins (figure 2
Religious Affiliation of Americans in 1937 (Percent)
Gallup Poll. September 18-23, 1937 (#99), N=2,965.
).
The results could not have pleased the churches. Americans without a church (None) commanded 27% in that 1937 survey, topping all but Catholics by sizable margins (figure 2).Footnote 2 Even though “None” was in a way the largest denomination, this poll finding made no headlines in the New York Times or the Washington Post, where George Gallup had a regular column publicizing newsworthy results of his surveys. Polls about church membership rarely did. The first time he wrote about this subject in his column was in 1954 under the headline, “81 Million American Adults Claim Church Membership” (Gallup Reference Gallup1954). That news, the column went on to note, was grist for Rev. Billy Graham’s religious revival campaign. The fact that about one in five Americans professed no church membership was barely mentioned in the article. Only one other poll story about this topic made the Times or Post.Footnote 3 It reported the latest level of church membership and added a timeline showing levels of affiliation since 1937 (Gallup and Gallup Reference Gallup and Gallup1988).
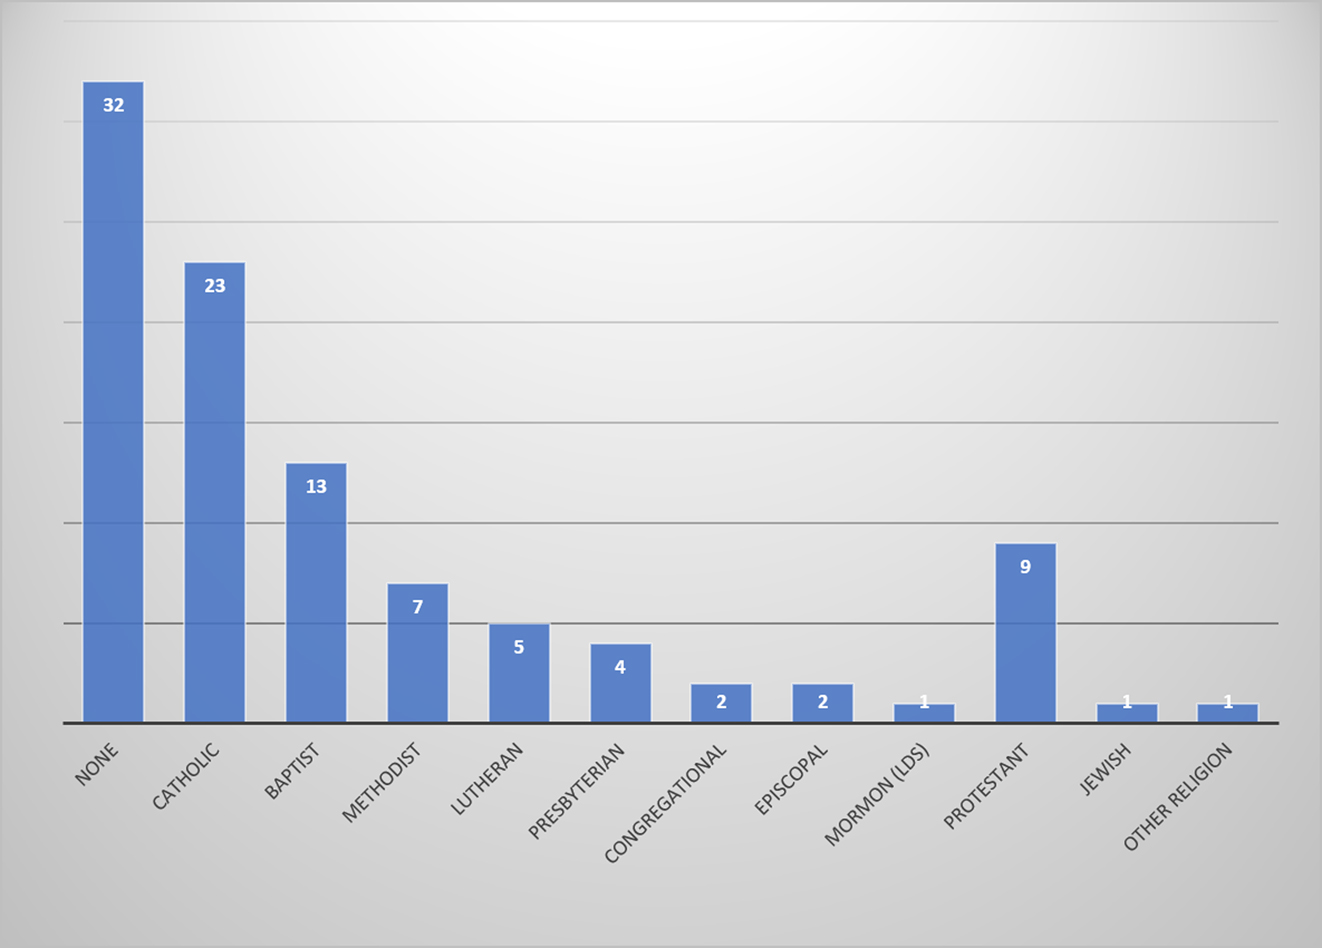
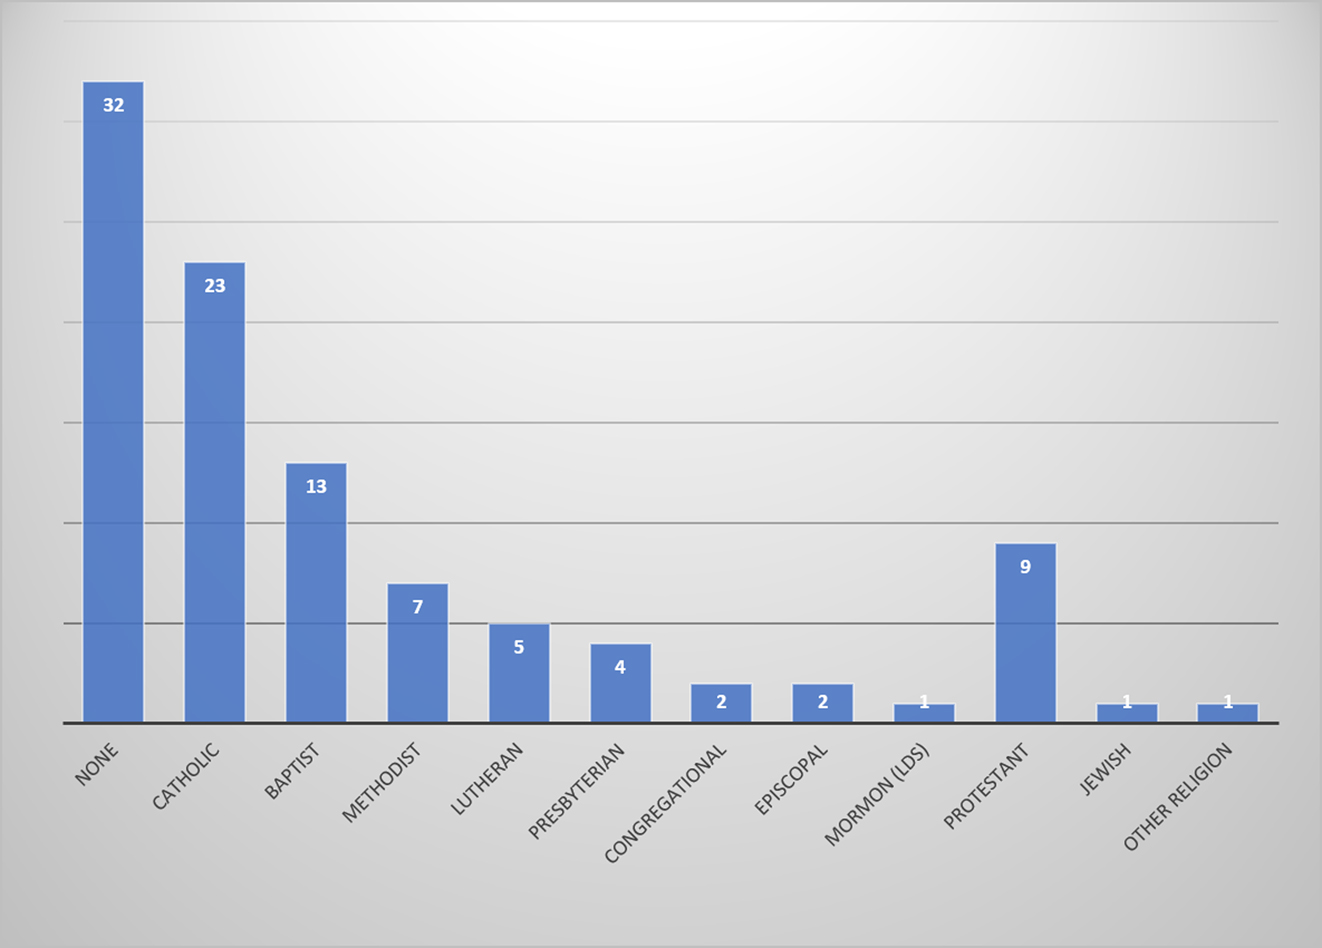
Fast forward to 1980 when the Nones had expanded their dominant share to 32% (figure 3). Catholics remained in second place, and Baptists had overtaken the Methodists to gain third place. Most mainline Protestant churches, especially Episcopalians and Presbyterians, suffered declines, along with the Methodists, as the tumult of “the long Sixties” took its toll (Putnam and Campbell Reference Putnam and Campbell2010, 389). Meanwhile unspecified Protestant churches, presumably evangelical in nature, recorded a surge in the size of their flocks. Although the decline of mainline Protestant churches warranted attention in poll stories in the Times and Post, the rise to prominence of the no-church flock once again escaped notice.
Religious Affiliation of Americans in 1980 (Percent)
Gallup Poll. December 5-8, 1980 (#1166G), N=1,549.
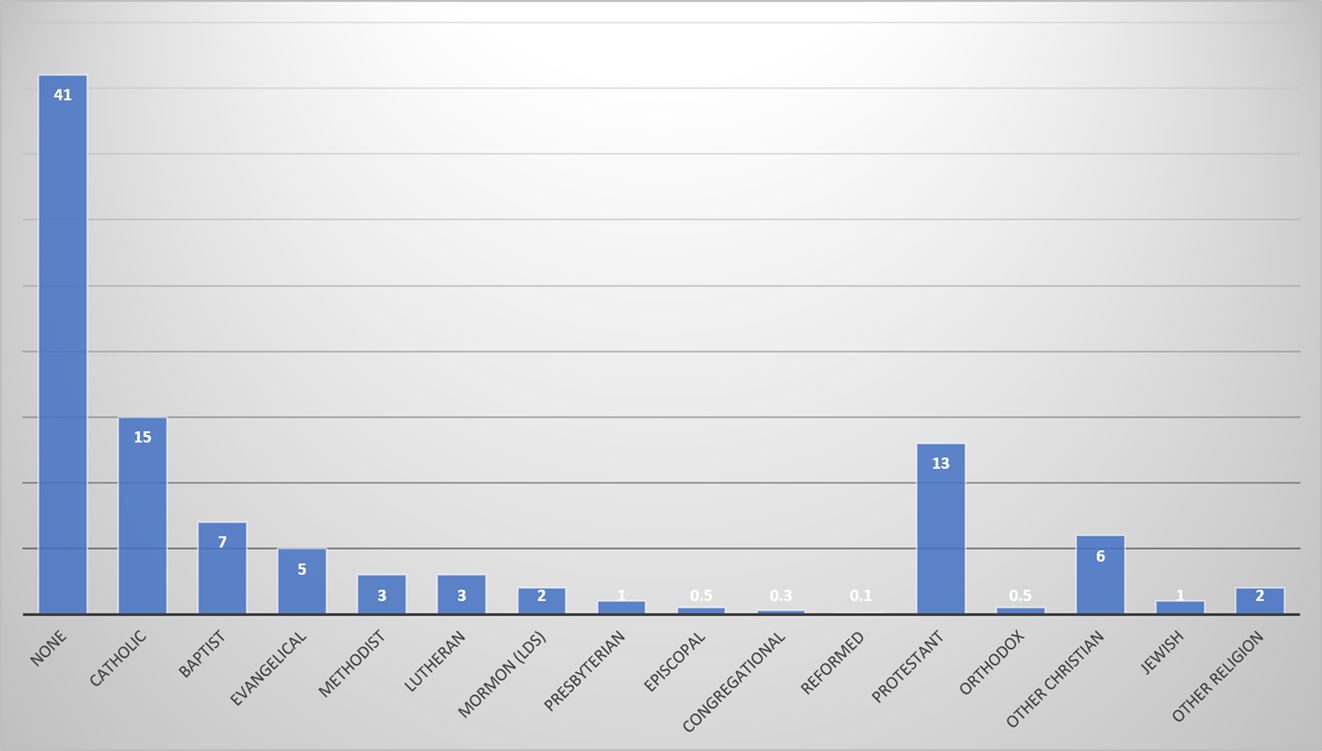
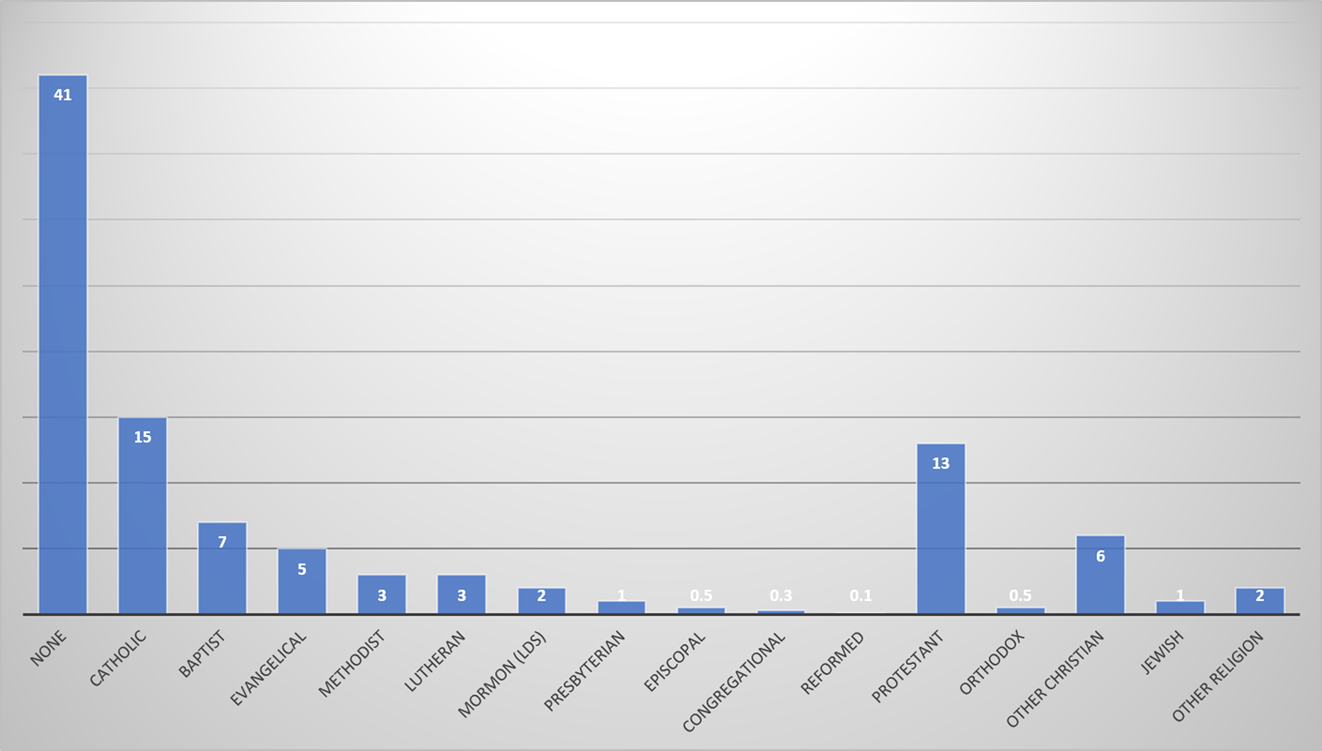
By 2012, reaching a share of 41%, the Nones loomed over every other denomination like Trump Tower over St. Patrick’s Cathedral (figure 4). The flocks of mainline Protestant churches continued to dwindle, some barely attaining even a single percentage point, as the ranks of evangelicals and unspecified Protestant churches, which were most likely evangelical as well, surged.Footnote 4 Yet even when combined with Baptists, this broadly defined evangelical assortment was still far outnumbered by Americans without religious affiliation. There are no signs that the Nones have lost any ground since 2012 (Newport Reference Newport2016).Footnote 5 The moment when they will cross the majority threshold does not seem too far away.
Religious Affiliation of Americans in 2012 (Percent)
Gallup Poll. June 7-10, 2012 (#G201208), N=1,004.
RELIGIOUS IDENTITY
By now any reader even remotely familiar with some basic statistics of religiosity in the United States may hardly be able to hold back this question: What about all the evidence to the contrary? Even though Gallup Polls are the only surveys to go back as far as the 1930s, other polls conducted as early as the 1950s paint a far more pious portrait of religion in the United States. The 1952 American National Election Study (ANES) found barely 3% professing no religious affiliation (ANES Guide to Public Opinion and Electoral Behavior 1952, Table 1B.1a).Footnote 6 This was a far cry from the 27% recorded by the Gallup Poll in 1937, which held steady at that level in 1952. More recently, the 2006 “Faith Matters Survey” reported a share of 17% for Nones (Putnam and Campbell Reference Putnam and Campbell2010, 17). Again, this is far below the 41% percent found in the 2012 Gallup Poll cited earlier or even of 37% in its 2006 poll. Surveys by the Pew Center and the Public Religion Research Institute (PRRI) in the last few years have pegged the share of the religiously unaffiliated at slightly above 20% (Jones and Cox Reference Jones and Cox.2017; Pew Research Center 2015). Those estimates, too, barely approach half of the 2012 Gallup figure. What accounts for the gap?
One important clue is the way the religion question is worded in those surveys. As noted, the Gallup Poll asks, with slight variations, “Are you a member of a church?” In contrast, the other surveys adopt an attitudinal approach that probes religious preference or identity. When the ANES began asking about religion in 1952, it phrased the question this way: “Is your Church preference Protestant, Catholic or Jewish?" Note that the text of this question provides a list of religious options while omitting the opt-out alternative (None): a respondent would have to volunteer not having any religious preference, which might be socially undesirable (politically incorrect). By themselves, these technical features would lead to some overreporting of religious affiliation and depress the incidence of no religion, but probably not enough to close the gap.
More compelling is the fact that the ANES question is about preference or, in later and other surveys, about religious identity ("Are you Protestant, Catholic, or Jewish?"). It is an easy test to pass for anyone brought up in a particular faith, which may instill a lifelong allegiance. In contrast, asking someone about being a “member of a church” is a harder measure of religious affiliation. Some respondents in a survey may treat the question as asking them whether they go to church (or synagogue) regularly, pay their membership dues, and participate in other activities of their congregation. Not surprisingly, a lot more people have some subjective attachment to a particular church than would say they belong to it as a “member.” What is it, in particular, that makes the church membership measure a harder test of religious affiliation than a measure eliciting preference or identity?
What is it, in particular, that makes the church membership measure a harder test of religious affiliation than a measure eliciting preference or identity?
Attendance at Services
Suspect number-one would be church attendance. Of course, anyone professing not to be a member of a church is not going to show up at religious services other than for weddings, funerals, baptisms, or social functions. At the same time, those who do say they are a member of a church may be the kind of people who attend services regularly. In other words, is the question about church membership just another way of asking about church attendance?
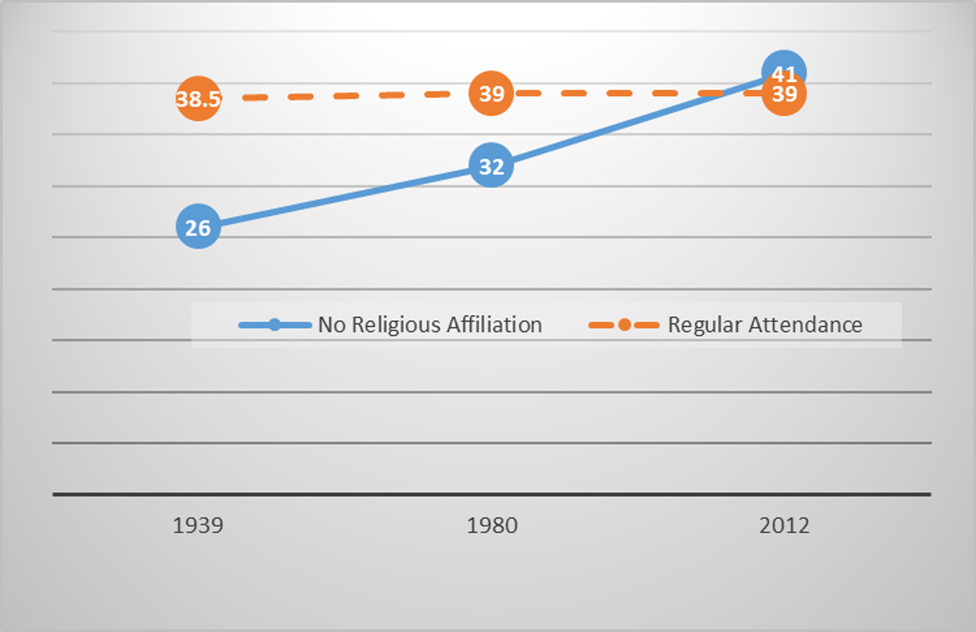
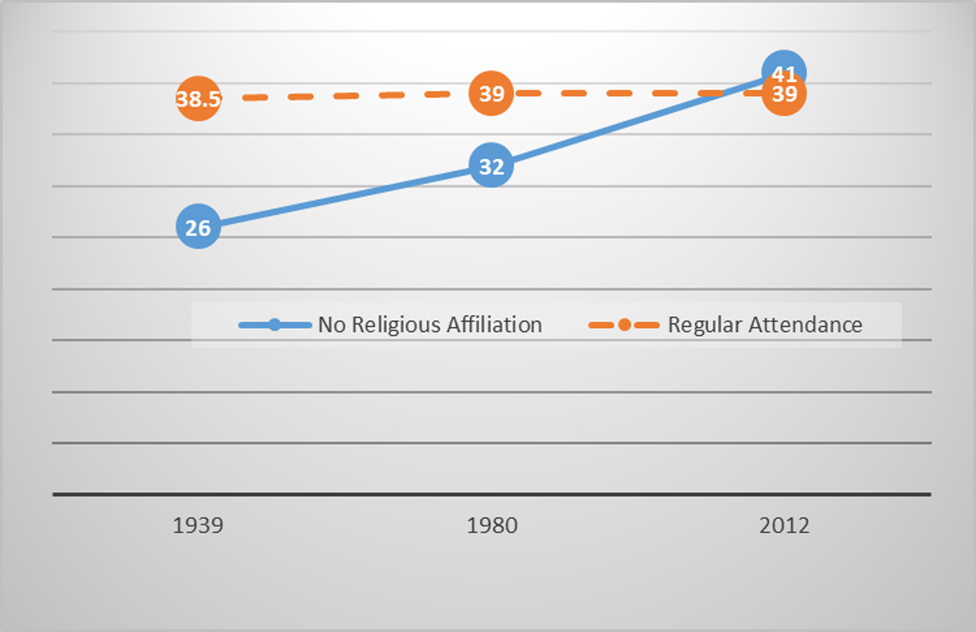
As early as February 1939, the Gallup Poll asked Americans whether they had attended church last Sunday. The proportion saying yes came to 38.5%—barely half of those professing membership in a church in 1937. However hard a measure of religious affiliation the question about church membership may be, it rounds up a good many people who missed church last week or even last month. Whereas regular churchgoers outnumbered non-members in 1939, they were eclipsed by the latter in 2012 (figure 5).
No Religious Affiliation vs. Attendance of Services, 1939-2012 (Percent)
Gallup Poll. February 24-March 2, 1939 (#149A, #149B), N= 3,000 (app.); December 5-8, 1980 (#1166G), N=1,549; June 7-10, 2012 (#G201208), N=1,004.
A more finely grained measure of church attendance introduced by the ANES surveys in 1952 probed attendance of religious services by offering four options: regularly, often, seldom, and never. Four in 10 professed regular attendance then and throughout the 1960s, matching the Gallup estimate for attendance last Sunday (or the last seven days in later polls). Fewer than 2 in 10 checked “often,” which would leave quite a few self-professed “church members” attending services seldom or never.
In fact, a lot fewer people than indicated by those numbers actually may be attending church. It is well established that surveys overstate church attendance at least moderately, if not grossly (Smith Reference Smith1998). This is not only due to the tendency of respondents to give a socially desirable response but also to the overrepresentation of churchgoers in polls because they are easier to reach. These same factors, of course, may also inflate church membership as probed by the Gallup question. Be that as it may, the bottom line is clear: regular attendees of religious services make up only a fraction of those professing to be members. Many who claim membership in a church show up only occasionally, if ever. What they admit is more a virtual membership that entails little or no active participation. While the church membership question looks like a harder test of religion than a question about one’s religious identity, all it apparently does is eliminate those who, for all practical purposes, have left the church they were brought up in. Turning now from matters of church to those of state, what is the political makeup of Americans who do not claim membership in a church?
THE POLITICS OF THE NONES
The first glimpse of the politics of the Nones can be caught in a 1936 article in the Washington Post. It was about a poll conducted, no surprise, by the Gallup Organization. It inquired how members of the various religious faiths planned to vote in the upcoming presidential election (Gallup Reference Gallup1936). Footnote 7 The headline of the story announced that Roosevelt received his strongest support from Catholics and Jews, whereas Episcopalians, members of his own faith, were against him.Footnote 8 The 1936 poll report was a flash of lightning that illuminated the partisan contours of the religious landscape: Catholics tended to vote for Democrats, whereas Protestants outside the South, regardless of their specific congregation, favored Republicans. That was not so much a matter of theological doctrine, however, as of tribal loyalty. Areas with a heavy concentration of Americans of Irish and Italian descent, who also happened to be Catholic, disproportionately favored Democratic candidates with their votes (Burner Reference Burner1986). The Protestant/Catholic vote divide was also evident in the first election study to be conducted in a single county, in 1940 (Lazarsfeld, Berelson, and Gaudet Reference Lazarsfeld, Berelson and Gaudet1948). That division was also imprinted on party identification, as probed by Gallup Polls, in the national electorate at that time (Ladd and Hadley Reference Ladd and Hadley1978, 46–53; Norpoth Reference Norpoth2018, 125–27).
As for Americans without a religious affiliation, the 1936 poll story contained a revelation tucked away down near its end: nonchurch members preferred Roosevelt over Landon. In fact, they happened to do so by a much wider margin (+12) than did church members, regardless of the latter’s specific faith (+2). Hence Roosevelt owed nonreligious Americans a special debt for his landslide victory in 1936 (which was not the headline of this story).
Was their strong preference for FDR a hint that, when it comes to party identification, Americans without a church generally gravitate to the Democratic rather than the Republican side? This proposition may seem especially compelling in the age of the Religious Right. As an alternative, one may surmise that Americans without a religious affiliation are the kind of voters who also lack a partisan affiliation. They are simply not the joining type; they prefer to be Independents in matters of church and state.
Between 1980 and 2012, Republicans overtook the Democrats as the favorite of Americans with a religious tie; they have maintained that lead in the 2016 ANES among those who attend church at least a few times a year.
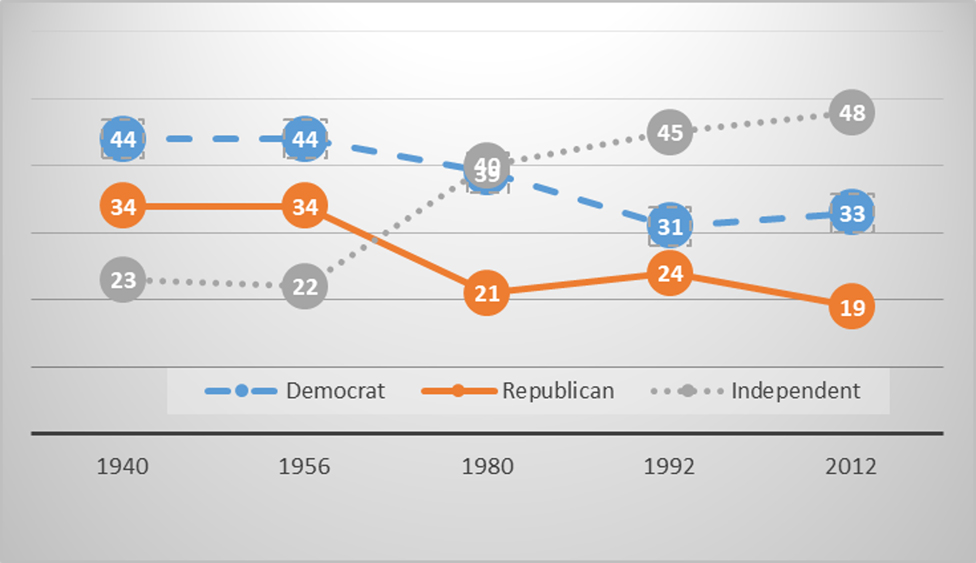
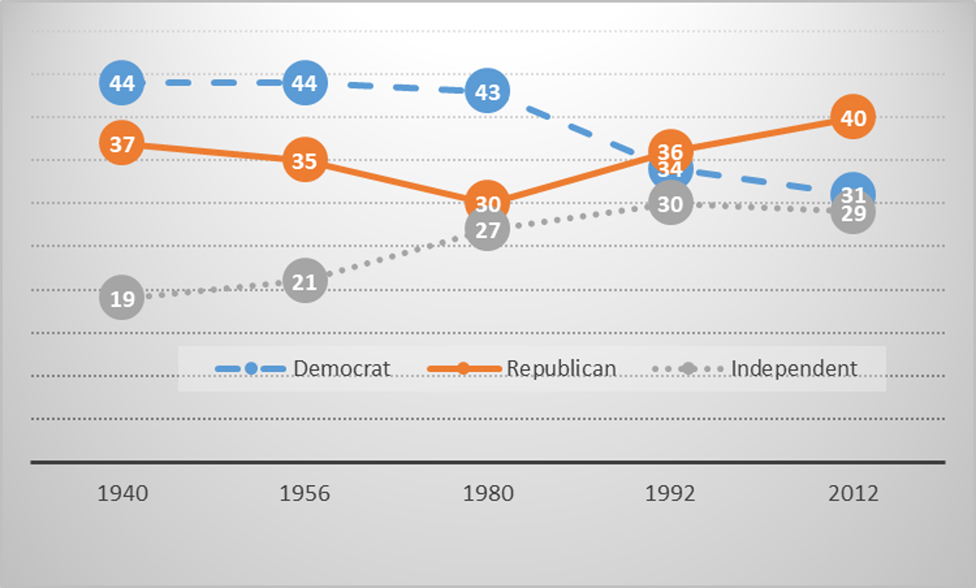
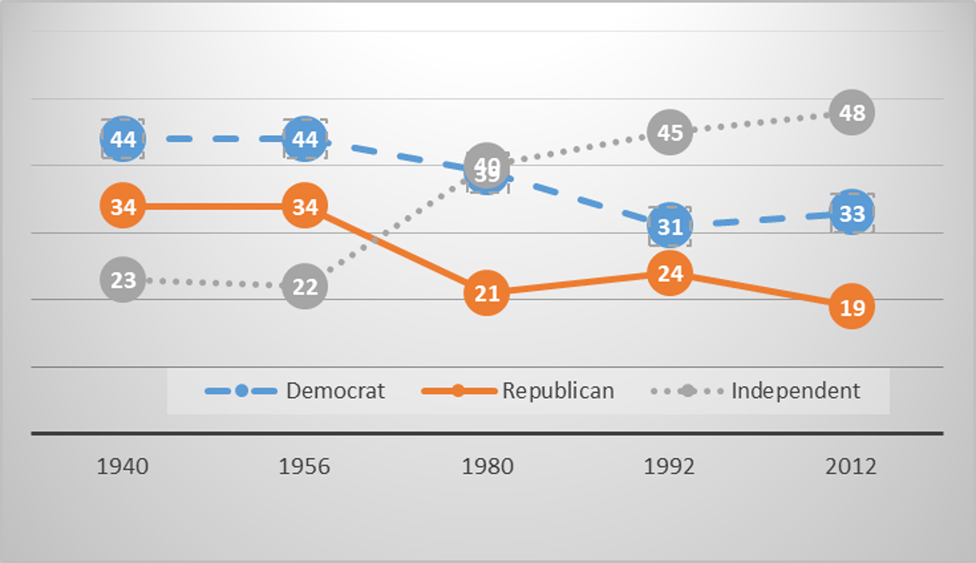
Both propositions pass the test in 2012. In the Gallup Poll that year, close to a majority (48% in figure 6) of Americans without a church also professed having no party to align with. At the same time, it turns out that those who do identify with a party have a decided party preference: Democrats outnumber Republicans by close to a 2–1 margin. Both of those findings are confirmed by the 2016 ANES data on religious affiliation. This is quite a change, however, from the configuration in 1940, the first time a poll sheds light on the party identification of Americans without a church. That year the vast majority of them embraced one of the major parties, rather than being Independent, although Democrats had a slight edge over Republicans. By 1980, however, about 4 in 10 Americans without a church affiliation eschewed one with a political party. The disengagement from political parties fits the pattern of partisan dealignment of the American electorate at that time (Lewis-Beck et al. Reference Lewis-Beck, Jacoby, Norpoth and Weisberg2008; Nie, Verba, and Petrocik Reference Nie, Verba and Petrocik1974). It is also visible among Americans with a religious affiliation (figure 7), but Independents fall way short of rising to the top in that group.
Party Identification of Americans Without Religious Affiliation, 1940-2012 (Percent)
Gallup Poll. September 5-10, 1940 (#209), N=3,230; October 18-23, 1956 (#573), N=2,175; December 5-8, 1980 (#1166G), N=1,549; November 20-22, 1992 (#G322034), N=1,007; June 7-10, 2012 (#G201208), N=1,004.
Party Identification of Americans With a Religious Affiliation, 1940-2012 (Percent)
Gallup Poll. September 5-10, 1940 (#209), N=3,230; October 18-23, 1956 (#573), N=2,175; December 5-8, 1980 (#1166G), N=1,549; November 20-22, 1992 (#G322034), N=1,007; June 7-10, 2012 (#G201208), N=1,004.
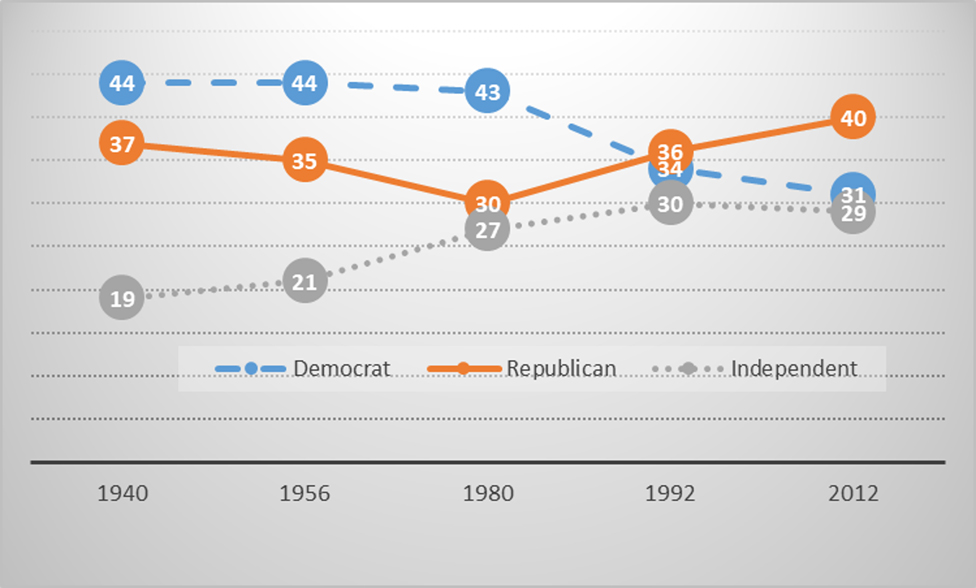
The big story about the recent partisanship of religious America is the GOP’s rise to dominance. Between 1980 and 2012, Republicans overtook the Democrats as the favorite of Americans with a religious tie; they have maintained that lead in the 2016 ANES among those who attend church at least a few times a year. Without much doubt, this is the partisan offshoot of the rise of the Religious Right (Layman Reference Layman2001; Martin Reference Martin1996; Putnam and Campbell Reference Putnam and Campbell2010; Wilcox and Larson Reference Wilcox and Larson2006; Williams Reference Williams2010). As one of those studies pointedly put it, “The Republicans’ embrace of moral traditionalism—as well as the explicit use of religious symbolism and language while doing so—has enabled the GOP to cultivate a brand label as the party friendly to religion” (Putnam and Campbell Reference Putnam and Campbell2010, 400).
In recent presidential elections, evangelicals rallied to Republican presidential candidates Romney and Trump by better than 3–1 margins (Pew Research Center 2016). It is not an unmitigated blessing, however, for the GOP, because the Nones rallied to Democratic presidential candidates Obama and Clinton by similar margins. The risk of attracting some voters by championing a religious agenda, not surprisingly, is that doing so repels others. Among Americans without a church, GOP support slid below 20% by 2012. What is more, the close association of that party with religion is one of the sparks igniting the disassociation from religion that exceeded the 40% mark by 2012. It is bothering some Democrats enough to make them give up their religion altogether (Campbell et al. Reference Campbell, Layman, Green and Sumaktoyo2018) and to prompt even some Republicans to exit their congregations (Djupe, Neiheisel, and Sokhey Reference Djupe, Neilheisel and Sokhey2017). And at critical junctures of the life cycle, particularly the child-raising stage, partisanship has been shown to guide religious choices (Margolis Reference Margolis2017).
Whichever way the relationship between religion and partisanship may run, one thing is clear: ever since surveys began tracking church membership in the 1930s, the largest denomination in America has been None. One may wonder how devoted Americans were to religion long before polling shed light on religious affiliation. In particular, how many of the Founding Fathers would have said yes in response to the Gallup question, “Are you a member of a church?” Fewer than the one-fourth of Americans in the 1930s? More than the four-tenths of today? If they did, the best known—Franklin, Washington, Adams, Jefferson, Madison, and Monroe—would have picked a denomination that does not appear in any figure in this article: Deism (Holmes Reference Holmes2006, 50–51). It was in that spirit that the First Amendment of the Constitution, barring the “establishment of religion,” was adopted, guaranteeing religious freedom including the freedom from any religion.