Political participation is vital to the health of democratic society. Political participation provides benefits to both individuals, through the development of civic skills, and communities by creating norms, networks, and social trust. Political participation also helps mediate conflicts between individuals and groups (Schlozman Reference Schlozman, Katznelson and Milner2002; Schlozman, Verba, and Brady Reference Schlozman, Verba, Brady, Skocpol and Fiorina1999).
Our knowledge about political participation is derived primarily from survey research. Surveys provide a wealth of information about the frequency of political participation—particularly the decision to vote. Surveys, however, cannot address the full range of voluntary political participation activities. These voluntary actions have “the intent or effect of influencing government action, either by directly affecting the making or implementation of public policy or indirectly by influencing the selection of people who make those policies” (Schlozman Reference Schlozman, Katznelson and Milner2002, 434).
Letters to the editor represent a unique opportunity to study voluntary political participation—one where people give rich and detailed explanations for what they believe and why they believe it. In addition to providing information about the content of political participation, the political reach of letters to the editor makes them important objects of study. Given the impact of the media on public opinion (Iyengar and Kinder Reference Iyengar and Kinder1987), the fact that politicians often use the media to understand public opinion (Herbst Reference Herbst1998), and the increasing number of letters received by newspapers (Hynds Reference Hynds1994), we need to know more about the content of letters to the editor and the characteristics of the people who write them.
In this paper, we rely on a sample of 1,415 letters to determine the content of letters to the editor. We then match the names and residence of letter writers to information contained in a state voterfile to determine more about who writes letters to the editor. Finally, we model the predictors of letter content to determine whether individual characteristics affect the political issues that appear in letters to the editor.
WHAT WE KNOW ABOUT LETTERS TO THE EDITOR
Letters to the editor represent an expressive form of voluntary participation. Habermas and others note that letters to the editor represent a unique place in the public sphere where a diversity of opinions should be represented (Habermas Reference Habermas1989; Gans Reference Gans2003). In fact, newspaper editors believe that letters to the editor are one of the best read and most important parts of the newspaper. In 1992, 99% of editors said that the editorial page was a forum for exchange of information and opinion, 52% of editors ranked letters to the editor as the best-read items on the editorial page, and about half of all newspaper readers read letters to the editor (Hynds Reference Hynds1994). Editors believe that editorial pages provide “information, analyses, benchmarks, and public forums to assist readers in making decisions and taking actions on issues” (Hynds Reference Hynds1994, 573). Editors are also impressed with the sheer volume of letters. As early as 1976, the Associated Press managing editors estimated that letters to the editor included over two million separate expressions of opinion. By the early 1990s, almost three-fourths of newspapers claimed to receive 5,000 or more letters per year (Hynds Reference Hynds1991). Recent calls for public journalism and other movements urging newspapers to focus on community needs and opinions suggest that letters to the editor will only become more important in the coming years (Wahl-Jorgensen Reference Wahl-Jorgensen2002).
Although anyone is free to submit a letter to the editor, newspapers impose a few restrictions before a letter can be published. For example, most newspapers require that the author's names be printed with the letter. In addition, most newspapers restrict length and require that the writer allow the letter to be edited. Some newspapers even restrict the number of letters that may be sent by any individual reader (Hynds Reference Hynds1994). Letter acceptance rates range from very low levels at prestigious national newspapers such as the New York Times (less than 6% as of 1991) to almost uniform acceptance at many small, local papers (Wahl-Jorgensen Reference Wahl-Jorgensen2002).
There is also some evidence that letters to the editor play an instrumental role in the democratic system and that some politicians pay attention to their content. For example, Barry Goldwater may have based his platform on the conservative content of letters to the editor (Converse, Clausen, and Miller Reference Converse, Clausen and Miller1965; Volgy et al. Reference Volgy, Krigbaum, Langan and Moshier1977). Interest groups ranging from the National Education Association to the Quaker lobby to the National Humane Society recognize the importance of letters as a low-cost means of swaying politicians and the public by instructing their members in how to write effective letters.
Apart from an early article using letters to the editor as a proxy for political propaganda (Foster and Friedrich Reference Foster and Friedrich1937), most of the research on this topic has focused on whether letters to the editor are accurate representations of public opinion. Not surprisingly, there is some research indicating that letters to the editor may not reflect the will of the people. One study concludes that letters to the editor were “hazy reflections of public opinion” (Grey and Brown Reference Grey and Brown1970, 450) and another finds that local parties were “highly influential in shaping the contents of letters pages as part of their broader media based campaign strategy” (Richardson and Franklin Reference Richardson and Franklin2004, 459). Converse, Clausen, and Miller (Reference Converse, Clausen and Miller1965) conclude that the viewpoints in letters to the editor are more conservative than mass opinion at large. Alternately, Hill (Reference Hill1981) and Sigelman and Walkosz (Reference Sigelman and Walkosz1992) find that letters to the editor are often fairly representative—particularly on highly salient issues when there are a number of potential publication outlets.
How do the characteristics of letter writers compare to the traits of other political participants? Studies have shown that socioeconomic status (income, occupation, and education) has a significant influence on political participation (Verba and Nie Reference Verba and Nie1972; Wolfinger and Rosenstone Reference Wolfinger and Rosenstone1980). We also know that men participate more than women, whites participate more than African Americans and Latinos, and that middle-age citizens participate more than the young or the elderly (Schlozman Reference Schlozman, Katznelson and Milner2002). Studies on letter writers themselves are sparse, but a few scholars have asked editors what they believe about letters-to-the-editor readers. The editors indicated that the number of letter writers is increasing and although both male and female readers are represented in letters to the editor, there is some evidence that male readers may make up the majority of letter writers (Hynds Reference Hynds1991).
Given the importance of voluntary participation for our democratic system and our lack of knowledge about the content of letters to the editor and the people who write them, our study focuses on three important but unanswered questions. What is the content of letters to the editor? What are the characteristics of the people who write letters to the editor? Do individual demographic characteristics explain letter content?
DATA AND METHODS
To investigate these questions we rely on a content analysis of letters to the editor in the eight largest North Carolina newspapers. Details on the sample are presented in Table 1.
Papers in the Sample

After identifying the newspapers, we then selected which letters to code. Rather than relying on a particular week, which could bias our sample towards issues that were of interest during that week, we created four randomly constructed weeks—one each from 2002, 2003, 2004, and 2005. For each day of the week, we generated a random number between 1 and 52. For example, if a 26 was selected for Sunday we would code all letters written on the twenty-sixth Sunday of the year. We then repeated the process for the second, third, and fourth year, producing four randomly generated weeks.
To ensure that our data are reliable, one individual coded all letters and a second individual coded a random sample of 10% of our original 1,415 letters. The percent agreement on each item coded range from a low of 71% to a high of 100% with a mean of 94%—well within acceptable ranges. We also computed a Cohen's Kappa for each item. The Kappa, which is “based on the difference between how much agreement is actually present compared to how much agreement would be expected to be present by chance alone,” can range from below 0 to 1 with any Kappa above 0.4 reaching the level of “moderate agreement” (Viera and Garrett Reference Viera and Garrett2005, 361). In our sample, all items where there were enough cases achieved at least a moderate level of agreement (p < 0.01). The average Kappa was 0.61, falling within the substantial agreement portion of the scale. Taken together, the relatively high percent agreement score and the strong Cohen's Kappa support our contention that our data are reliable.
While we only rely on newspapers from North Carolina, we believe that this study has reasonable external validity. As Nicholson-Crotty and Meier (Reference Nicholson-Crotty and Meier2002) argue, single-state studies often provide a useful way to study political phenomena. For our purposes, using just North Carolina newspapers enables us to hold many of the issues constant—issues that could vary widely if we were to sample from different states. North Carolina is also advantageous because it is in many ways an average state. It falls near the middle of the 50 states in racial makeup, economic well being, and education (Cooper and Knotts Reference Cooper, Knotts, Cooper and Knotts2008). North Carolina also contains a number of media markets—each of which has unique characteristics. Rather than being dominated by one newspaper (such as Georgia with the Atlanta Journal-Constitution), North Carolina contains a number of important papers—each in distinct regions of the state (Guillory Reference Guillory, Cooper and Knotts2008).
In addition to the content analysis, we use the North Carolina voterfile to learn more about the people who write letters to the editor. Although the voterfile only lists people who are registered voters, the voterfile contains valuable information, including race, age, the date a person registered to vote, party affiliation, and voter history. To match letter content to individual voter records we compared the names and city of residence of our letter writers to information in the voterfile. We found complete matches for over 800 of the 1,415 letter writers.
Before continuing, we should make a couple of cautionary notes about this matching process. First, not all letter writers are registered to vote so we are not able to match every individual to voterfile data. Second, it is much easier to match individuals with unique names than individuals with common first and last names from populous cities. Locating voterfile information for a letter writer named John Smith of Charlotte is nearly impossible given the number of people in Charlotte with that first and last name. In cases where we have a number of potential matches, we recorded as much common information as possible. For instance, if information in the voterfile indicated that all of the John Smith's in Charlotte were Democratic men we would tag this record with these traits. Finally, 47 people in our sample wrote more than one letter. Because we are interested in the content of letters that people read, however, our unit of analysis is the letter and these multiple letter writers remain in the sample as separate observations. For instance, if Todd Sides of Sylva, North Carolina, wrote two letters to the editor—one on environmental policy and one about national defense, we would code each letter separately, treating each as a different case.
THE CONTENT OF LETTERS TO THE EDITOR
We analyzed the content of letters to the editor based on a number of different characteristics including what level of government they discuss and what policy issues they mention. We found that a plurality (49%) of letters addressed national politics, while local politics were the primary focus of 34% of the letters and state politics made up the remaining 17%. Less coverage of state politics is not by itself noteworthy, but the extent to which state politics are underrepresented is striking. Nevertheless, this finding fits with literature suggesting that the number of journalists who cover state politics has decreased (Layton and Dorrah Reference Layton and Dorrah2002), that state politics coverage receives less media attention than national politics (Graber Reference Graber1989), and that people have relatively low levels of knowledge about state politics (Delli Carpini and Keeter Reference Delli Carpini and Keeter1996).
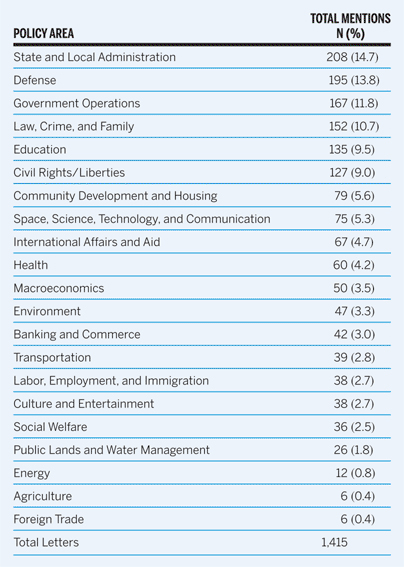
Next, we coded each letter for the specific policy issue that was addressed. To come up with a representative and tested list of issues, we relied on policy issues from the Policy Agendas Project (Baumgartner and Jones Reference Baumgartner and Jones2002; Reference Baumgartner and Jones2005). This list includes 21 issues representing a wide variety of policy areas. By coding each of the letters using this rubric, we see clear patterns in the types of letters that appear in our sample of newspapers. Table 2 contains a list of each issue, along with the total number of times it is mentioned. We coded up to three different policy areas in each letter. For instance, a March 9, 2005, letter in the Fayetteville Observer references the air quality problem in the Fayetteville and urges county government to require stricter annual emissions on cars. This letter was coded for both environmental policy and state and local administration.
Policy Areas Mentioned in Letters

The top-five issues, based on total mentions, are state and local administration (mentioned in 14.7% of letters); defense (13.8%); government operations (11.8%); law, crime, and family issues (10.7%); and education (9.5%). The bottom-five issues mentioned were social welfare (2.5%), public lands and water management (1.8%), energy (0.8%), agriculture (0.4%), and foreign trade (0.4%).Footnote 1
We also coded the letters for ideology. As an example, a December 1, 2002, letter in the Winston-Salem Journal refers to the United States government as Orwellian and says that George W. Bush is willing to burn the U.S. Constitution to protect the interests of big oil. This letter was coded as liberal. An example of a conservative letter appears in the April 16, 2005, edition of the Asheville Citizen-Times. The letter writer challenges the editorial board's “liberal bias” and advocates drilling for oil in the Arctic National Wildlife Refuge. Of the letters that could be coded for ideology, 42% are liberal, 46% represent a conservative point of view, and 12% are moderate. These data suggest that there appears to be a relatively even balance between liberal and conservative letters published. However, the result is somewhat surprising given that all of our papers come from North Carolina, a relatively conservative state. According to the CNN 2004 exit poll from the November election, 40% of North Carolinians classify themselves as conservative and only 17% self identify as liberals. Perhaps editors strive to print roughly equal numbers of liberal and conservative letters. These findings contrast early work that finds a slight conservative slant (Converse, Clausen, and Miller Reference Converse, Clausen and Miller1965), but is fairly consistent with more recent works that generally find a fairly even distribution of printed letters. A specific political party is mentioned in 7% of letters.
We also coded letters as either negative or positive. A good example of a letter coded as negative appears in the December 16, 2003, edition of the Durham Herald-Sun. The writer takes issue with a previous letter about the potential death toll of the pandemic flu, arguing that “the artificial prolongation, of life, regardless of disability or suffering, goes against God's plan of using natural enemies to keep a population strong and under control.” An example of a letter coded as positive appears in the September 16, 2004, Raleigh News and Observer. Entitled “Duty accomplished,” the letter discusses George W. Bush's military record in glowing terms. Overall, we find that the majority of letters to the editor are negative—69% were coded as negative and only 31% were positive.
About 37% of letters mention a political figure. Of those, the vast majority refer to elected officials. George W. Bush was mentioned far more than anyone else—more than 35% of the letters that mention a politician mentioned Bush. John Kerry, John Edwards, and Bill Clinton are mentioned the next most frequently.
Interestingly, some letters to the editor were sparked by previous letters, or articles that have recently appeared in the newspaper. About 16% of letters refer to another letter, another 24% refer to an editorial or cartoon, and about 24% refer to another article.
WHO WRITES LETTERS TO THE EDITOR?
In addition to knowing very little about the content of letters to the editor, we know even less about the people who write them. By matching letter writers to voterfile information, we were able to identify the age of 816 of the letter writers. We identified letter writers ranging from 18 to 94 years old. Because we relied on a voterfile to identify letter writers we could not match an age to anyone under 18, although we suspect that very few letter writers are below 18.Footnote 2 The average age was 55 with a standard deviation of 15. These findings are consistent with political science literature concluding that older people are more likely to participate in politics (Rosenstone and Hansen Reference Rosenstone and Hansen1993). Nonetheless, with an average age of 55 and 68% of the distribution between 40 and 70, it appears that a disproportionate number of older residents engage in this political activity.
We used two different techniques to identify the gender of letter writers. First, we coded letter writers as male or female based on the writer's first name. Using this strategy we find that 67% of the letters published are by males. Our second technique for identifying gender was to match letter writers to voterfile information. Using this method we find that 68% are males. No matter the measure, women are clearly underrepresented on North Carolina's editorial pages.
We also determined the partisan identification of letter writers using voterfile data. We identified the partisanship of 878 letter writers and found that of the letters published, Democrats wrote 42%, Republicans 36%, and unaffiliated voters wrote 29%. These numbers are remarkably similar to the percentages in the North Carolina population (45% Democratic, 35% Republic, and 20% unaffiliated).
Much like other forms of voluntary political participation, whites wrote an overwhelmingly high percentage (95%) of published letters. This number is quite surprising given that 20% of registered voters in North Carolina are black. African Americans, much like women, are dramatically underrepresented on North Carolina editorial pages.
Our data also reveal that over 90% of letter writers whom we identified as registered to vote actually voted in the 2004 general election. In addition, surprisingly few letter writers were natives of North Carolina. Although 63% of current residents were born in North Carolina, we found that only 24% of published letters were written by natives of the Tar Heel state. Based on the residence information included at the bottom of each letter, we found that 99% of letters were written by current North Carolina residents. Taken together, these findings about letter writers are strikingly similar to those reported when Pasternack (Reference Pasternack1979) found that “the typical letter writer was male, over 50, had a college degree, earned more than $15,000 a year, and had lived in his current community for more than 15 years” (quoted in Hynds Reference Hynds1991, 125).
EXPLAINING LETTER CONTENT
Next, we report the results from a series of models that explain how personal characteristics affect the content of letters to the editor. Our first set of dependent variables represents whether a letter discusses a particular issue area. We selected the five most common issue areas and coded a letter as 1 if the issue is mentioned and 0 if the issue is not mentioned. Our models included variables for age, gender, whether a person is a native of North Carolina, and partisanship. Each model, presented in Table 3, includes two columns. The first column presents the coefficients, the robust standard errors, and an indication of statistical significance. The second column for each model presents the predicted probabilities for the low and high values of each significant nominal level independent variable (Male, Native NC, and Republican) and the value at one standard deviation below and above the mean for age. For all predicted probabilities, we hold all other variables at their sample mean or mode.
Logit Models Predicting Top-Five Policy Areas Mentioned in Letters

Notes: (SE) represents robust standard errors clustered on the newspaper.
Predicted probabilities for nominal variables (Male, Native NC, and Republican) represent the probability of the minimum and maximum values for that variable, holding all other values at their means or modes. For Age, the predicted probabilities represent the probability when moving from one standard deviation below the mean to one standard deviation above the mean.
*** p < 0.01,
** p < 0.05,
* p < 0.1 (two-tailed test)
We also found that younger people were more likely to write letters about law, crime, and family issues and about education issues. In fact, a 40 year old (one standard deviation below the mean) has a 0.09 probability of writing a letter about either issue, compared to a 0.06 probability for a 70 year old (one standard deviation above the mean). Men were more likely to write letters about defense issues (0.17 vs. 0.13) while women were more likely to write letters about law, crime, and family (0.10 vs. 0.07). These findings fit well with literature on the gender gap in the electorate and research on women in elected office, which suggests that female legislators propose and pass different types of policies than men (Thomas Reference Thomas1994).
We also find that native North Carolinians and Republicans were more likely to write letters about law, crime, and family. The substantive significance for partisanship is particularly striking as a Republican has a 0.20 probability of writing a letter about law, crime, and family, compared to a 0.10 probability for a non-Republican.
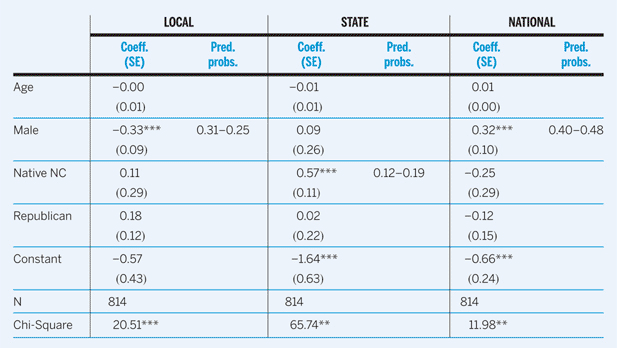
Table 4 presents the logit results predicting letters that address national, state, and local issues. Men are more likely to write letters about national issues and women are more likely to write letters about local issues. The predicted probabilities for local issues are 0.31 for women and 0.25 for men. For national issues, the probabilities are 0.40 for women and 0.48 for men. Not surprisingly, native North Carolinians are more likely to write letters about state issues.
Logit Models Predicting Presence of Local, State, and National Issues in Letters

Notes: (SE) represents robust standard errors clustered on the newspaper.
Predicted probabilities for nominal variables (Male, Native NC, and Republican) represent the probability of the minimum and maximum values for that variable, holding all other values at their means or modes. For Age, the predicted probabilities represent the probability when moving from one standard deviation below the mean to one standard deviation above the mean.
*** p < 0.01,
** p < 0.05,
* p < 0.1 (two-tailed test)
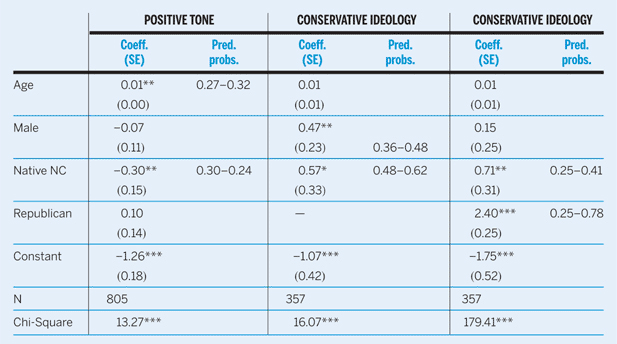
Table 5 includes logit results predicting the tone and ideology of letters. The first column suggests that older people and non-native North Carolinians are significantly more likely to write letters with a positive tone. The predicted probabilities for native status are particularly striking. A native has a 0.24 probability of writing a letter with a positive tone while a non-native has a 0.30 probability. Similarly, a 40 year old has a 0.27 probability of writing a positive letter, compared to a 0.32 probability for a 70 year old. Given the high degree of correlation between individual partisanship and letter ideology, we estimated the final model two ways—one without the partisanship variable (in the second pair of columns) and one with the partisanship variable (in the third pair of columns). In the first model, it appears that native North Carolinians are more likely to write conservative letters. In the second model, the significant effect of gender disappears, but the magnitude of the native variable is still quite high. In fact, a native North Carolinian has a 0.41 probability of writing a conservative letter, compared to a 0.25 probability for a non-native. The overrepresentation of non-native writers, coupled with their propensity to write more liberal letters might explain why the overall content of letters is not as conservative as one might believe by looking at the ideological distribution in North Carolina.
Logit Models Predicting Tone and Ideology of Letters

Notes: (SE) represents robust standard errors clustered on the newspaper.
Predicted probabilities for nominal variables (Male, Native NC, and Republican) represent the probability of the minimum and maximum values for that variable, holding all other values at their means or modes. For Age, the predicted probabilities represent the probability when moving from one standard deviation below the mean to one standard deviation above the mean.
*** p < 0.01,
** p < 0.05,
* p < 0.1 (two-tailed test)
DISCUSSION AND CONCLUSION
Voluntary political participation is vital to the health of democratic society. Letters to the editor represent an important yet understudied form of voluntary participation. They provide a venue for citizens to express their ideas and beliefs and they have the intention of influencing both citizens and political leaders.
In this paper, we investigated the content of letters, the characteristics of letter writers, and the predictors of letter content. Perhaps our most important finding concerns the scarcity of female, African American, and younger letter writers. The data clearly show that women are underrepresented and, when women do write letters, the content is significantly different than their male counterparts. As a result, this underrepresentation of women has implications not just for descriptive representation in newspapers, but for the substantive representation of women's issues as well. Women and women's groups should make a concerted effort to increase the number of women who write letters to the editor and editors should ensure that women are given fair access to editorial pages. The numbers of African American letter writers is even smaller. So small, in fact, that we do not have an adequate sample size to determine whether race affects letter content. The lack of younger letter writers reinforces recent concerns about low youth participation in politics (Wattenberg Reference Wattenberg2006). Given that we only have access to printed letters, it is impossible to determine whether this underrepresentation occurs because women, African Americans, and younger people are less likely to write letters, or because newspapers are less likely to print them. No matter the cause, this is a problem of serious concern for those who want to ensure that all voices are represented in the mainstream media.
The story is not entirely negative, however. The parity between liberal and conservative printed letters means that citizens receive a balanced view when they read editorial pages. Similarly, the consistency between Democratic, Republican, and unaffiliated letter writers and party identification in the North Carolina population more generally indicates a balance of perspectives. In North Carolina, newspapers reflect the ideological and partisan makeup of their readers.
In conclusion, our findings suggests that letters to the editor neither perfectly represent the voice of the people, nor do they appear to be heavily skewed. Although many political pundits and politicians decry the partisan media, we find little evidence of bias in letters to the editor. In the future, we hope that scholars will examine letters to the editor in other contexts and better determine the ways letters affect both mass and elite opinion. Future research should also provide more direct comparisons between the characteristics of letter writers and the traits of individuals who participate in other types of voluntary political activities. These strategies will likely lead to an even better understanding of the content of political participation in American politics. ■