Introduction
Most island populations, both developed and under-developed, have not achieved food self-sufficiency as a function of several intrinsic disadvantages: small size (in area or population), remote location, insularity, susceptibility to disaster and environmental fragility (Briguglio, Reference Briguglio1995). These disadvantages limit access to natural and social resources, e.g., water, energy and labor (ONU, 1994) that generate dependence on a narrow range of products and increase import reliance (FAO, 2016a). Additionally, transport and communications are critical issues, as a failure in either one may cause uncertainty in the timely supply of products. As an isolated volcanic island complex, the Galapagos Archipelago of Ecuador conforms to the food self-sufficiency constraints described above, with an additional consideration due to its unique ecosystem. The Galapagos Islands evolved in isolation through natural processes that produced high endemism and ecological fragility (Jackson, Reference Jackson2007). This combination of characteristics makes the archipelago a living biodiversity laboratory and a highly valued island ecosystem for nature conservation purposes. These characteristics not only illustrate the vulnerability of the Galapagos archipelago due to its ‘island condition,’ they also highlight the many forms of human—related pressures existing in the Galapagos such as invasive species (González et al., Reference González, Montes, Rodríguez and Tapia2008), immigration, community development, constrained infrastructure and changes in the local food consumption behavior that may alter importation trajectories and compromise conservation throughout the islands.
A key characteristic of the Galapagos Islands is that tourism has become the most important element of the economy during the last four decades. The rapid growth of tourism is now the main driver of change in the social, economic and environmental systems (Grenier, Reference Grenier2000; Taylor, Reference Taylor2006; Watkins and Cruz, Reference Watkins and Cruz2007). The tourism industry has stimulated a demographic explosion in the last several years, which in turn, increased the requirement for goods and services to cover basic needs and livelihood standards (Pizzitutti et al., Reference Pizzitutti, Walsh, Rindfuss, Gunter, Quiroga, Tippett and Mena2016). Current policies address the implications of a growing populations, both resident and tourist, on the increased risk to food security in the islands (Walsh and Mena, Reference Walsh and Mena2016). To help guide future plans, this paper describes the complex relationship between population growth and food consumption in the Galapagos Islands. From a food security perspective, our paper focuses on ‘supply dynamics’ such as local agriculture production and imports from the mainland.
In this paper, we first describe a food-supply system in the Galapagos that is primarily controlled by population growth, weak local agriculture and imports, and influenced indirectly by the tourism industry. We next project a series of possible scenarios for the food-supply system to 2037 to inform possible policy interventions. It is important to note that although farmers are ‘pushed’ off agricultural land due to environmental and economic restrictions, they may also be ‘pulled’ off the land to engage in tourism and other more lucrative economic enterprises. Personal preferences, demographics and local employment capacity make it both attractive and feasible for farmers in the Galapagos to pursue alternative livelihoods. Within this context, a timely analysis of the Galapagos food-supply system is important as it may mimic processes at work on other islands that experience pressure from climate change, food insecurity and increasing population growth.
Literature review/background
Food security and dynamic systems
Food security is increasingly important in oceanic islands, such as the Galapagos Archipelago. Food security is defined as the physical and economic access of people, at all times, to sufficient, safe and nutritious food that meets their dietary needs and food preferences for an active and healthy life (FAO, 1996). Among the numerous driving forces that characterize the state of food security at a local level, the most relevant issues are encapsulated within the concept of food security itself: food availability, food access, food utilization and food stability (FAO, 2016b, 2006). This deconstruction of the term allows for the holistic investigation of food security (Christos et al., Reference Christos, Naoum and Dimitrios2014) through the analysis of the different variables that compose the food security system structure. In this regard, the current research focuses on ‘food availability’ that considers the adequate supply of food and includes variables such as food production, stock levels and net trade, all highly relevant to islands.
In planning and policy making, food security has been generally examined through approaches that address individual components of the overall concept. But without an integrated and systemic approach that addresses the many links and feedback mechanisms between different aspects of the food system, several vital elements will be ignored (Hammond and Dubé, Reference Hammond and Dubé2012; Christos et al., Reference Christos, Naoum and Dimitrios2014; Guma et al., Reference Guma, Rwashana and Oyo2016). On the other hand, modeling techniques from systems science have been used as a tool to connect interrelated aspects of the same system across different disciplinary lines (Hammond and Dubé, Reference Hammond and Dubé2012). Modeling techniques explicitly examine interactions among system factors, giving powerful insights to the dynamic tendencies and behavioral patterns of the system including feedback mechanisms, thresholds and triggers, and emergent patterns discerned through a rich process description in the models (Meadows, Reference Meadows1980). In this context, the food supply structure is considered as a richly integrated and highly dynamic social-ecological system, in which ecological factors shape the possibilities for food production and social factors govern the goals and operations of actors in the system (Stave and Kopainsky, Reference Stave and Kopainsky2015).
This paper uses system dynamics (SD) as a modeling technique to identify the main driving forces operating on the Galapagos food system and to explore future scenarios across the system's structures. In terms of SD, Hammond and Dubé (Reference Hammond and Dubé2012) and Stave and Kopainsky (Reference Stave and Kopainsky2015) illustrate relations and feedbacks within the food-security framework. Other studies (Giraldo et al., Reference Giraldo, Betancur and Arango2008; Atherton and Slobodan-Simonovic, Reference Atherton and Slobodan Simonovic2013; Ayenew and Kopainsky, Reference Ayenew and Kopainsky2014; Candy et al., Reference Candy, Biggs, Larsen and Turner2015; Khodeir and Abdel-salam, Reference Khodeir and Abdel-salam2015; Monasterolo et al., Reference Monasterolo, Mollona and Pasqualino2015; Stave and Kopainsky, Reference Stave and Kopainsky2015) have presented an integrated perspective of the food system where different processes are examined and different scenarios are tested.
In the case of the Galapagos Islands, no modeling technique has been applied specifically for food-system analysis. This paper, however, is based on previous research that has used a system dynamic approach to model different aspects of the Galapagos Islands system (Espín, Reference Espín2016; Pizzitutti et al., Reference Pizzitutti, Walsh, Rindfuss, Gunter, Quiroga, Tippett and Mena2016). The goal of these past studies was to create a decision-support system to examine the tourism management of the archipelago through the analysis of the impacts of tourism and residential population growth on the environment.
The Galapagos Islands
In terms of environmental conservation value, the Galapagos Islands are arguably the best-preserved archipelago in the world. They are one of Ecuador's 24 provinces and according to INEC, the Ecuadorian government agency responsible for population and demographic studies, the total population of the islands in 2015 was of 25,244 (INEC, 2015). The island's iconic and unique flora and fauna attract a booming tourist industry that has in turn fostered rapid increases in the local resident population growth (Kerr et al., Reference Kerr, Cardenas and Hendy2004).
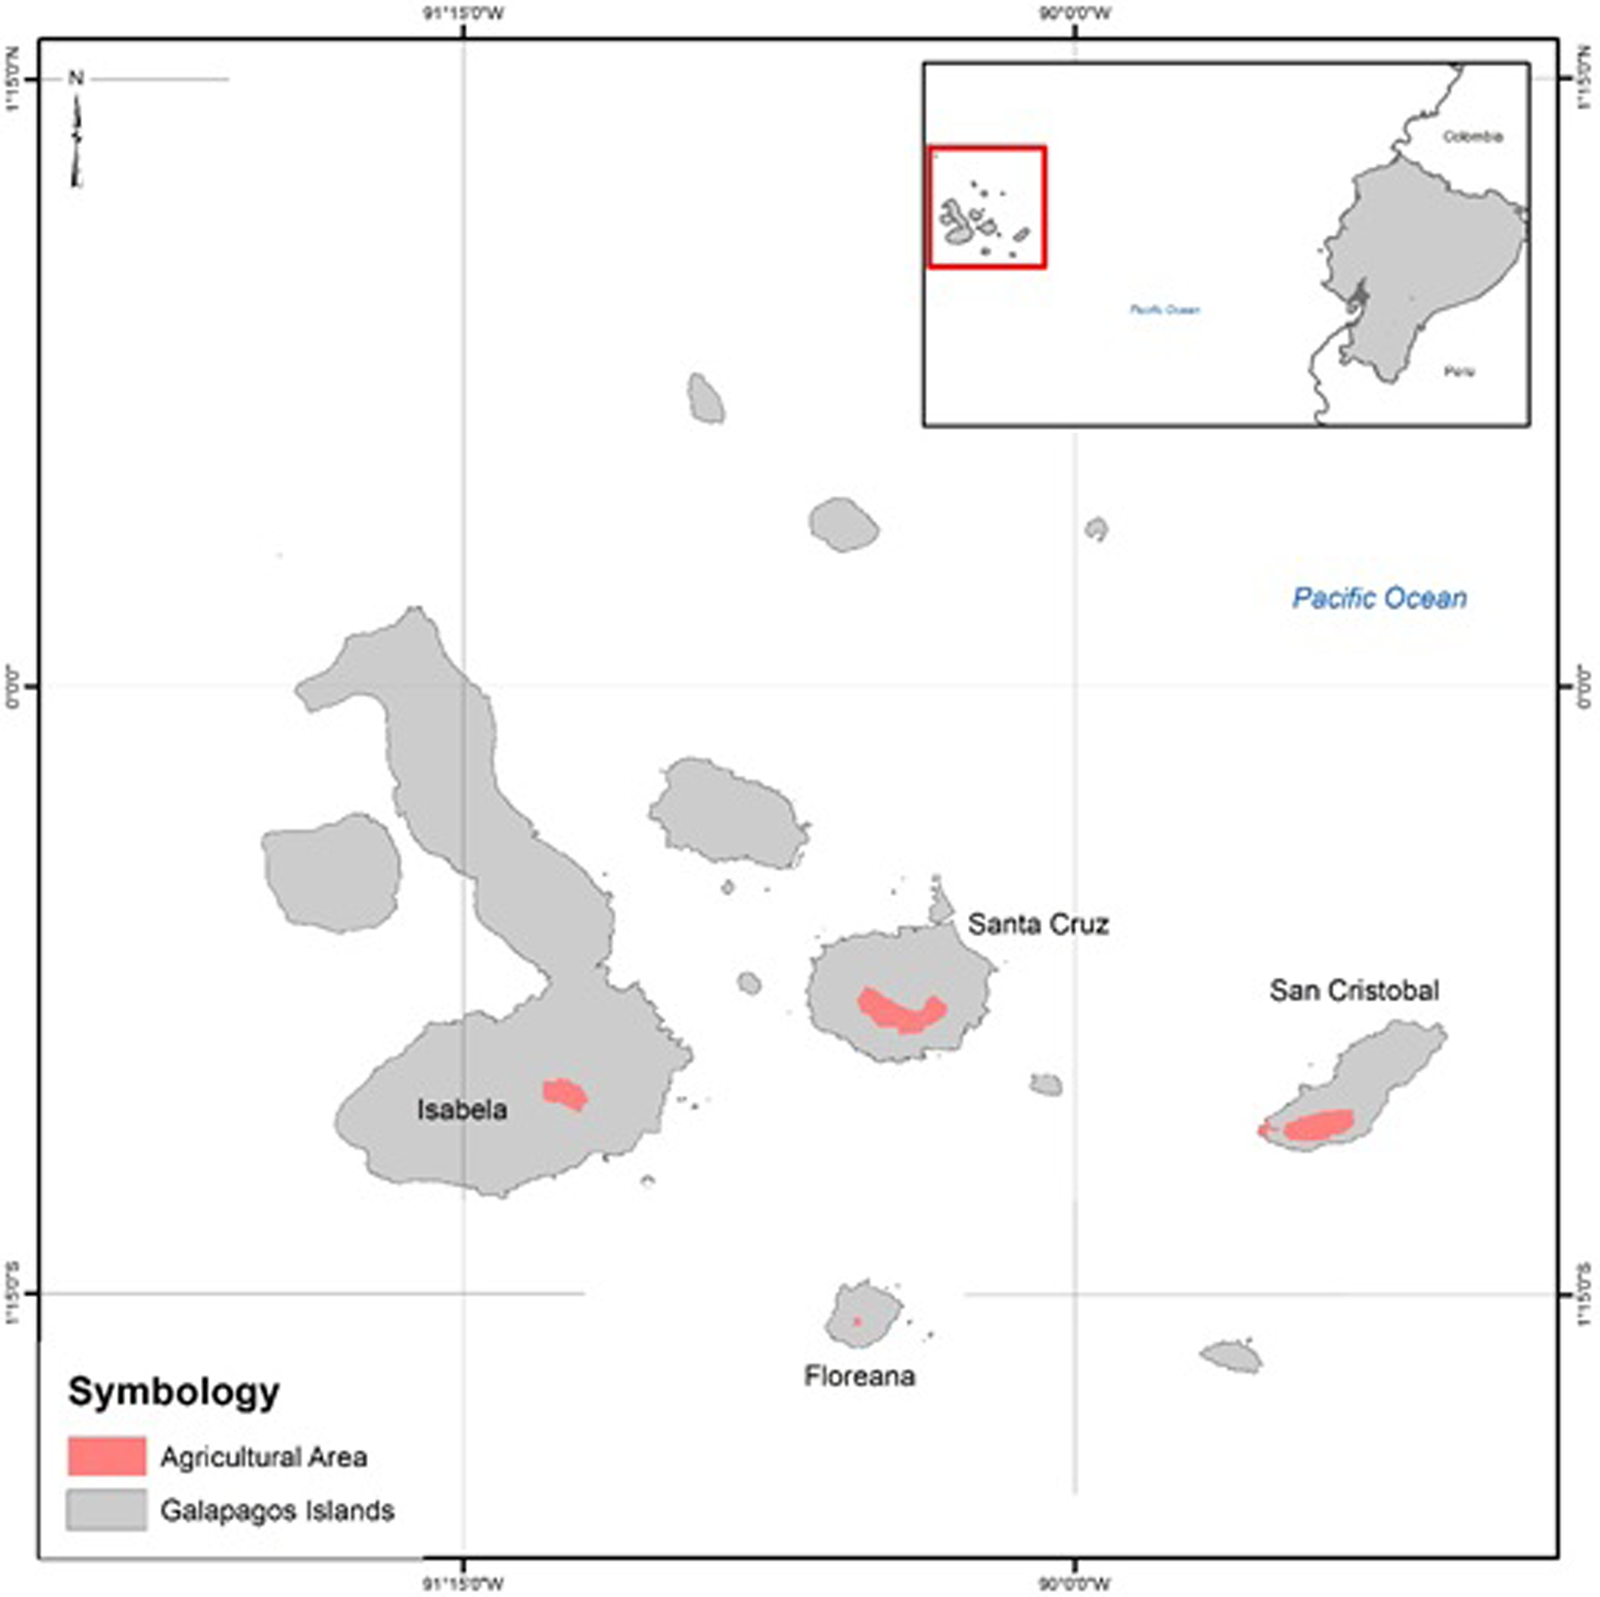
The total geographic extent of the islands is over 799,313 ha, of which only 25,059 ha are designated for agriculture and livestock activities in the defined human use zones (in this paper called agricultural areas or agricultural zones, see Fig. 1), with 9% designated for agriculture and 44% for pastures for cattle raising (Consejo de Gobierno del Régimen Especial de Galápagos, 2014).
Galapagos Islands. The four inhabited islands: Santa Cruz, San Cristobal, Isabela and Floreana, with their respective agricultural areas.

In response to the burgeoning tourist industry and the accompanying job expansion, the Galápagos is undergoing increased rural land abandonment as farmers and/or members of their households, often young adults, seek off-farm employment. The proportion of the population residing in rural areas has decreased from 42% in 1974 to 17% in 2010 (INEC, 1974, 2010). This trend has resulted in decreases in local agricultural production, reducing reliance on food produced on the island and decreasing food security. As a consequence, abandoned agricultural areas are likely to become centers of establishment and propagation of invasive plant species such as guava and blackberry (Snell et al., Reference Snell, Tye, Causton, Bensted-Smith and Bensted-Smith2002; Jäger et al., Reference Jäger, Kowarik and Tye2009) that easily invade neighboring properties including the National Park restricted area.
Data and methods
This paper models the supply side of the food system using secondary data collected from governmental and non-governmental sources. This paper uses SD to develop a data-based model, where all the relationships have been generated based on official reports, scientific literature and interviews with local experts. In this context SD also can be used as a linking tool to identify gaps and research needs within the system.
Data
Consumption
Consumption per capita for the Galapagos province was obtained from the 2014 Living Conditions Survey (LCS) (INEC, 2014). The units for consumption used in the model are tons per yr per person. For modeling purposes, it was assumed that per capita consumption was stable for the years considered.
Tourist consumption was obtained from the tourism industry through a short survey designed and validated specifically for this research. The model assumed a standard menu for all cruises providing service in the Galapagos and that the tourists on land consume the same proportions of food per day. The scenario presented here also assumes that this food consumption number will remain the same for subsequent years that are germane to this study.
The consumption data were divided into four food groups based on the production source: (G1) agricultural products that include fresh fruits and vegetables; (G2) livestock products, including meat, milk and eggs; (G3) fishery products, where all marine products are considered and (G4) processed-imported products that include all foodstuffs that are not produced in the Galapagos, referring especially to processed food. This analysis does not take G3 into consideration because of lack of good available data.
Agriculture and livestock
Information was obtained from the Agricultural Production Census of Galapagos in 1974, 2000 and 2014. These data are official information for the Galapagos Islands.
Food imports
This dataset was collected from the coastal trade statistics from the StoreOcean terminal that is responsible for most of the maritime transportation of food from Guayaquil, Ecuador to Galapagos. The Biosafety Agency of Galapagos (ABG) of the Ecuadorian Ministry of Environment provided additional data for organic food imports through air and sea transportation. Although these datasets provide the best information available on food imports for the Galapagos, they provide an incomplete picture of all food imports to the islands.
Demographic data
Local resident population data are from the Ecuador National Population Censuses from 1974, 1982, 2001, 2006 and 2010 (INEC, 1974, 1982, 2001, 2006; 2010). Tourist population data were obtained from the Galapagos Government Council (GGC) and the Galapagos National Park (GNP), which keep unique and detailed entrance data for tourists. As presented in previous dynamic models for tourism analysis (Pizzitutti et al., Reference Pizzitutti, Walsh, Rindfuss, Gunter, Quiroga, Tippett and Mena2016), different trends or future scenarios of population growth were established considering three different types of scenarios of tourism and resident population growth: (1) moderate growth, (2) accelerated growth and (3) no-tourism growth. Economic activity data were obtained from the Ecuadorian Economic Census of 2010 (INEC, 2010).
Invasive species and land abandonment
The land use and land cover maps were generated through an object-oriented classification approach using Landsat imagery acquired over the agricultural area of the four inhabited islands. Three Landsat scenes (Path/Row 17/61, 18/60 and 18/61) were acquired to cover the study area. Two reference dates, 2009 and 2016, were selected to detect the land use and land cover change in the agricultural area. The acquisition dates for the images under cloud-free conditions were 27th February, 2009 (San Cristobal), 22nd March, 2009 (Santa Cruz, Isabela and Floreana), 27th February, 2009 (San Cristobal), and 8th March, 2015 (Santa Cruz, Isabela and Floreana). The object-oriented classification was performed using e-Cognition software that consists of spatial and spectral analysis and integrates relevant properties such as shape, texture and spectral information to analyze entities on the landscape. The process is divided into two principal steps: (1) segmentation, where individual pixels are grouped with neighbors to form a significant object that is defined by scale parameters and homogeneity criteria, and (2) classification, where a hierarchical classification scheme is built to define the classes using classification rules based on membership functions. The broad categories that were classified are abandoned land, agriculture and pastures, invasive vegetation and nature vegetation. The total areas for each class served as input to the model.
Methods
Our SD model was developed based on a methodology presented by Sterman (Reference Sterman2000) that includes a three-step process: (a) formulation of the dynamic hypothesis, (b) implementation of the simulation and (c) testing and validation. System conceptualization refers to the definition of the key characteristics and limits of the system. A set of dynamic hypotheses, based on the conceptual diagram, was built and used as the baseline for the data collection and data systematization. Implementation of the model starts with a flowchart that includes key interactions of all elements in the form of mathematical equations. VenSim software was used to create the simulation that runs from 2012 until 2037, accounting for 5 yr of historical data and 20 yr of the simulated scenarios.
Model design
Figure 2 shows a theoretical structure of the dynamic system for the Galapagos food-supply system. The model assumes a state of equilibrium between supply and demand in which supply equals demand. This is the equilibrium point, where the allocation of goods is at its most efficient, because the amount of goods being supplied is the same as the amount of goods being demanded (Heakal, Reference Heakal2017). The food demand corresponds to the consumption of food by Galapagos residents and tourists. This assumption allows the estimation of the quantity of food that will be needed to be produced and imported to satisfy food requirements in the Islands. Local production influences the importation amounts, as imports must fulfill the gap between food consumption and local production.
Model hypothesis diagram.

The food stock of the islands is calculated as the sum of the local production and the imports. It corresponds to the total food availability for population consumption that is equal to food demand. In addition, the food stock also influences the amount of local food production and importation, as it may accumulate food excesses that are available for consumption and unnecessary to be fulfill.
Local production of agriculture and livestock production is defined by availability of labor, number of hectares in use and productivity rates. There is also a limit on how much agricultural land can be cultivated within the delineated agricultural zone that is surrounded by the National Park. Agricultural areas within the delineated human use zone that are not used for cultivation are likely to become centers of establishment and propagation of invasive species such as Guava and blackberry (González et al., Reference González, Montes, Rodríguez and Tapia2008).
Model components
Population module: The sub-model of population and tourism was based on an existing SD model for Galapagos (Pizzitutti et al., Reference Pizzitutti, Walsh, Rindfuss, Gunter, Quiroga, Tippett and Mena2016), where three possible scenarios of tourism growth for the next 20 yr (2013–2033) were analyzed. The first scenario corresponds to the ‘moderate growth’ scenario. It serves as the reference scenario that reproduces what would happen in Galapagos if the current tourism regime does not vary substantially over the next 20 yr. The second scenario is the ‘high growth’ or exponential growth of tourist arrivals that assumes that the number of tourists will grow following the same average annual growth rate for the next 20 yr. And the third scenario corresponds to ‘zero growth’ where tourist arrivals remain frozen in time to the level reached in 2012. These three scenarios were used to build the ‘resident’ or local population projections, assuming a direct relationship between the number of tourist arrivals and the growth in the local population.
For the identification of impacts and demands of goods and services due to the presence of tourists, a new variable was constructed based on a concept called the ‘tourists at the same time’ (Pizzitutti et al., Reference Pizzitutti, Walsh, Rindfuss, Gunter, Quiroga, Tippett and Mena2016) that addresses the average number of tourists in any day of the year in Galapagos. This number is calculated based on the average number of days a tourist stays in Galapagos and, therefore, different types of tourism are considered: boat-based vs land-based, and national vs international tourists for both previous classes. Each of the four groups presents different characteristics and length of stays. In this context, the average number of people in Galapagos corresponds to the number of residents plus the number of tourists at the same time in the islands.
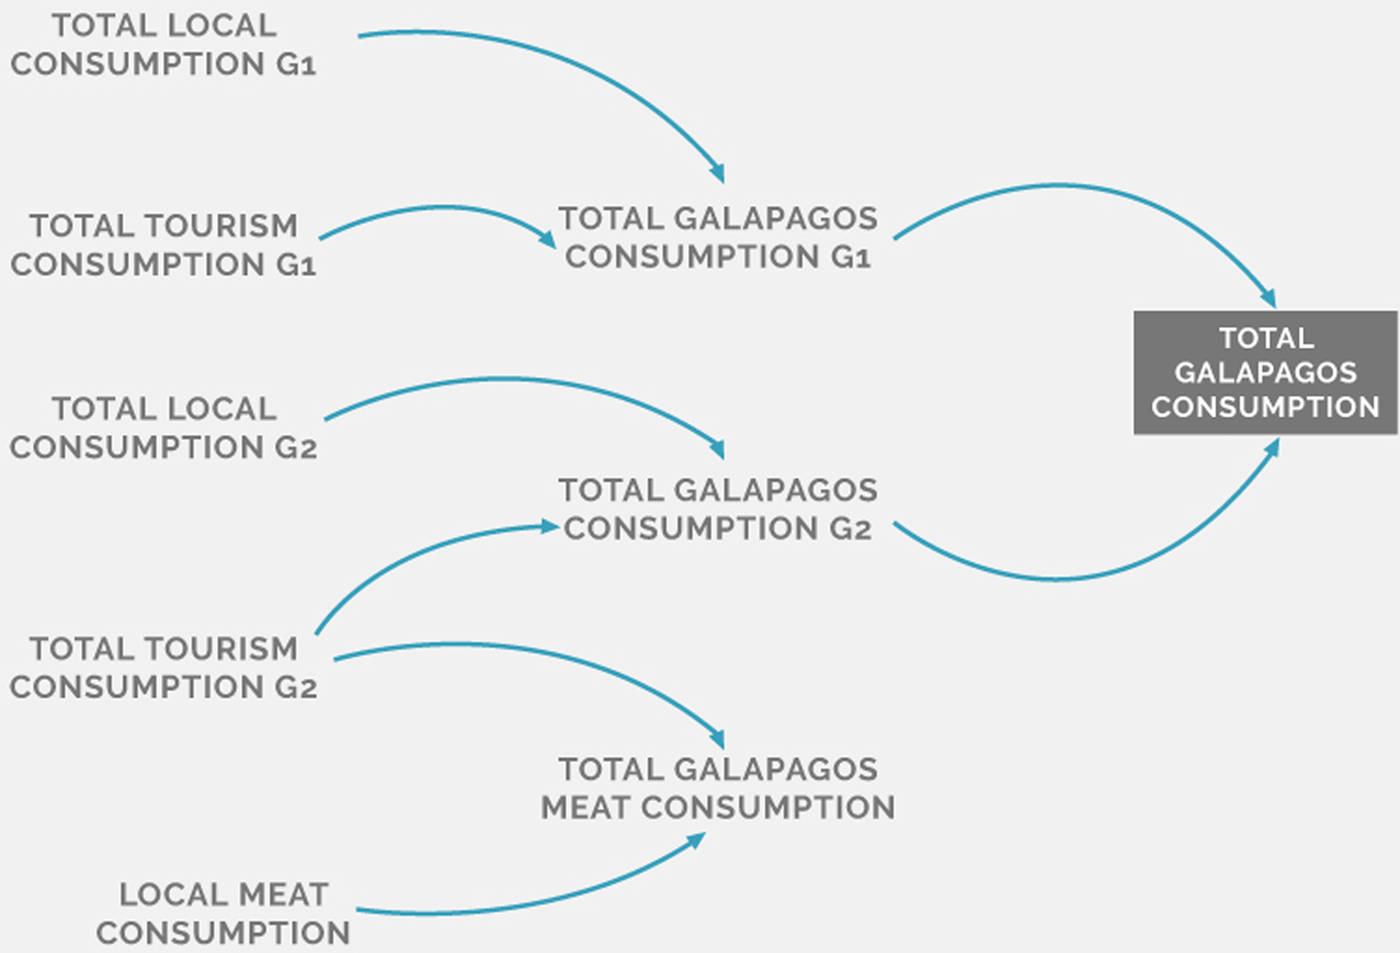
Consumption module: As previously discussed, this module assumes a state of equilibrium between the supply and the demand of food production and importation that is needed in the Galapagos. This assumption is reasonable as according to local economic data, there is no extreme poverty in the Galapagos, given that all inhabitants have monetary resources to guarantee at least the required minimum food intake (Granda et al., Reference Granda, Sandra and Calvopiña2012). Additionally, the distribution of goods among the inhabitants of the Galapagos Islands is more equitable than in the rest of Ecuador (Granda et al., Reference Granda, Sandra and Calvopiña2012). The consumption module calculates the total amount of food for the groups, G1 and G2, that is needed based on consumption patterns of local residents and tourists, see Figure 3.
Dynamic diagram from the calculation of the total consumption of agriculture products (G1) and livestock products (G2) in the Galapagos Islands.

Supply module: The model assumes no supply and demand constraints, which means that the food demanded by the Galapagos population will be fulfilled by local production or imported from the mainland. The local production follows the trends of past years and the imports are calculated as the difference between demand and local production. The food supply sub-models are comprised of agriculture production, agriculture imports, meat production, milk production and eggs production sub-models.
Agriculture production sub-module: In the Galapagos, active agricultural areas have decreased by 23% from 2000 to 2014 (Walsh and Mena, Reference Walsh and Mena2016). Nevertheless, there was an increase in productivity during the same period. While several factors influence the decrease in land devoted to agricultural production, the rapid increase of the tourism industry is one of the most important factors. As a consequence of the link between the lack of available labor and the pull of farmers into tourism to enhance their income, the number of full-time farmers has dramatically decreased (Walsh and Mena, Reference Walsh and Mena2016). Most farms are not abandoned completely; they are used by local urban residents for leisure or occasionally used for harvesting fruits and vegetables, with no large effect on local consumption patterns (INEC, 2014.)
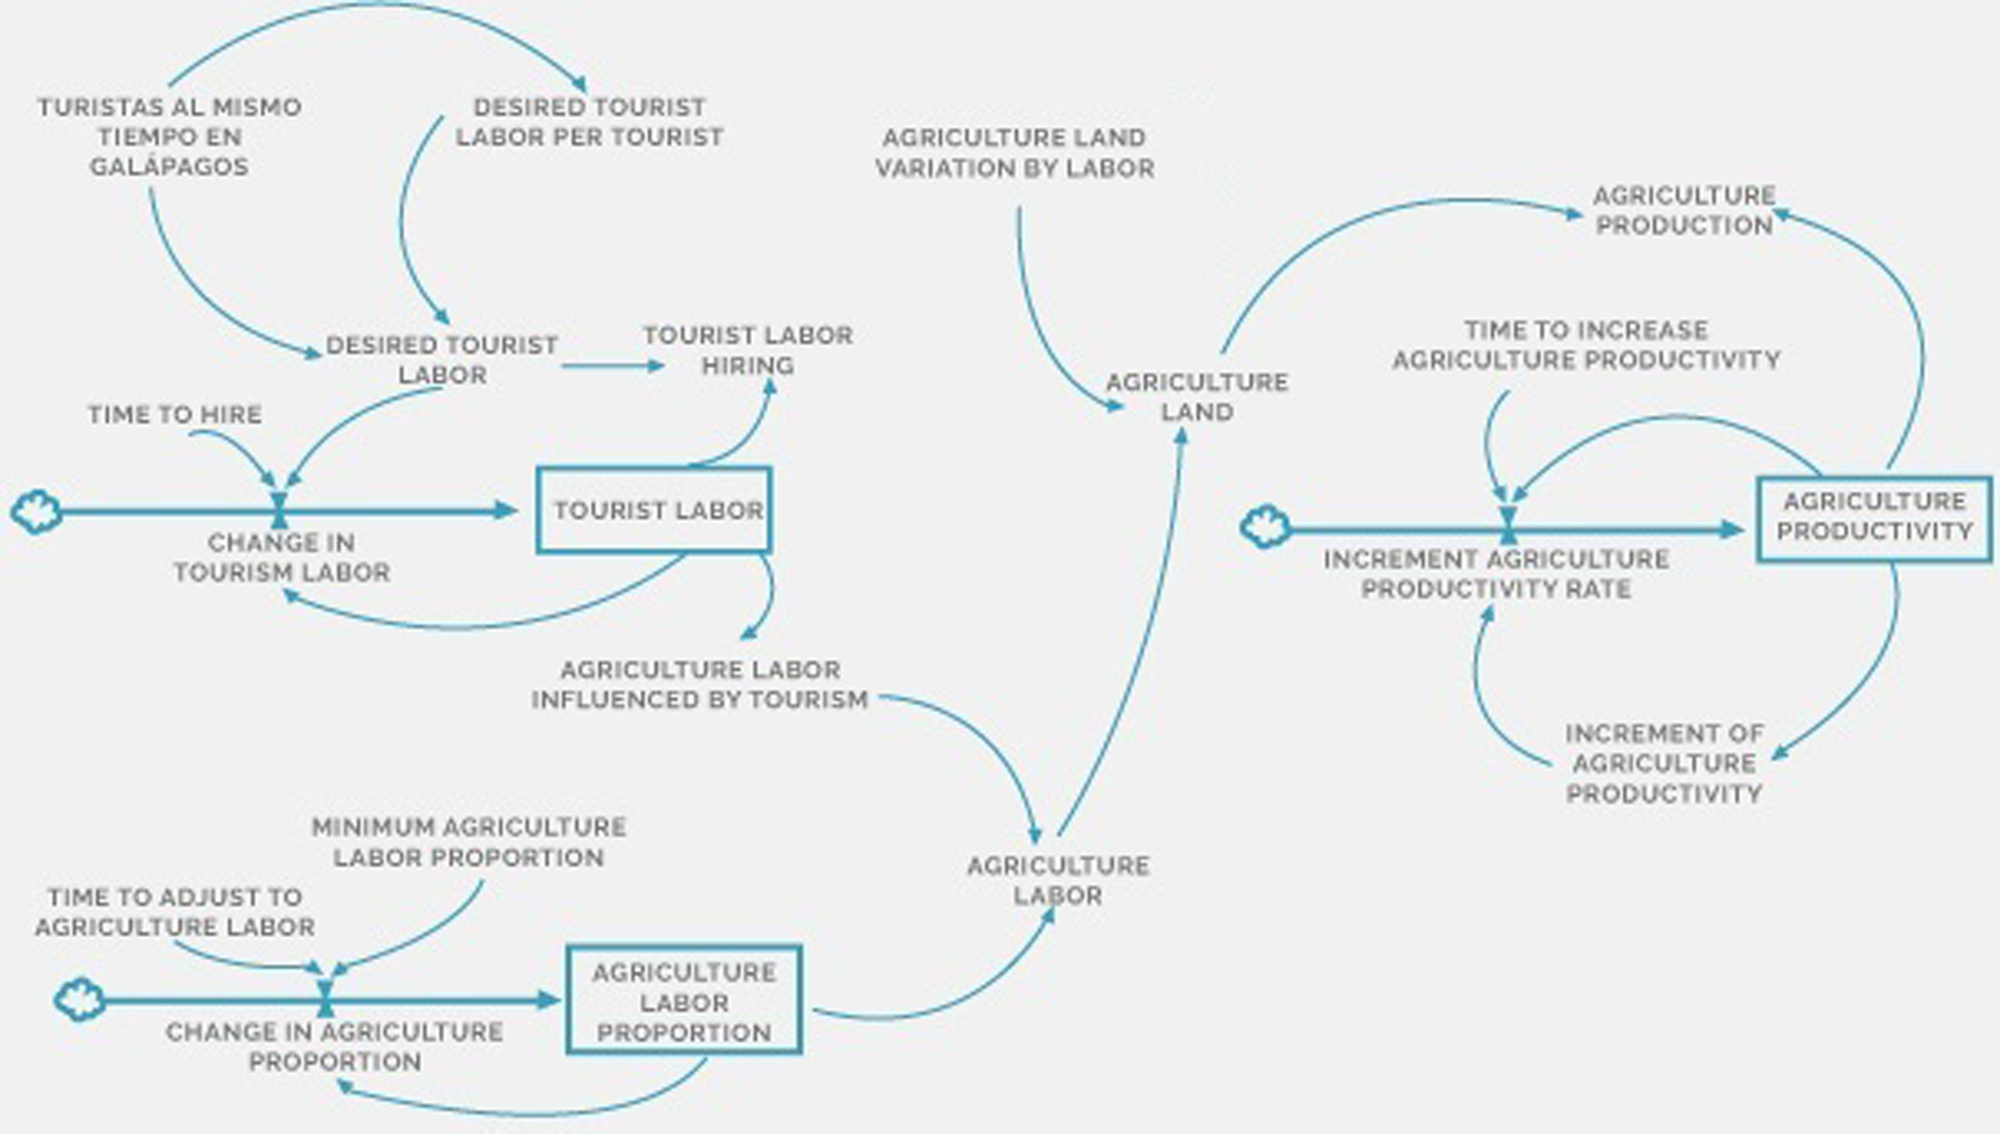
The agriculture production module was built under the assumption that the use of agricultural lands depends on labor availability because tourism attracts labor and services from the rural areas to the urban centers. In this module, the interaction between agriculture labor and livestock labor was specified. In addition, an increase in productivity was considered that allows for the calculation of the production for each year. All these dynamics are presented in Figure 4.
Dynamic diagram from the calculation of hand labor for agriculture activity, demanded farming land, productivity trend and total production.

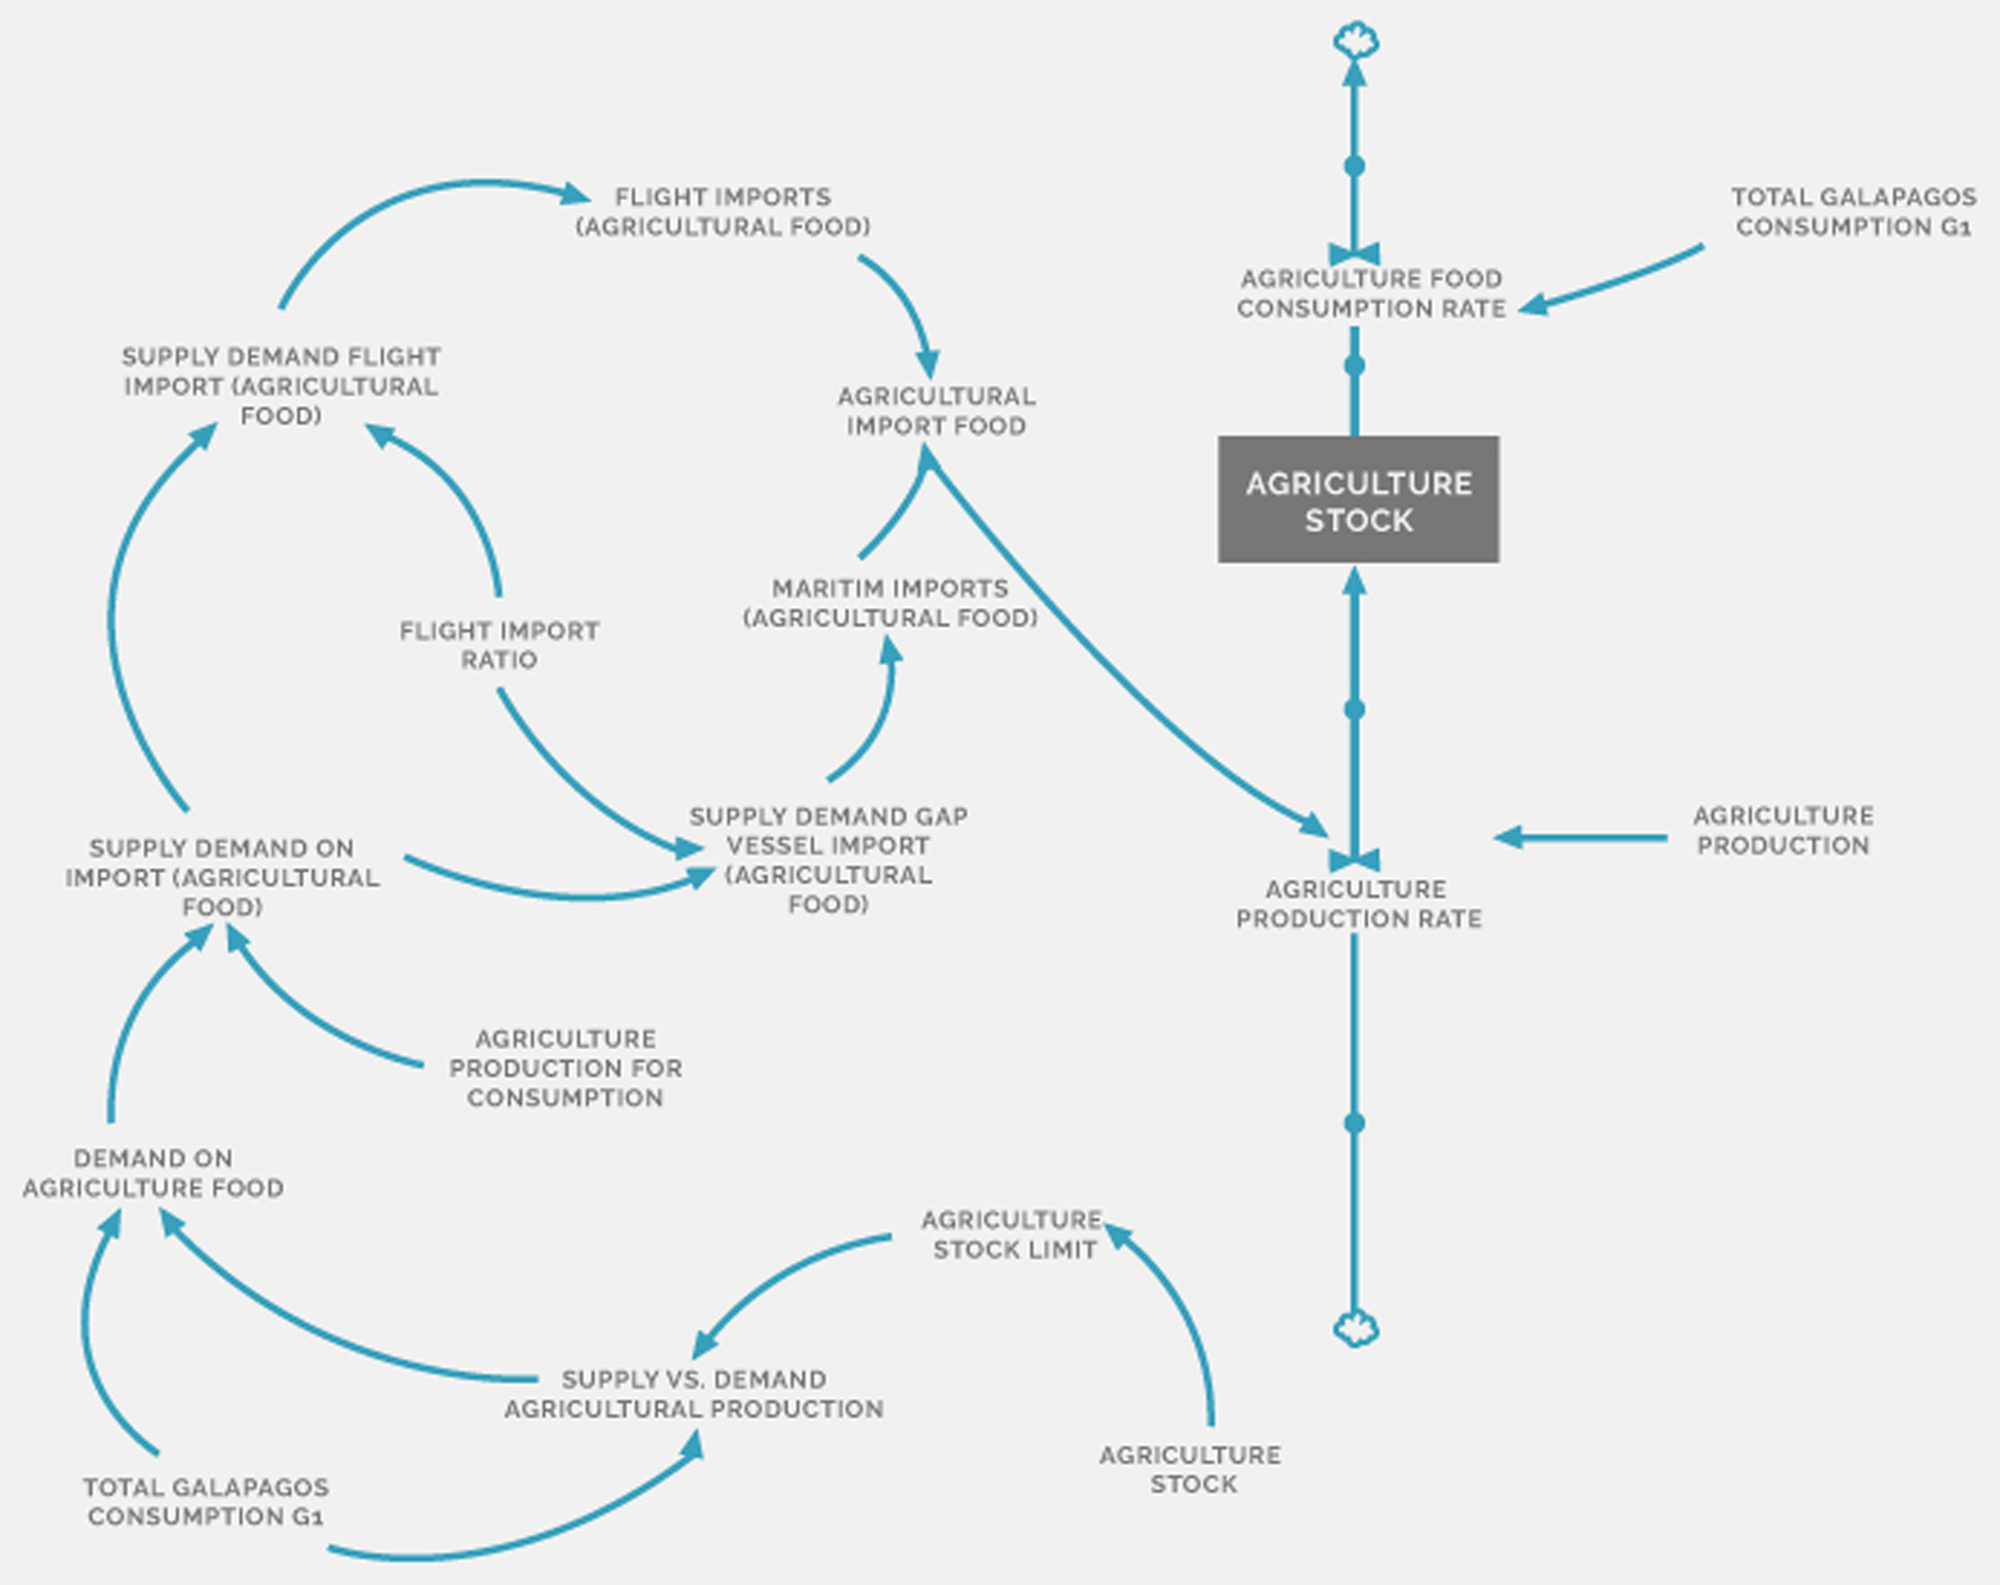
Agriculture imports sub-module: The Galapagos population relies almost entirely on food imported through maritime and air cargo. Given that local agricultural production is not capable of satisfying the Galapagos population demands for agricultural food, it is necessary to fulfill this demand with imports. In this sense, the model was based on the assumption that imports are the difference between the demands for agricultural products minus local production. In accordance with the population and local production, this trend for additional food imports from the continent will consistently increase. In other words, local agriculture production plus the imports must fulfill the agricultural food demanded by the Galapagos population for each year. This is shown in Figure 5.
Dynamic diagram from the calculation of agriculture importations.

Meat production sub-module: This module is particularly important, because the importation of meat is forbidden in the Galapagos; all production is local. In 2004, the Ecuadorian government imposed a prohibition for cattle, pork, sheep and goat meat imports to the Galapagos from the Ecuadorian mainland (Tribunal Constitucional, 2004), with the exception of a group of pre-processed meat products that are permitted, such as sausages and pre-cooked meat. Illegal introduction of fresh meat from the continent has been identified, especially from certain meat cuts that the local supply couldn't fulfill in the required volumes. This proportion of illegally imported meat was not included in the model analysis because there are no available estimations.
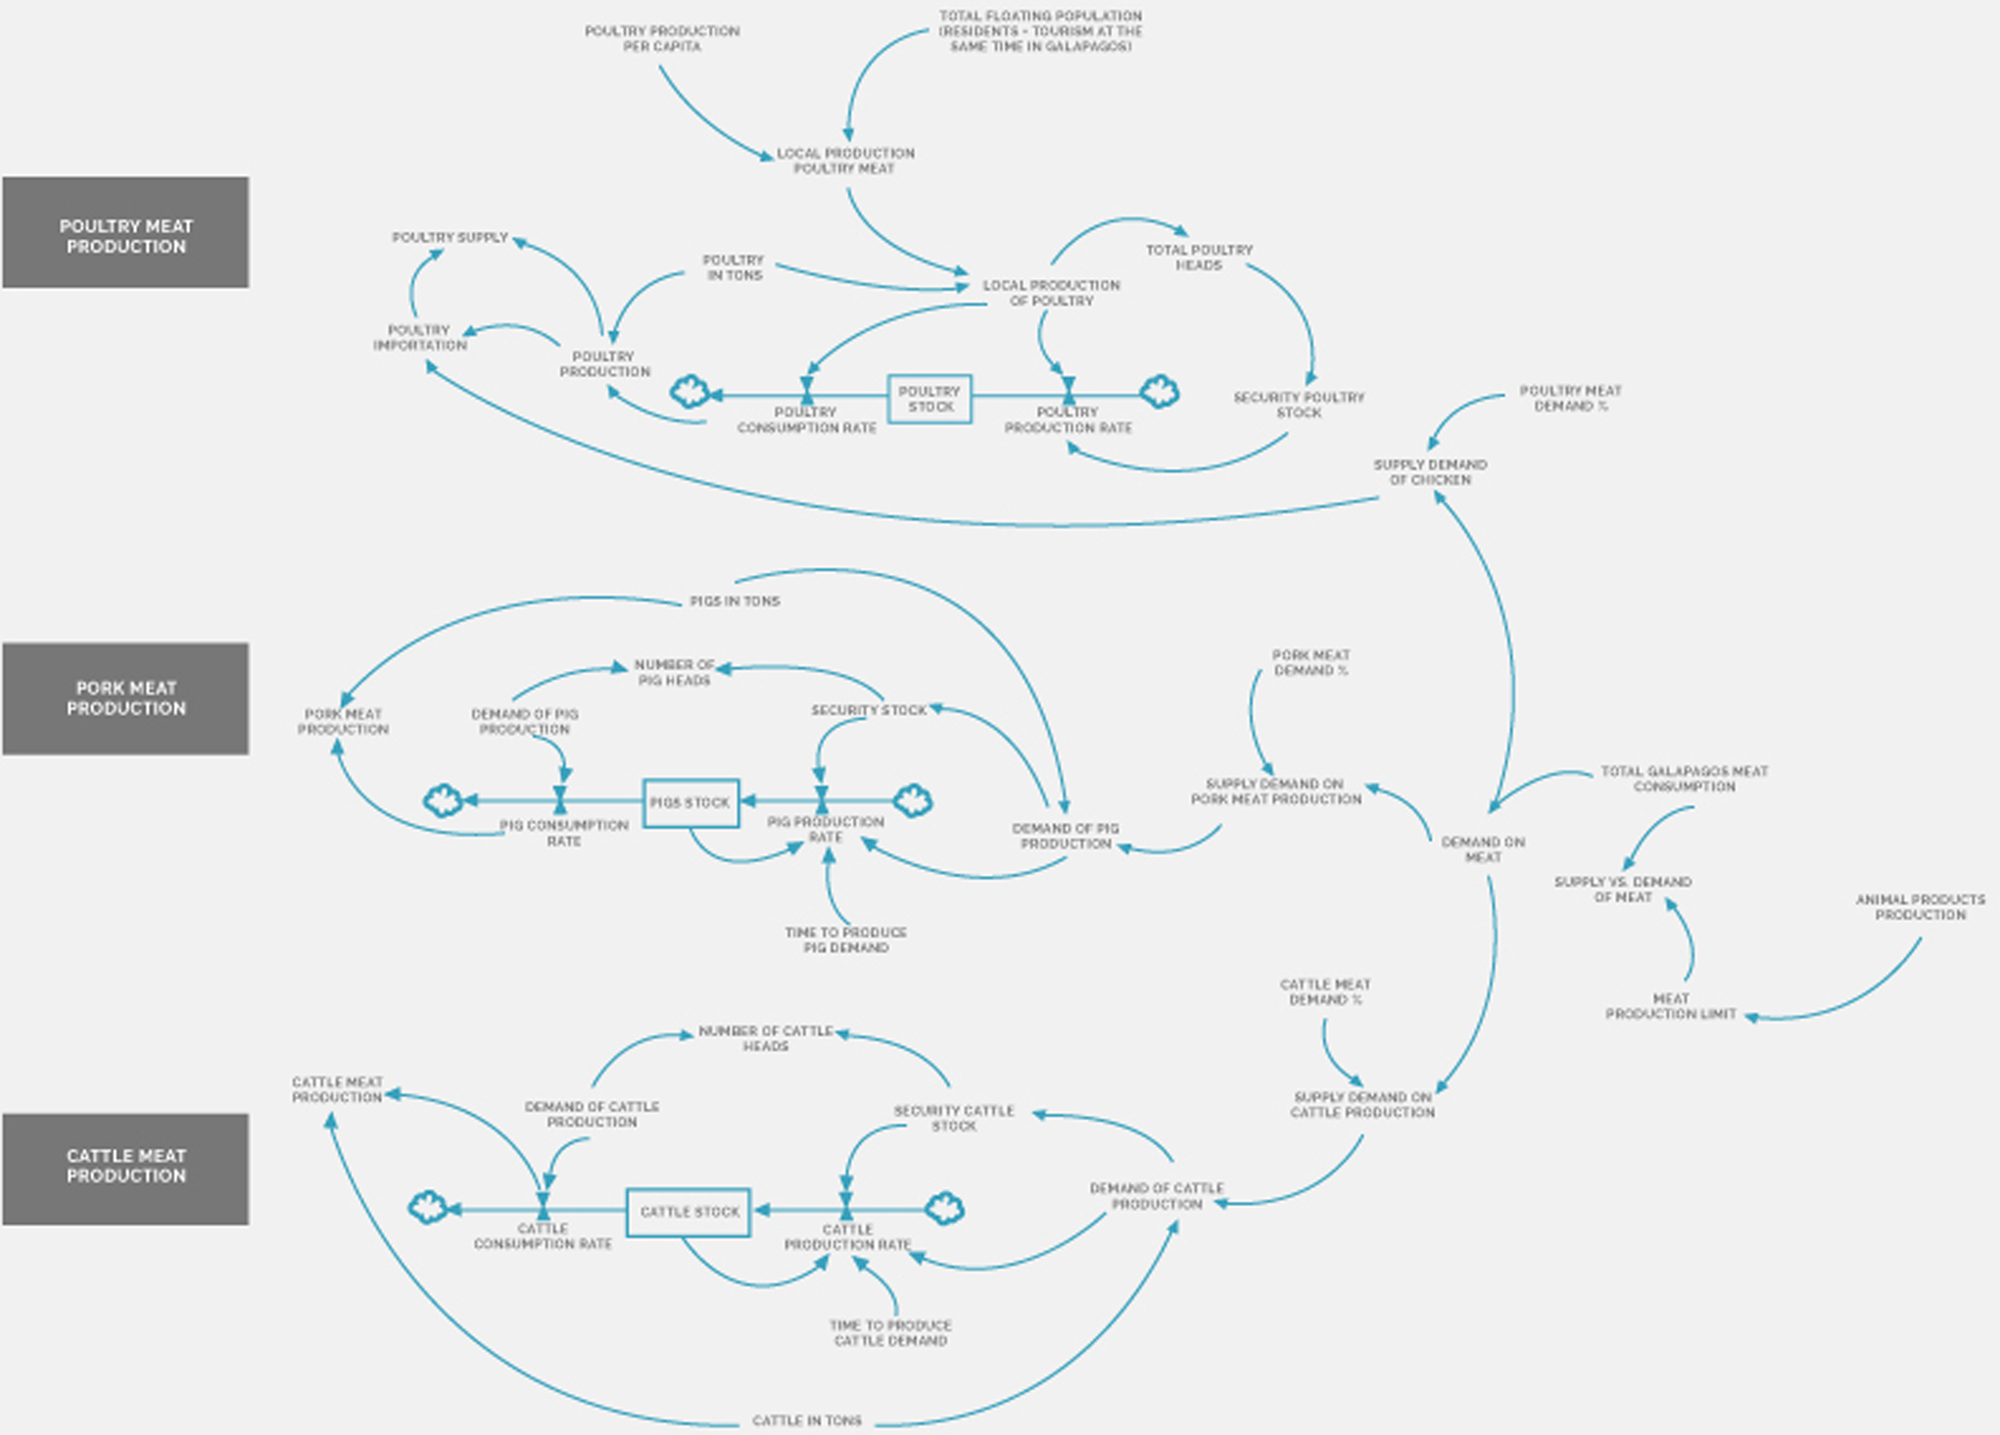
Chicken production is regulated in a different way, and the importation of chicken meat is permitted. The relationship between local production and import is mediated by the market and there is no restriction on the amount of chicken meat imports, or on the calculation of the price. The production was established by a per capita production agreement relative to the 2014 agriculture census (CGG, 2014), and the production of chicken meat is considered to increase based on population growth, while the difference was assumed to be imported. The same is considered for the milk and eggs imports. The main indicator corresponds to the number of chickens that must be produced locally in order to fulfill the local demand and the proportion of imported chicken (Fig. 6).
Dynamic diagram: (a) calculation of the number of chicken produced and import, (b) calculation of number of pig production and (c) calculation of the number of cattle heads, both based on pork and cattle meat respectively.

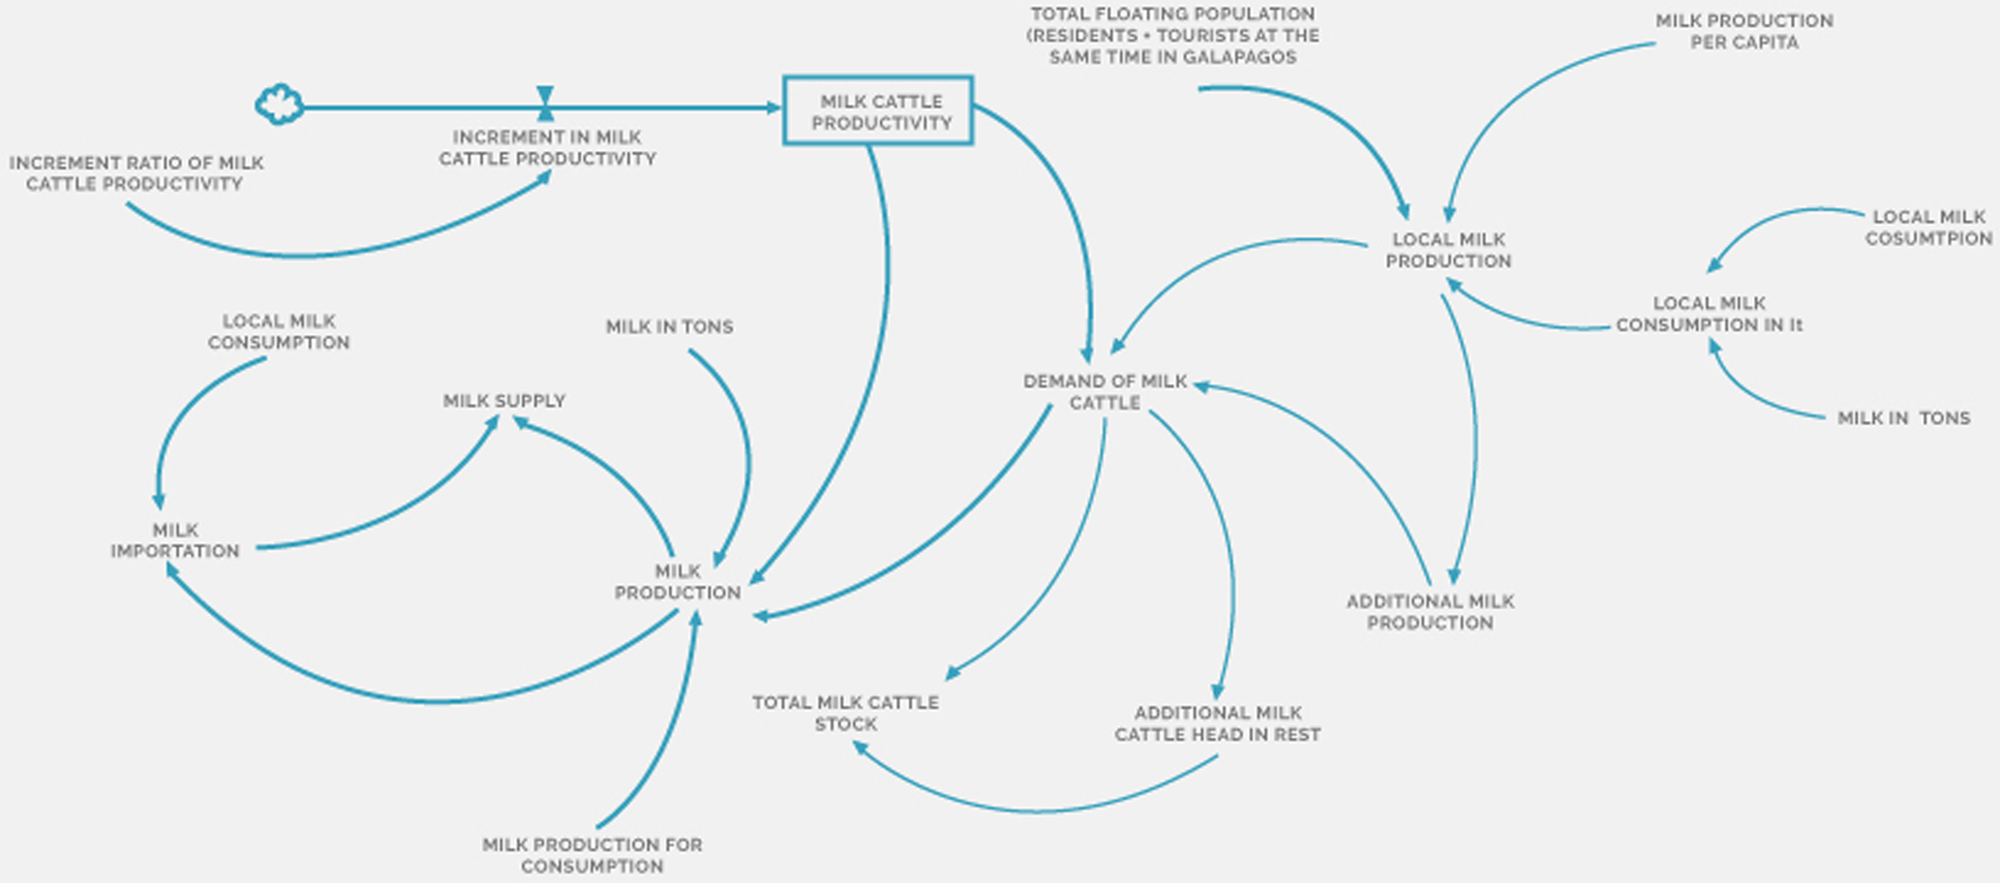
Milk production sub-module: The production of milk in the islands is regulated by the market as well, because there is an open market for milk imports with lower prices. Hence, milk produced locally is even wasted occasionally. Therefore, milk production growth depends on local market preferences that depend on prices and quality. To capture these dynamics, a production per capita was calculated connecting the increase of production to population growth, and the difference was assumed to correspond to importation. According to the 2014 census, 65% of the milk produced was used for consumption, while the remaining 35% was used for local cheese, butter and yogurt production. Only 36% of milk cows were in production at the same time, the remaining were in rest. With this data, the total number of milk cattle that the islands need for a sustainable production corresponds to the sum of both, milk cattle in production and milk cattle in rest. Figure 7 shows the diagram for milk production.
Dynamic diagram from the calculation of the number of milk cows needed for milk production accordingly to milk demand.

Eggs production sub-module: As with milk, market and prices of imported eggs regulate production. According to local sources, the actual existing capacity would allow local production to supply all the current demand for eggs and chicken meat in the islands. Hence, the producers are asking for policy changes that will allow them to produce the entire demand for these products. Figure 8 shows different relationships that lead to the current and future egg production trends in the Galapagos.
Dynamic diagram from the calculation of the number of laying hens needed for egg production accordingly to egg demand.

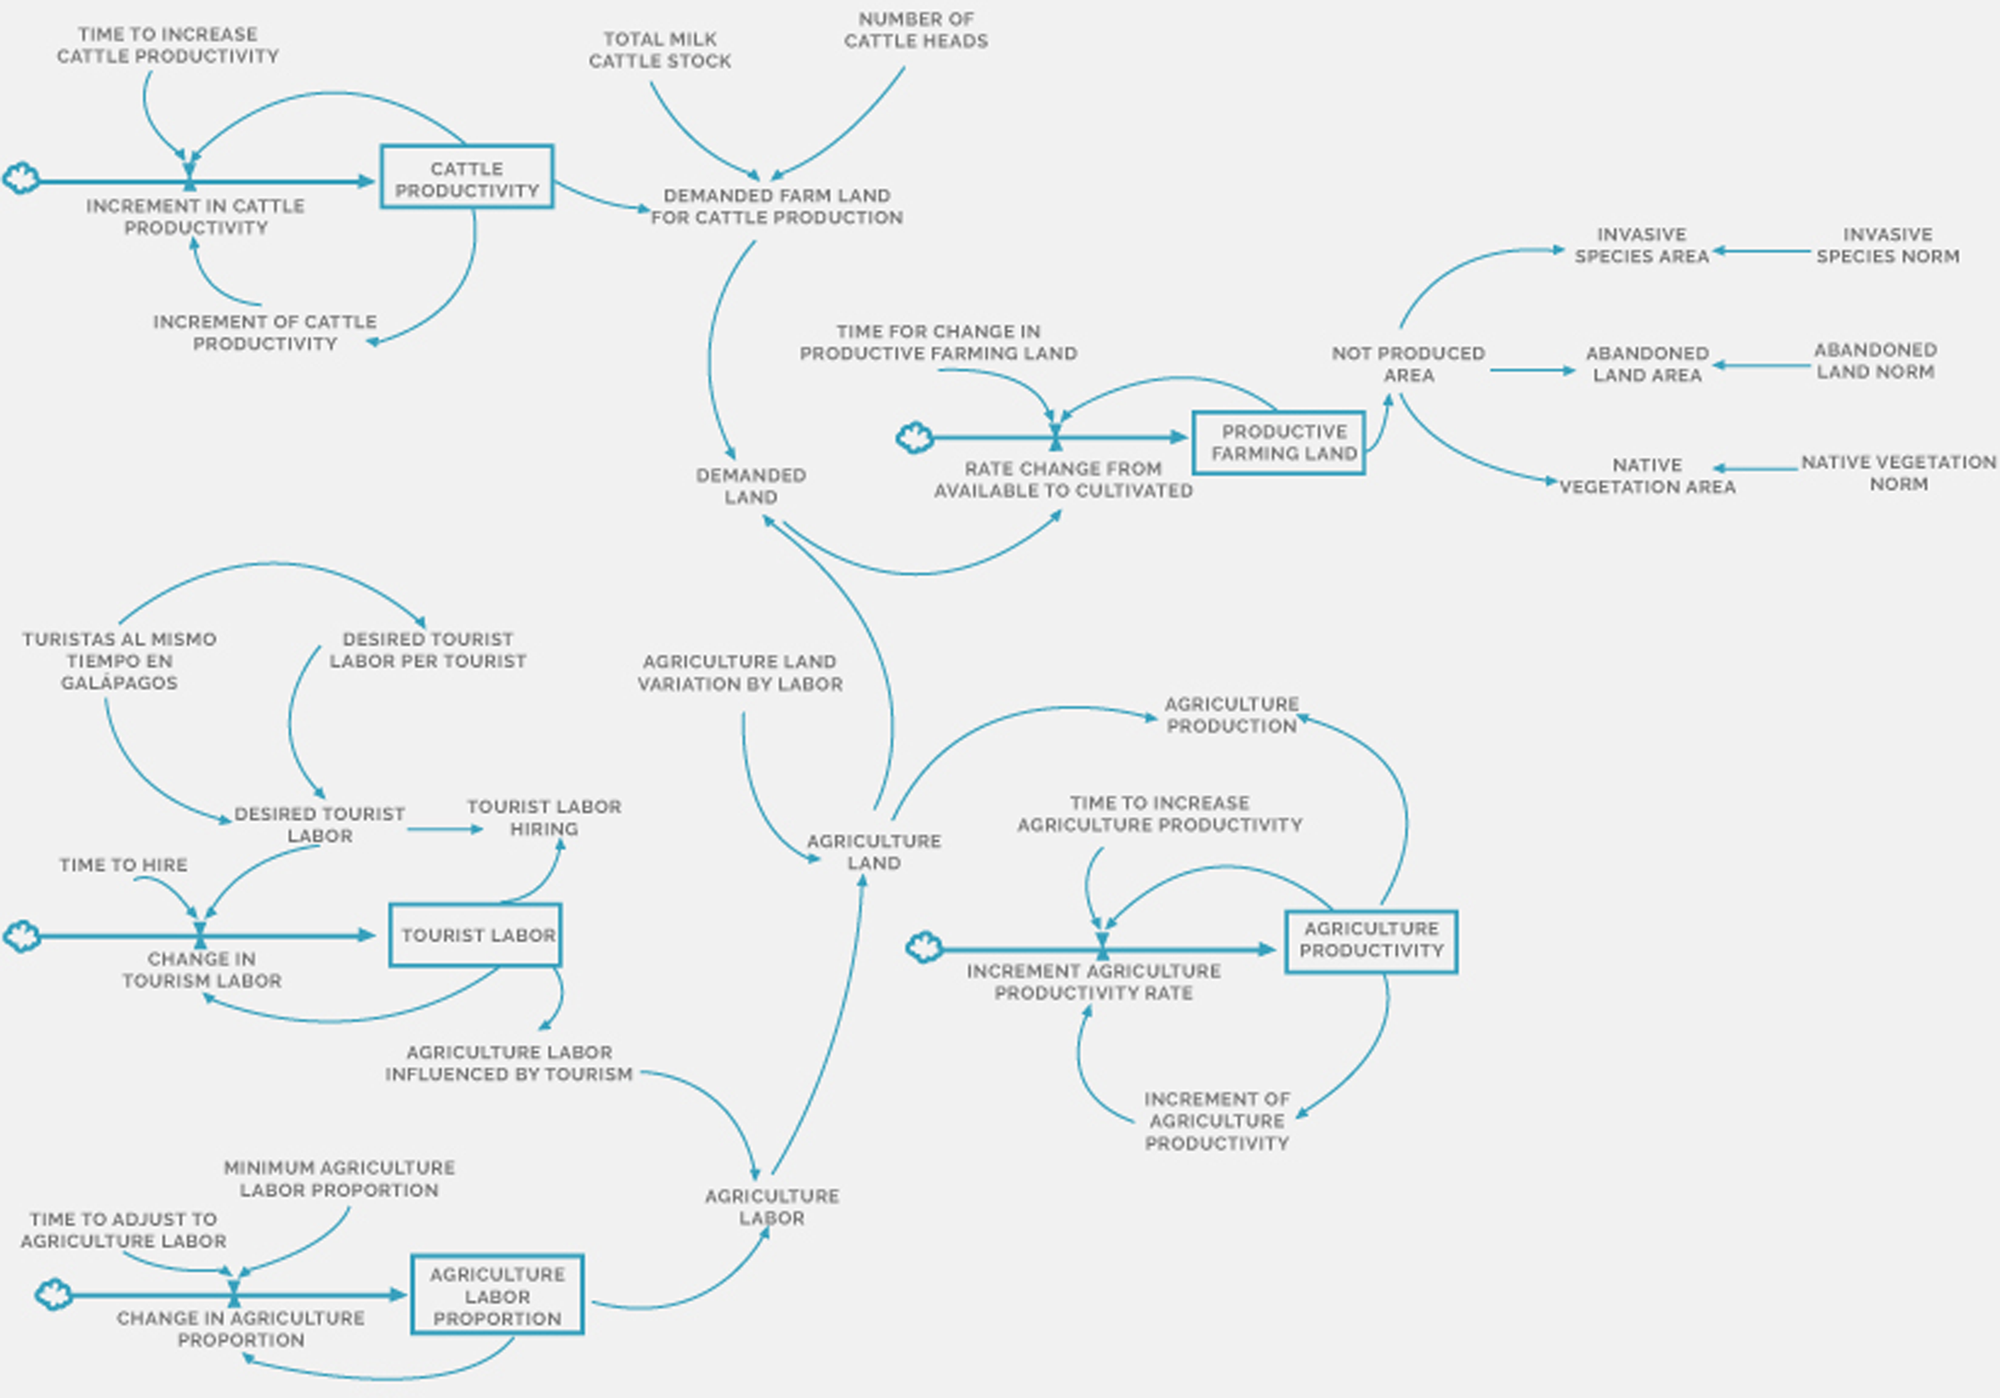
Land use module: The land use sub-model is focused on cattle and agricultural production. These elements of land production are the local activities that use available agricultural lands in the four inhabited islands. In the case of agriculture, the increase in farming land is determined by labor availability. In the case of cattle production, land requirement responds to a growing internal demand and extensive area requirements of local cattle production methods.
The total productive farming land is the active agricultural land plus active cattle ranching area (pastures). Abandoned lands are areas originally devoted to agricultural purposes, but now covered in invasive plant species, such as guava or blackberry. Rates of change of invasive plant species and natural vegetation were established based on satellite image classifications of Landsat images from 2009 and 2016. The main parameters from this module are total agriculture land, invasive species area and natural vegetation area (Fig. 9).
Dynamic diagram from the calculation of the area for agriculture and cattle production, and the remaining trend for invasive species, abandoned land and native vegetation.

Results
The consumption per capita of agriculture and livestock food in Galapagos is higher than the national average. Namely, 0.3119 (for G1) and 0.1319 (for G2) tons per yr per person, while the national average is 0.2825 and 0.0973, respectively. In general, the main consumption rates correspond to local residents who meet their basic needs consuming more than 92% of agricultural products and 98% of livestock.
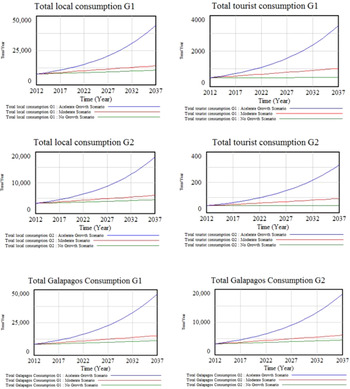
When the variables linked to population and tourism growth scenarios are projected to 2037 and compared (Fig. 10), we see that the difference between agriculture (G1) and livestock (G2) food demand increased, especially for the accelerated tourism growth scenario, with an extra 32,000 tons of food in G1 products and an extra 12,000 tons yr−1 for G2 products, compared with the other two scenarios, moderate and accelerated population growth.
Model outputs—consumption dashboard.

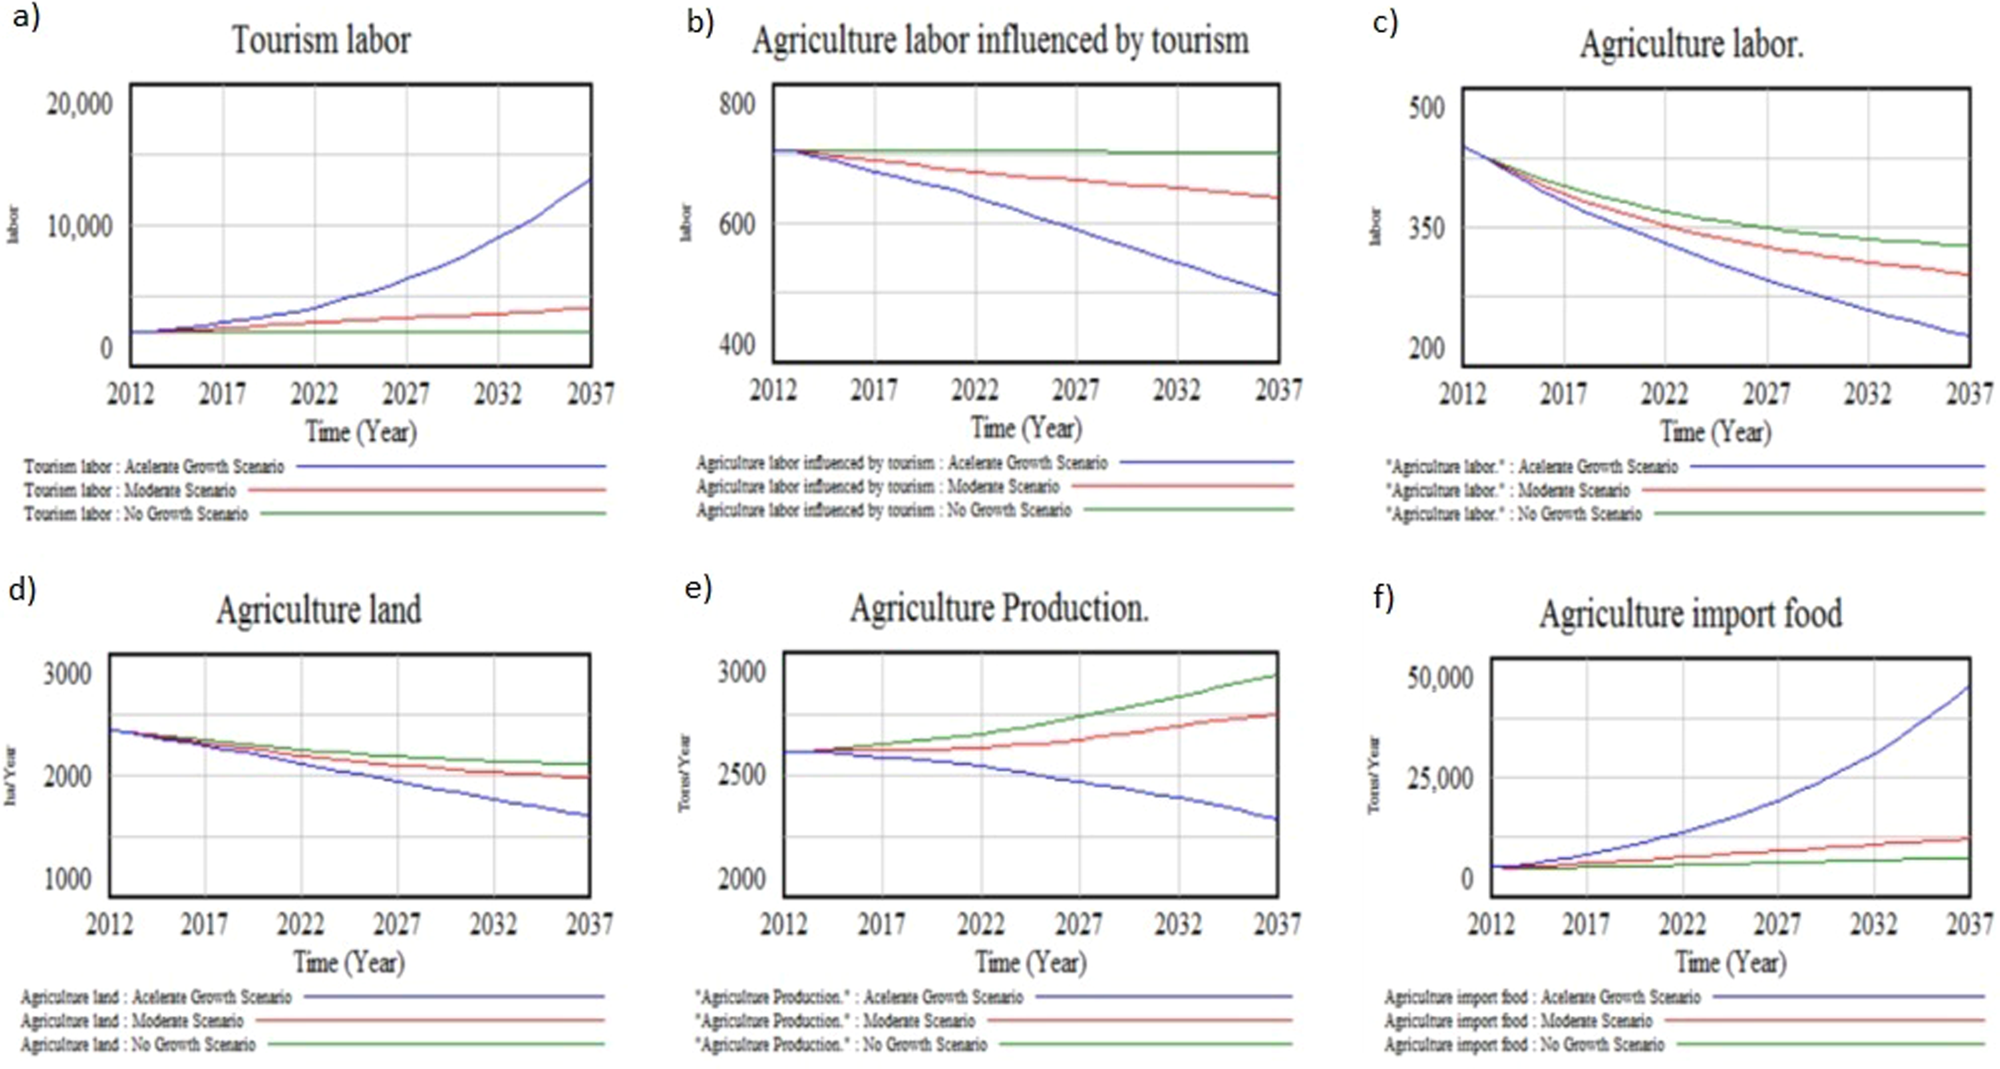
The relationship between labor and food supply is important. Our hypothesis is that, tourism attracts rural labor. A growing tourism industry will generate an increase in the floating Galapagos population (local residents and tourists at the same time) and less local agricultural products per capita. Our model shows in Figure 11(a) that in two possible scenarios of tourism growth: moderate and accelerated, there is a large increase in labor needed for the tourism industry. The impact of the movement of labor from rural areas to the tourism industry is shown in Figure 11(b). In the scenario where tourism growth remains constant (zero growth) the stock of tourism labor also remained constant and no major changes in agriculture and cattle labor are expected. The consequence of this increase in the tourism labor force, as shown in Figure 11(d), will be a decrease in the use of agriculture lands. At the same time, land productivity has shown a tendency to increase. As the level of agricultural production is determined through land productivity and use, the derived projection is affected by the dynamics of labor and land availability as shown in Figure 11(e) that translates to an increase in agricultural product imports [Fig. 11(f)]. In the accelerated population growth scenario, the importation of agricultural food is expected to increase from 8879 tons in 2017 to 44,467 tons in 2037. At the same time local production for consumption is expected to decrease by 9%, representing 255 tons for the same period.
Model output—agricultural production and importation dashboard.

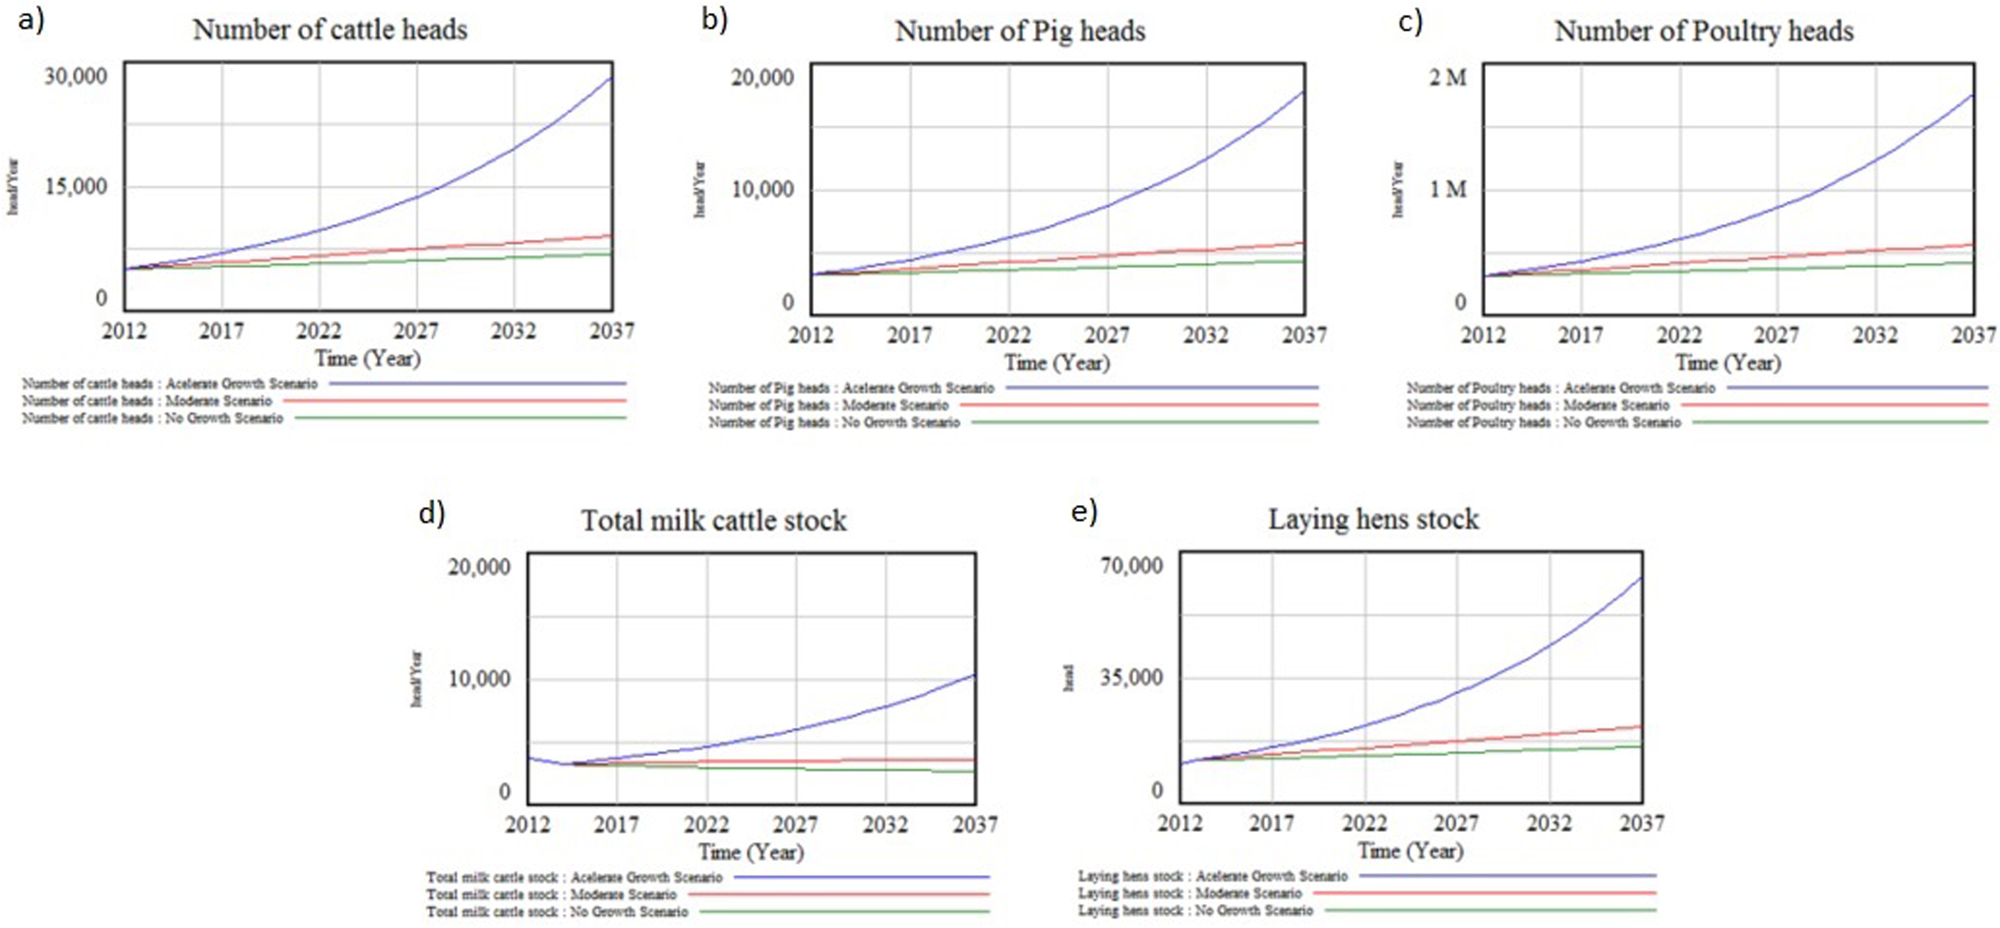
Local cattle and pig production on the islands has been increasing, mainly because meat imports are prohibited and local production must fulfill all the Galapagos meats demand. Meat production is increasing according to the population consumption growth. As shown in Figure 12(a) and (b), the accelerated population growth scenario creates a large need for cattle and pigs to satisfy food requirements, reaching 28,283 cattle and 17,882 pigs in 2037. To the contrary, when the moderate and zero population growth scenarios are considered the number of cattle and pigs increase with a moderate slope to reach between 7000 and 9000 cattle, and 4300 and 5700 pigs, respectively.
Model output—livestock products dashboard.

Imports from the continent are allowed for products such as poultry meat, eggs and milk. Thus production is not only regulated by demand, but also by market dynamics based on the prices of imported products. To express these dynamics, our model assumes that the proportion of local production is determined by the constant ‘production per capita’ based on 2014 data. Hence, a fixed proportional increment on local production and importations for these three products is seen in Figure 12.
Poultry production and importation will increase by 34.5% under the moderate population growth scenario and by 75.6% under the accelerated population growth scenario, reaching 563,645 and 1,772,885 poultry heads respectively in 2037. If the accelerated population growth scenario is analyzed, and the same market dynamics are considered, almost 8500 additional milk cattle will be needed to meet local milk consumption, and 1400 tons of imported milk are necessary to meet consumption demands. While, only 332 additional milk cattle will have to be increased to meet the moderate population growth scenario. The Galapagos will need 51,559 more laying hens from 2017 to 2037, if population growth happens at an accelerated rate, while 7713 and 3220 will be needed for the moderate and no growth population scenarios, respectively. If milk and chicken importation continues to rise accordingly, they will reach 68,124, 21,658 and 15,942 tons yr−1 at 2037 for the three scenarios.
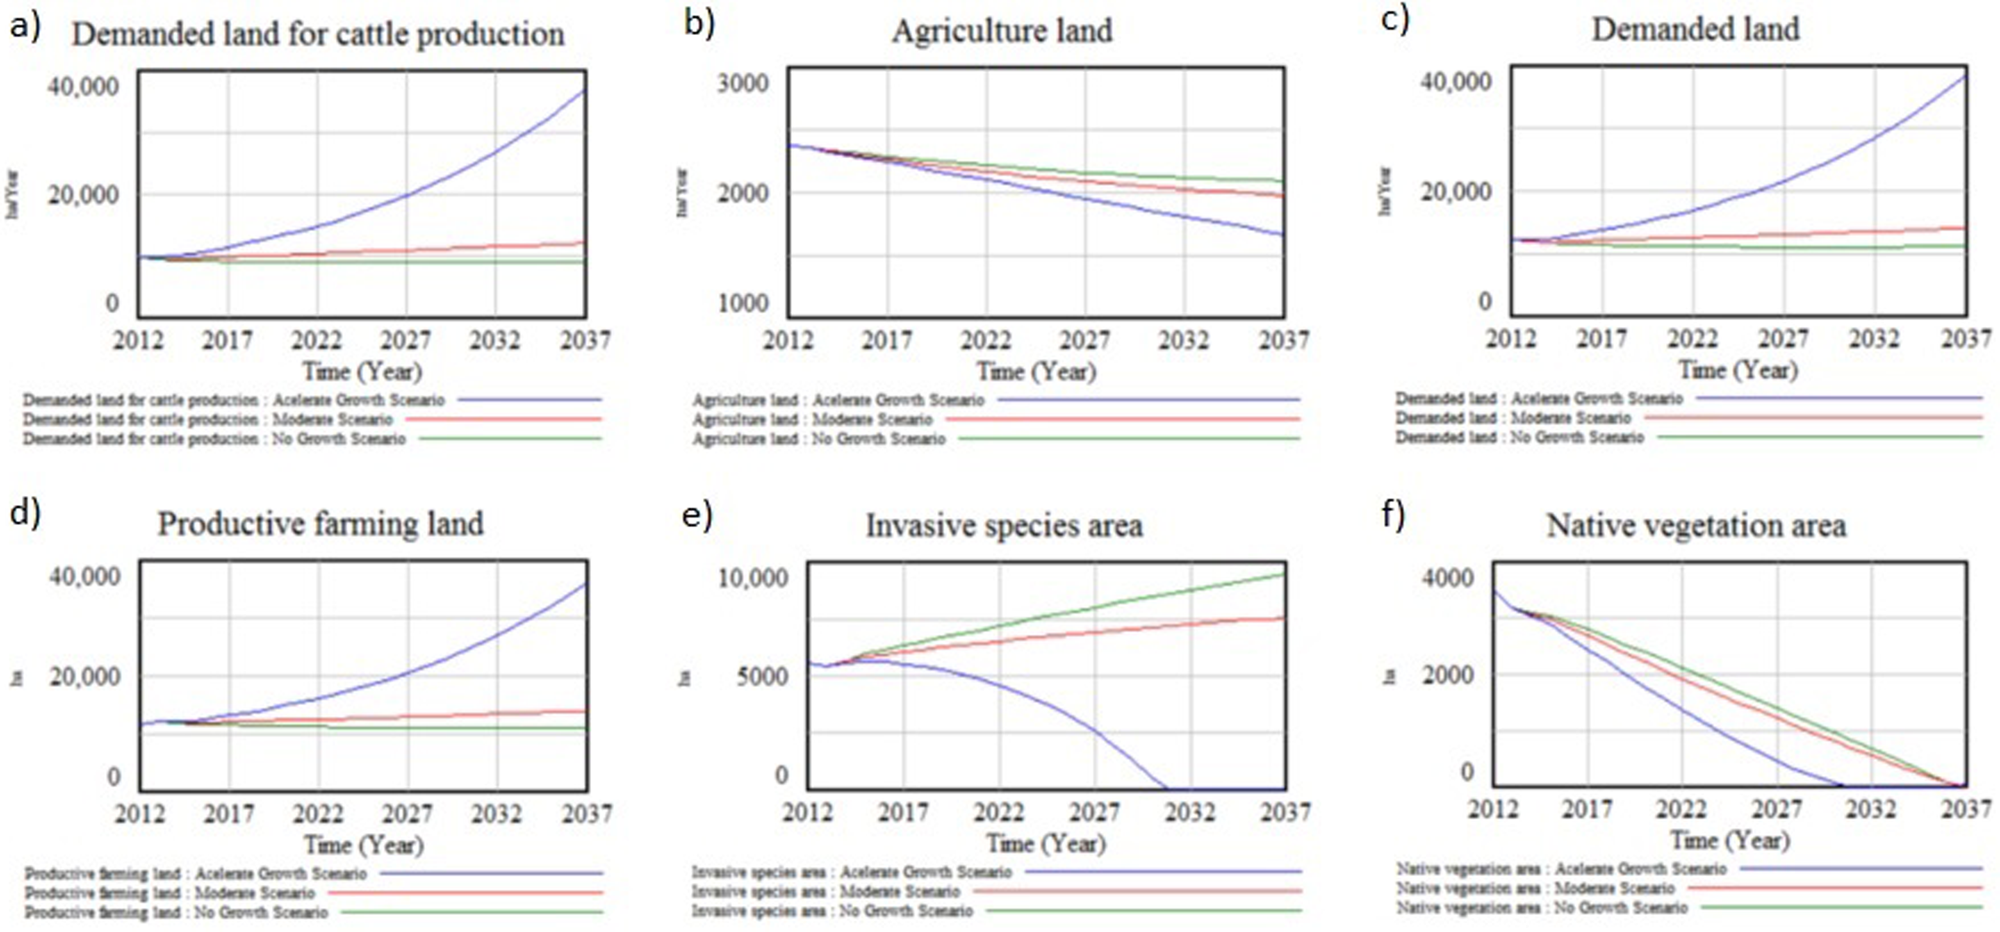
Our model shows that cattle increase has a strong effect on agricultural land use. Figure 13(a)–(c) show that livestock will have the greatest impact on the extent of total agricultural area; by 2037 livestock will account for 95% of the active agricultural area in the accelerated tourism growth scenario, and between 81 and 86% under the no growth and moderate population growth scenarios, respectively. If current production practices persist, the demand for productive land will exceed the available 25,059 ha in 2030 (for accelerated tourism population growth scenario). An increase in agricultural land use will decrease the area available for invasive species, shown in Figure 13(c) and (f). Under the accelerated tourism growth scenario, invasive species tend to decrease. For the moderate and zero growth scenarios, invasive species will make up 28 and 37% of agricultural area respectively, as lower levels of agricultural production provide more fallow area for invasive plants species to take hold.
Model output—agricultural land dashboard.

Discussion
This paper used SD to study the future of the food-supply system in the Galapagos Islands through the analysis of its main variables and interactions. Through the construction of a flowchart model the relationships between population growth and food consumption in the Galapagos Islands were analyzed and the influence of food demand on the supply dynamics of the islands was observed. One of the main results is that local agricultural production cannot meet food demand on the islands due to the draw of labor from agriculture to the tourism industry. This livelihood transition has decreased productivity rates and has created reliance on imports to fill the production gap.
It was observed that the per capita food consumption in Galapagos is higher than the national average. This is also true of processed food consumption, which is 0.6792 tons per yr per person in Galapagos vs 0.2512 in continental Ecuador. Additionally, while consumption of agricultural products is decreasing (INEC, 2009, 2014), processed food intake is increasing.
Preference for processed foods over fresh foods is a key issue in terms of nutrition and public health in general. Kearney (Reference Kearney2010) points out how low income groups prefer processed foods, however, in Galapagos, income levels are relatively high. As such, other issues such as consumer attitudes, urbanization, food availability and accessibility may be influencing food choices more than production systems (Øvrum et al., Reference Øvrum, Alfnes, Almli and Rickertsen2012).
The Galapagos Islands are facing a nutrition transition, which according to Gerbens-leenes et al. (Reference Gerbens-Leenes, Nonhebel and Krol2010) include a shift from local markets toward external trade. These changes in consumption behavior may be responsible for the increase in the obesity in the population of the Galapagos, which is the highest in the country (Freire et al., Reference Freire, Ramírez, Belmont, Mendieta, Silva, Romero, Sáenz, Piñeiros, Gómez and Monge2014). The double burden of under-nutrition and over-nutrition at the same time (Kearney, Reference Kearney2010) is increasingly recognized as a problem for the food security sector in Galapagos.
Consumption behavior coupled with population growth prompted by tourism and immigration have driven the annual increase in food demand on the islands. The SD model presented here suggests that without changes in current importation policies, agricultural production will continue to decrease despite local demand and efforts to encourage local agricultural production (i.e., MAGAP, 2013, 2016; Jaramillo et al., Reference Jaramillo, Cueva, Jiménez and Ortiz2014).
The link between tourism and agriculture has been studied in the Caribbean Islands, which suffered a similar economic shift as result of an aggressive tourism industry growth. McElroy and Albuquerque (Reference McElroy and Albuquerque1990) argue that in small islands undergoing tourist-driven economic transformations, labor extraction from the agricultural sector, large-scale immigration and rural land competition are the three main factors driving agriculture decrease. Others (Telfer and Wall, Reference Telfer and Wall1996; Loumou et al., Reference Loumou, Giourga, Dimitrakopoulos and Koukoulas2000) also consider tourism as an agent of negative changes toward agriculture. On the other hand, it is recognized that under the right circumstances and with good public policy, tourism can also provide new opportunities to boost agriculture production (Cox et al., Reference Cox, Fox and Bowen1995; Loumou et al., Reference Loumou, Giourga, Dimitrakopoulos and Koukoulas2000). We note that in our model, urbanization processes were not included due to competition for land can be considered as marginal (Latimer, Reference Latimer1985).
As is represented in our model, Guzmán and Poma (Reference Guzmán and Poma2013) defines the main problem of Galapagos agriculture as the disconnect between production and local market dynamics. Local distributors define the prices of local products as compared with imports. Among the main market obstacles are the lack of marketing, storage facilities, subsidies for imported foods and weak contact between the producers and the consumers (Belisle, Reference Belisle1983). The lack of innovative practices and inclusion of new technologies in current agricultural production also represent additional restraints.
As Galapagos agriculture increasingly relies on aging farmers and traditional agriculture methods, the local response to this problem has been importing workers from the continent, instead of shifting to modern and efficient technologies or to agroecological methods. The low adoption rate of new technology is based on factors such as policy limitations, education limitations, negative perceptions of modern technology, lack of capital, small land area, ineffective infrastructure facilities and limited capacity of extension workers (Abdullah and Samah, Reference Abdullah and Samah2013). However, there are increasing efforts by local authorities (MAGAP, 2018) and farmers’ associations (El Telégrafo, 2018) to move into agroecology, which could potentially change agricultural practices in the Galapagos. Several pilot tests have already yielded positive results (Jaramillo et al., Reference Jaramillo, Cueva, Jiménez and Ortiz2014). In our model, any increase in local agricultural production will lead to a decrease in imported foods and a decrease in invasive plants. Also, Guzmán and Poma (Reference Guzmán and Poma2013) argues that the elimination of economic obstacles accompanied by the stimulation of local capacities will increase agriculture production and stabilize the rural economy. The introduction of innovative agricultural practices will be key to developing agricultural and livestock activities, both to maximize production efficiency and intensify the use of agricultural lands (Abdullah and Samah, Reference Abdullah and Samah2013).
Invasive species are considered largely detrimental to local production, and are partially responsible for agricultural abandonment in the Galapagos (Jaramillo et al., Reference Jaramillo, Cueva, Jiménez and Ortiz2014). The regeneration of abandoned land has highly stochastic outcomes, as it depends on plants that can disperse, stabilize and survive apart from surrounding habitats (Rey Benayas, Reference Rey Benayas2007). In most cases, invasive species displace native plants (Jäger et al., Reference Jäger, Kowarik and Tye2009). Invasive animals, including rodents and birds, may have a large impact on agriculture, but currently there is not enough information to understand the effect on the food system. Despite efforts from several institutions and organizations to invest in projects to control and eradicate invasive species (González et al., Reference González, Montes, Rodríguez and Tapia2008; Coello and Saunders, Reference Coello and Saunders2011; Parque Nacional Galápagos, 2013), it is expected that numbers will continue to rise in years to come. This is because of the influence of the growing tourism industry, the importation of goods and services (Cremers, Reference Cremers2002; González et al., Reference González, Montes, Rodríguez and Tapia2008), and the relation between invasive species and population size (Trueman et al., Reference Trueman, Atkinson, Guézou and Wurm2010). Our model suggests improvements in land use would benefit conservation as agricultural and pasture lands keep the spreading of invasive plant species under control.
In the Galapagos, imports are the largest source of food. Our model calculates that about 75% of agriculture food supply was transported from the continent in 2017 and this will increase to 95% by 2036 with no changes in food policies. Increasing reliance on imports, which in turn threatens food security, is a common problem in small, developing islands (FAO, 2014), though there is some debate in the literature on this. McGregor et al. (Reference McGregor, Bourke, Manley, Tubuna and Deo2009) argues that the dependence on imports is not necessarily correlated with food insecurity as long governments and individual households have the capacity to pay for the food they import. Regardless, Kearney (Reference Kearney2010) concluded that collaborative efforts to build locally based and self-reliant food economies should be prioritized in these contexts.
The Galapagos consumption behavior has a direct impact on social, economic and environmental systems through the increased use of resources including agricultural products and livestock production. This in turn requires more land, water and energy resources, and raises the footprint of transportation CO2 (Pizzitutti et al., Reference Pizzitutti, Walsh, Rindfuss, Gunter, Quiroga, Tippett and Mena2016), resulting in increased expenditures for the population and local authorities (Llive, Reference Llive2016). Food imports are the most important driver of invasive species arrival in the Galapagos (Cremers, Reference Cremers2002; González et al., Reference González, Montes, Rodríguez and Tapia2008). Furthermore, food imports increase the need for waste management (Buzby and Hyman, Reference Buzby and Hyman2012) and impacts public health (Freire et al., Reference Freire, Ramírez, Belmont, Mendieta, Silva, Romero, Sáenz, Piñeiros, Gómez and Monge2014). Thus, analyses of consumption patterns, such as that presented here, provide information important for creating consumption guidelines. The same types of analyses are also necessary for the food-supply system. McElroy and Albuquerque (Reference McElroy and Albuquerque1990) emphasize that mitigating only natural and economic constraints cannot address long-term institutional and structural obstacles to adequate food supply. They concluded that agricultural policy must be integrated into overall economic planning to account for sectoral imbalances, while institutional and information infrastructures must be strengthened (FAO, 2017).
Conclusion
The consumption profile of the Galapagos is on average higher than consumption on the Ecuadorian mainland. This fact, plus the rapid growth of local population fueled by the tourism industry, has decreased per capita local food production, and increased food import dependence. This creates a challenge for the sustainability and food security of the archipelago.
Moreover, local agricultural production is not connected to the islands food demand, so there is no tangible incentive to stimulate production. If we take ecological risk factors into account, such as the spread of invasive plat species in agricultural areas and the risk of invasive animals and pathogens in imported foods, healthy farming production is key for the environmental conservation of Galapagos and ensuring food security for the communities.
Livestock and pork production have the capacity to meet local food demand. Meat import restrictions have stimulated local production, but improvements should be made to quality control and the regulation of illegal meat importation to improve the process. Additionally, our model also indicates that the capacity for local poultry production should satisfy current and future local demands, which indicates a possibility for a restriction in imported poultry meat.
Cattle production is an activity that demands large portions of agricultural area. Depending on the population growth scenario, by 2036, if the current production model continues, an over-demand of the available agricultural area is expected. Consequently, while pasture land increases, a decrease of areas occupied by invasive plant species is expected, as well as the areas of native vegetation in the agricultural areas.
Self-reliance in local production is an additional goal to pursue by local communities and authorities in the Galapagos Islands. This will be achieved by technology improvement, technical assistance, economic incentives, price and import regulations and awareness campaigns for local product consumption incentive.
Any plan to increase tourism arrivals must be accompanied by a plan to solve subsistence needs of the population that the tourism industry attracts. Thus, policies to promote agricultural growth should be central to strategies reduce food insecurity. However, primary information concerning these matters is almost non-existent. In the past few years some efforts and resources have been invested into the generation of data about consumption, income, prices, land production and imports in Galapagos, but there is not yet an appropriate system for data collection and analysis.
This research was focused on representing the dynamics of the food-supply system in the Galapagos Islands. However, this is only a small part of what food security represents in the full sense of the concept. In this regard, future research should focus on extending this theoretical exercise toward the implementation of new subsystems that will improve the description of food security in the Galapagos Islands, such as the food and environment system, market interaction system and nutrition and health systems. However, information availability acts as a constraint, and as such the collection and systematization of local data is important for the success of future.