1 Introduction
There is by now a persuasive body of evidence indicating that many employed respondents in the original Health and Retirement Study (HRS) cohort, responding in 1992 and in later interviews to questions regarding their defined benefit (DB) pensions, were not well informed about important aspects of these pensions such as the value of employer benefits at retirement and the age of eligibility for benefits.Footnote 1 These findings were a matter of concern because of the important role that DB pensions represented in the post-retirement wealth of this cohort.
Little attention has been given to the accuracy of employee information regarding defined contribution (DC) plans, tax-deferred savings accounts in which employee contributions and investment returns are deferred from taxes until account balances are drawn down. The only analysis to date of DC plans finds substantial differences between employee-reported pension values and amounts calculated from employer plan documents (Gustman and Steinmeier, Reference Gustman, Steinmeier, Gale, Shoven and Warshawsky2004). The authors note that errors are likely to arise both with respect to respondent reporting of current balances and from the difficulties faced by analysts in translating firm plan provisions into pension values.
We use Social Security W-2 records, which contain information on annual earnings and tax-deferred contributions to 401(k)-type plans,Footnote 2 to examine employees’ knowledge of their contributions to DC pensions. This issue is important from a public policy perspective because decisions regarding annual contributions to these plans, the most common form of DC pension, may play a decisive role in determining employees’ pension wealth at retirement. We compare the accuracy of information reported in 1992 by respondents ages 51–56 in the original HRS cohort (born between 1936 and 41) with information reported in 1998 by respondents ages 51–56 in the War Babies (WB) cohort (born between 1942 and 47), and in 2004 by respondents ages 51–56 in the Early Baby Boomer (EBB) cohort (born between 1948 and 53).Footnote 3 Respondents in the two younger cohorts (WB and EBB) are more likely to be enrolled in DC plansFootnote 4 and accumulations in their accounts are likely to represent a larger share of their post-retirement wealth. Our expectation, therefore, is that they will be better informed about their inclusion in plans than members of the older cohort. We test this assumption by first comparing respondent reports of inclusion in DC plans with evidence from W-2 records. We then compare the reports of annual contributions to such plans with values obtained from these records. To our knowledge, this analysis is the first to use information in Social Security W-2 records to assess the reliability of employee reports regarding inclusion in DC plans and annual tax-deferred contributions.Footnote 5
We find that respondents in the younger WB and EBB cohorts were more accurate than those in the HRS cohort in reporting inclusion in DC plans. They were not, however, more accurate in their responses regarding whether they were currently contributing to their plans. Contributors in the three cohorts, moreover, significantly overestimated their annual contributions, which may lead them to experience lower than expected account balances at retirement.
The following section describes the survey information from the HRS regarding coverage and participation in employer-provided pension plans and Social Security administrative data on tax-deferred contributions to DC plans. The next section uses these two sources of information to assess the accuracy of HRS respondents’ reports regarding their inclusion in DC plans, their participation (whether they contributed to their plans), and, if participating, the amounts of their contributions. We then present simulation results regarding the implications of reporting errors with respect to account balances at retirement. A final section summarizes the observed behavioral differences and similarities in the three cohorts, and the implications of our findings for research and for public policy.
2 Data
We use data from the HRS, a longitudinal, nationally representative survey of Americans over the age of 50 and their spouses of any age. The first wave of interviews was conducted in 1992 and follow-up interviews were conducted every other year thereafter. In this analysis, we use the 1992, 1998, and 2004 waves of the survey. We restrict our samples to respondents ages 51–56: the original HRS cohort born between 1936 and 41 were interviewed in 1992, the WB cohort born between 1942 and 47 were interviewed in 1998, and the EBB cohorts born between 1948 and 53, were interviewed in 2004.Footnote 6 The HRS provides detailed information on demographic and job characteristics, household income and wealth, pension plans in current and previous job(s), attitudes toward risk, financial planning horizons, retirement plans, and expectations about the future.Footnote 7
The pension section begins with a question asking if respondents are included in one or more pension plans through their job or union and if so, whether these plans are DB or DC pensions.Footnote 8 Respondents who report being included in a DC plan are then asked a series of questions pertinent to the plan, such as the type of plan (whether 401(k), 403(b), SRA, for example), the account balance and how it is invested, whether the plan allows investment choices, whether the employer contributes to the plan and if so, the value of this contribution.Footnote 9 In addition, respondents are asked in a separate question about the amounts they are currently contributing (either a dollar amount or as a percent of pay) to their accounts and the frequency of such contributions.Footnote 10 We use this information to calculate their annual contributions. Given that survey respondents were asked separate questions about their own contributions to DC plans and their employer contributions, it would be expected that they would report the value of each contribution separately. However, it is plausible that some respondents incorrectly report as their own contribution, the sum of their own and their employers’ contributions. We discuss this possibility below.
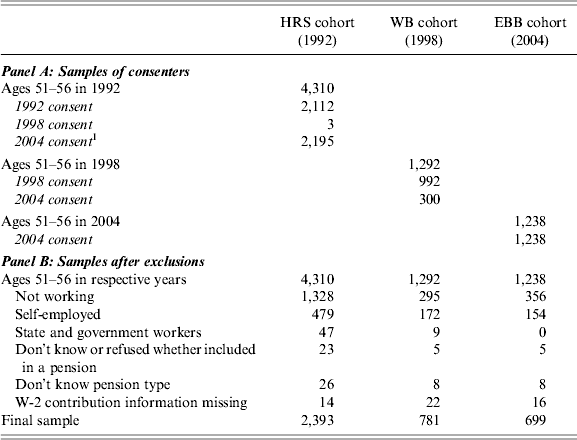
An important feature of this dataset is that respondents were asked either in 1992, 1998, or 2004 to give permission for their Social Security Administration (SSA) benefits and earnings records to be linked to their survey information.Footnote 11 For the original HRS respondents who consented in 1992, earnings records are available from 1980 to 1991, whereas for those of the same cohort who consented in 2004, earnings records are available from 1978 to 2003. For respondents in the WB cohort who consented in 1998, earnings records are available from 1978 to 1997. For respondents in the WB and EBB cohorts who consented in 2004, earnings records are available from 1978 to 2003.Footnote 12 Table A1 presents these samples of consenters ages 51–56 for each cohort by permission year.
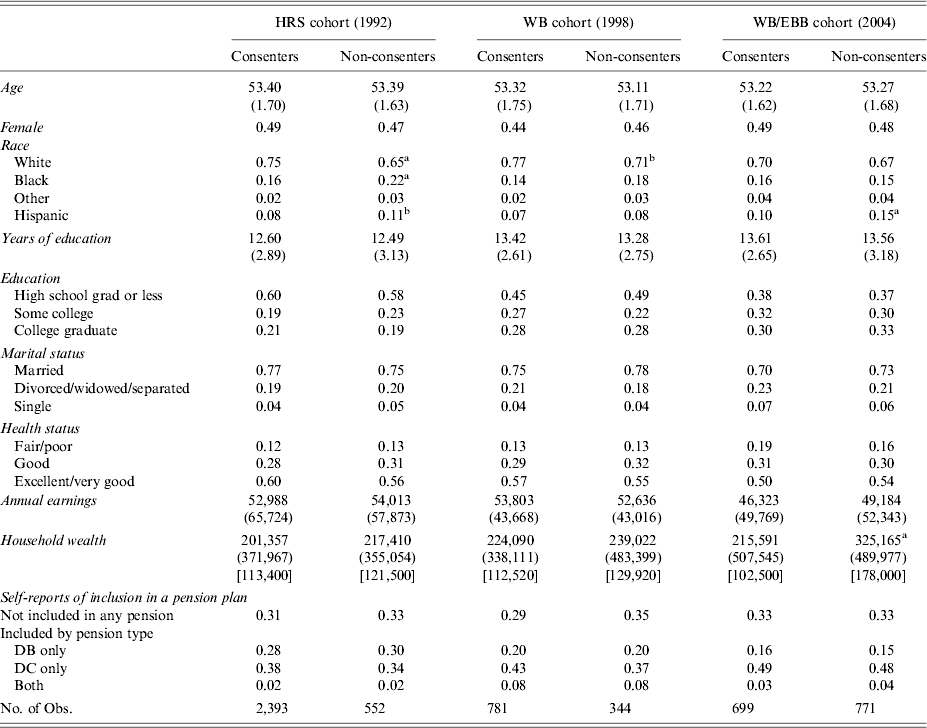
One pertinent issue is whether the samples of consenters are representative of the overall samples for each cohort. Haider and Solon (Reference Haider and Gary2000) conclude that, based on survey respondents’ observed characteristics, members of the original HRS cohort who consented to the matching of their administrative earnings records are a representative sample. Bricker and Engelhardt (Reference Bricker and Engelhardt2008) also report similar results for the HRS cohort, as well as for both the WB and EBB cohorts. We find only negligible differences when comparing the observable characteristics of consenters in our sample with non-consenters (Table A2). Specifically, in the HRS and WB cohorts, consenters, compared to non-consenters, are marginally more likely to be white. In the EBB cohort, consenters are less likely to be Hispanic, and have lower levels of household wealth than non-consenters.Footnote 13 We also compare the survey reports of consenters and non-consenters regarding their inclusion in a pension plan and their plan type. Among the respondents in the HRS cohort, we observe that consenters are almost as likely as non-consenters to report either being included in a DB plan, or in both a DB and a DC plan, or not being included in a pension plan. Consenters are only slightly more likely than non-consenters to report being included in a DC plan only. Among the respondents in the WB cohort, consenters and non-consenters are equally likely to report inclusion in a DB plan or in both plans. However, compared to non-consenters, consenters are less likely to report not being included in a pension plan, but more likely to report being included in a DC plan only. Among the respondents in the EBB cohort, consenters and non-consenters are almost equally likely to report not being included in a pension plan, or being included in a DB plan, a DC plan or in both types of plans. Based on these observable characteristics, we conclude that, for the three cohorts, our samples of consenters do not differ meaningfully from the sample of non-consenters. We, however, acknowledge that consenters and non-consenters may differ on unobservable characteristics, and that their reporting errors of DC contributions may be correlated with their likelihood of giving consents.
2.1 Social Security earning records
Social Security earnings records contain information collected from the Internal Revenue Service Form W-2 that employers file with the SSA to report salaries and benefits paid to employees. The data provide annual information on total compensation subject to federal income taxation (which includes wages, tips and other compensation), earnings that are subject to the Social Security payroll tax (FICA), generally referred to as covered earnings, earnings that are not subject to FICA (uncovered earnings), taxable income from self-employment, and tax-deferred contributions to employer-sponsored retirement accounts.Footnote 14 It should be noted that W-2 records do not contain information about whether the employer offers a DC plan or, if a plan is offered, the amount of the employer's contributions. In other words, W-2 tax-deferred contributions include employee contributions only.
Although not without their own limitations, the administrative earnings records are considered the gold standard for assessing the accuracy of the survey-reported earnings (Haines and Greenberg, Reference Haines and Greenberg2005; Gottschalk and Huynh, Reference Gottschalk and Huynh2010; Tamborini and Kim, Reference Tamborini and ChangHwan2013). As with any data, the administrative earnings records are not error free. A noteworthy limitation is that they are susceptible to missing or erroneous entries (Olson and Hudson, Reference Olson and Hudson2009; Compson, Reference Compson2011). A concern is that errors may result from employers’ incorrect reporting on W-2 forms. SSA has an elaborate set of checks to identify and correct the improperly reported information. When SSA detects errors in earnings records, employers are notified. The employers, in turn, correct these errors by submitting W-2c forms. Hence, SSA administrative earnings records are continuously updated as new and corrected earnings records are submitted by employers. Therefore, we do not believe that it is unreasonable to assume that administrative earnings records provide a closer approximation to actual earnings and tax-deferred contributions than survey reports.
As stipulated in the Internal Revenue Code, as of 1984, employee contributions to tax-deferred retirement plans are excluded from federal income taxes in the year of contribution, but are subject to the Social Security (FICA) payroll tax. As of 1990, the amount of the tax-deferred contribution is reported in a separate field in the W-2 record. This field is not included in the HRS restricted data file for 1992 consenters, but is included for respondents consenting in 1998 and 2004. Thus, for 1992 consenters with earnings below the Social Security taxable maximum, we calculate the amount of the tax-deferred contributionFootnote 15 as the difference between FICA earnings and total compensation.Footnote 16 For the 1998 and 2004 consenters the W-2 record tax-deferred contribution was included as a separate field in the data and thus we do not need to make this calculation.Footnote 17
As noted above, respondents were asked at the time of interview about the amounts they currently contribute to their accounts and the frequency of their contributions. From these reports, we calculate an annual contribution for the interview year for each cohort. Information on tax-deferred contributions in W-2 records is available only up to the year prior to the interview year in which respondents gave consents. Thus, for HRS respondents, we use the 1991 W-2 record contributions, for the WB cohort, we use the 1997 W-2 contributions, and for the EBB cohort, we use the 2003 W-2 contributions. This procedure may introduce measurement errors if respondents’ contributions differ between the two years. To estimate the extent of this potential bias, we compare 1991 and 1992 W-2 contributions for the subsample of HRS respondents (279 cases) who gave consents in 2004, and for whom we have both the 1991 and 1992 W-2 contributions. We find that, at the means, the 1991 W-2 contribution ($4,256) is not significantly different from the 1992 W-2 contribution ($4,097); the median values are $3,105 and $3,144, respectively. Furthermore, we tested whether these results were sensitive to tenure on the job. When we restrict the sample to respondents who were on the same job for three or more years (91% of the 279 cases), we find that, similarly at the mean, the 1991 W-2 contribution ($4,438) is not significantly different from the 1992 contribution ($4,215); respective median values are $3,240 and $3,275. We thus conclude that our use of W-2 record information for the year prior to the interview is unlikely to introduce significant measurement error.Footnote 18
3 Comparing respondent reports with W-2 record information
3.1 Inclusion in a pension plan and identification of pension type
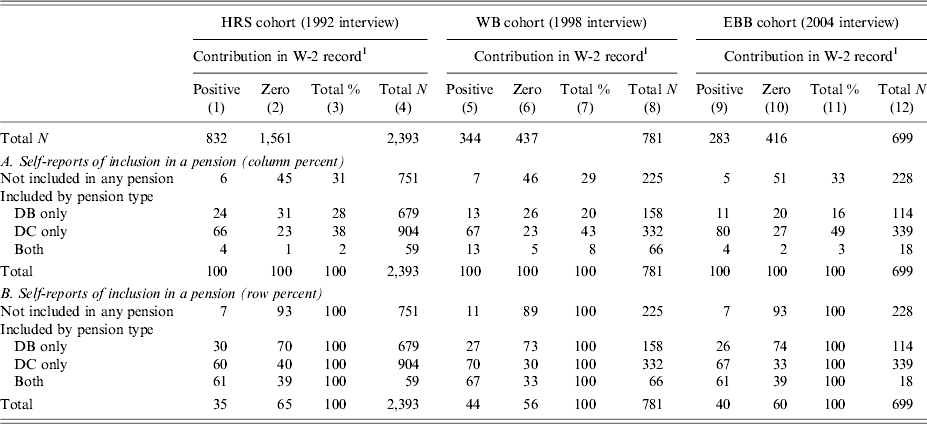
We first compare respondents’ reports regarding whether they were included in a pension plan and, if included, the type of the plan, with information in W-2 records regarding their tax-deferred contributions. This comparison provides a measure of the relative degree of misreporting among respondents in the HRS, WB, and EBB cohorts. Our sample consists of respondents with matched SSA records who reported that they were either included or not included in a pension plan (Table A1). Table 1 compares their responses with an indicator generated from employer-reported W-2 records of whether they had made a tax-deferred contribution in the previous year, evidence of inclusion in a DC plan.Footnote 19
Respondent reports at first interview regarding inclusion in a pension plan and W-2 record information on tax-deferred contributions in the previous year among respondents with matched SSA records

Notes: Authors’ calculations using data from the HRS and Social Security W-2 earnings records. Samples consist of private sector wage and salary workers ages 51–56 in 1992 (members of the HRS cohort), in 1998 (members of the WB cohort), and in 2004 (members of the EBB cohort) with matched SSA records. Numbers may not add to 100% due to rounding. We do not report ‘Don't know’ responses to the pension type question due to the small sample sizes.
1 In this table, we define the W-2 contribution as positive if there was a positive contribution in the W-2 record in the previous year, i.e., in 1991 for the HRS cohort, in 1997 for the WB cohort, and in 2003 for the EBB cohort.
Panel A indicates that among respondents with W-2 contributions in the previous year, 70% in the HRS cohort (col. 1), 80% in the WB cohort (col. 5), and 84% in the EBB cohort (col. 9) correctly reported having a DC plan only or both DC and DB plans. The accuracy rate in the more recent WB and EBB cohorts is significantly higher (at the 1% level) than that of the earlier HRS cohort.
Panel B provides information by plan type regarding the proportion of respondents in each cohort who contributed to their plans in the previous year. Among those who reported being included in a DC plan only, W-2 records confirm that 60% of members in the HRS cohort, 70% in the WB cohort, and 67% in the EBB cohort contributed to their plans in the previous year (cols. 1, 5, and 9). Comparable rates for respondents reporting inclusion in both DC and DB plans are 61% in the HRS and EBB cohorts and 67% in the WB cohort.Footnote 20 Among those who self-reported being included in a DB plan only, non-trivial proportions – about 27% in the three cohorts – have in fact contributed to DC plans as confirmed by the W-2 records. Overall, compared to respondents in the HRS cohort, significantly higher proportions of respondents in the two younger cohorts (WB and EBB) made contributions to DC plans in the reference period (44% in the WB cohort and 40% in the EBB cohort compared to 35% in the HRS cohort, last row in Panel B).Footnote 21 This finding confirms our expectation that, as DC plans became more prevalent over the past 3 decades, more recent cohorts were not only more likely to contribute to these plans but were also more likely to correctly identify such plans. Finally, it is worth noting that in each of the three cohorts, the percentage of respondents reporting being included in at least a DC plan exceeded the proportion of those who had in fact contributed to a plan (total percent column in Panel A compared to the last row in Panel B). In sum, these findings suggest that researchers using survey-reported information are likely to overestimate participation in DC plans.
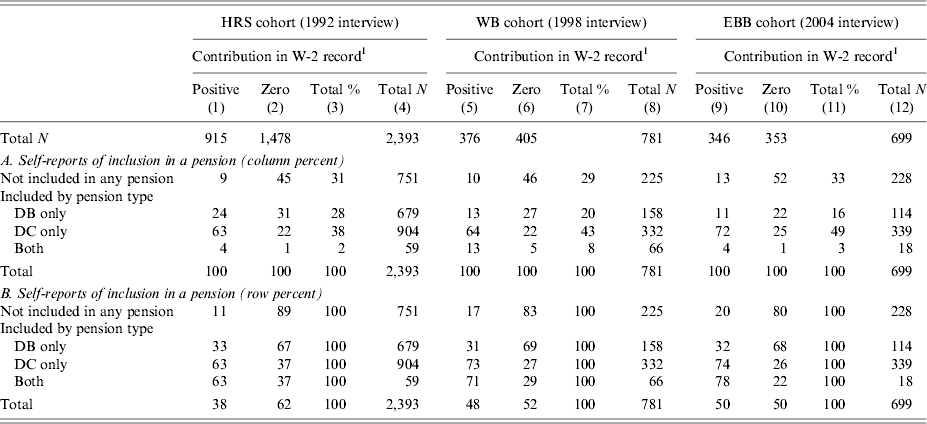
To account for the possibility of respondent error in reporting the timing of contributions (the reference period), we examine the W-2 contributions made in any of the three years prior to the interview year (Table 2). When allowing for this expanded reference period, the proportion of respondents with contributions in any of the previous three years increased to 38%, 48%, and 50%, respectively, for the HRS, WB, and EBB cohorts (last row in Panel B). In addition, the differences in the proportions of respondents with contributions between the HRS cohort and the two younger cohorts increased to 10 and 12 percentage points compared to nine and five percentage points in Table 1. Table 2 also indicates that when allowing for this expanded reference frame, the proportions of respondents in the HRS cohort who reported having a DC plan only or both DC and DB plans, consistent with positive contributions in W-2 records, increased by only three and two percentage points, respectively (Panel B, col.1); in the WB cohort, the proportion increased by three and four percentage points, respectively (Panel B, col. 5). This finding suggests that, for these two cohorts, any error regarding the reference period would be relatively small. In contrast, in the EBB cohort, the proportions increased by seven and 17 percentage points, respectively, for those reporting a DC only or both types of plans (Panel B, col. 9). This suggests that respondents in the EBB cohort are more likely to have contributed to a DC plan in the previous three years, and that allowing for this expanded reference period would lead to a larger difference regarding their inclusion in DC plans compared to the HRS cohort.
Respondent reports at first interview regarding inclusion in a pension plan and W-2 record information on tax-deferred contributions in any of the previous three years among respondents with matched SSA records

Notes: Authors’ calculations using data from the HRS and Social Security W-2 earnings records. Samples consist of private sector wage and salary workers ages 51–56 in 1992 (members of the HRS cohort), in 1998 (members of the WB cohort), and in 2004 (members of the WB/EBB cohort) with matched SSA records. Numbers may not add to 100% due to rounding. We do not report the ‘Don't know’ responses to the pension type question due to the small sample sizes.
1 In this table, we define the W-2 contribution as positive if there was a positive contribution in the W-2 record in any of the previous three years, i.e., in either 1989, 1990, or 1991 for the HRS cohort, in either 1995, 1996, or 1997 for the WB cohort, and in either 2001, 2002, or 2003, for the EBB cohort.
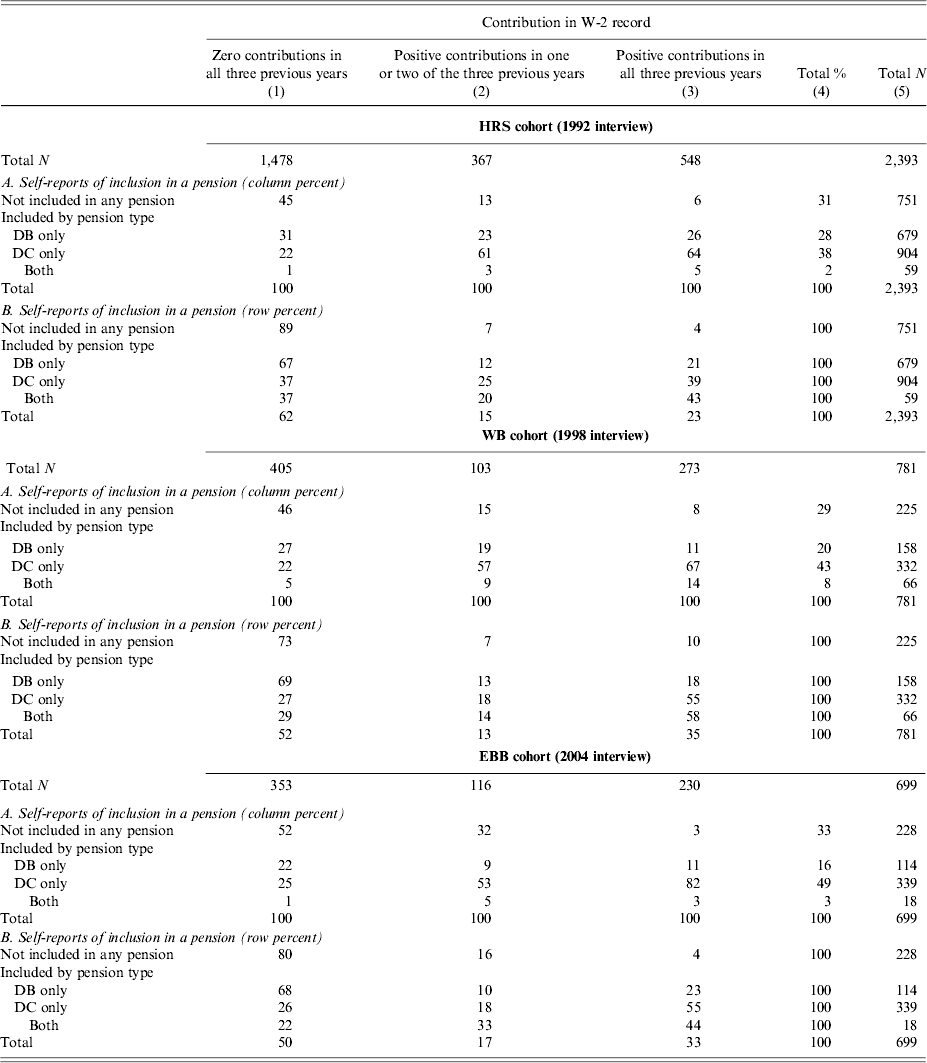
Table 3 provides additional information regarding the pattern of contributions in the three years prior to the survey interview. Panel B indicates that among the respondents in the HRS cohort who reported being included in a DC plan only, 39% contributed to their plans in all three previous years (col. 3), and 25% contributed in only one or two of the previous 3 years (col. 2). The remaining 37% of the HRS respondents did not contribute in any of the previous 3 years (col. 1). Among respondents in the WB and EBB cohorts who reported being included in a DC plan only, similar proportions (55%) had contributed to their plans in all three previous years, and an additional 18% had contributed in either one or two of the three previous years (Panel B for each cohort). The remaining 27% of respondents did not contribute in any of the previous 3 years. The larger proportions of respondents with positive contributions in all three previous years in the younger two cohorts – 55% in the WB and EBB cohorts compared to 39% in the HRS cohort – reveal that these younger cohorts are more likely to contribute to a DC plan on a regular basis. As Table 1 indicates, they are also more likely to participate in (i.e., contribute to) a DC plan.
W-2 tax-deferred contributions in the previous three years by self-reported inclusion in a pension plan among respondents with matched SSA records

Notes: Authors’ calculations using data from the HRS and Social Security W-2 earnings records. Samples consist of private sector wage and salary workers ages 51–56 in 1992 (HRS cohort), and of the same ages in 1998 (WB cohort) and in 2004 (EBB cohort) with matched SSA records. Numbers may not add to 100% due to rounding. We do not report the ‘Don't know’ responses to the pension type question due to the small sample sizes. Percent values may not add to 100 due to rounding.
Among respondents reporting a DB plan only, approximately one-third in each cohort had positive W-2 contributions in at least one of the three previous years (the sum of columns 2 and 3 in Panel B, in the second row for each cohort). Of those, 21% in the HRS cohort, 18% in the WB cohort, and 23% in the EBB cohort had positive W-2 contributions in all 3 years (col. 3), clear evidence of inaccurate reporting of plan type. It is also noteworthy that even among respondents who made tax-deferred contributions in all three previous years, only 69% in the HRS cohort, 81% in the WB cohort, and 85% in the EBB cohort correctly identified having a DC plan (Panel A, column 3). These findings indicate that a non-trivial proportion of respondents, particularly those in the oldest cohort, who have contributed to a plan for a relatively extended period, may still misreport their plan type.
3.2 Contributions to DC plans
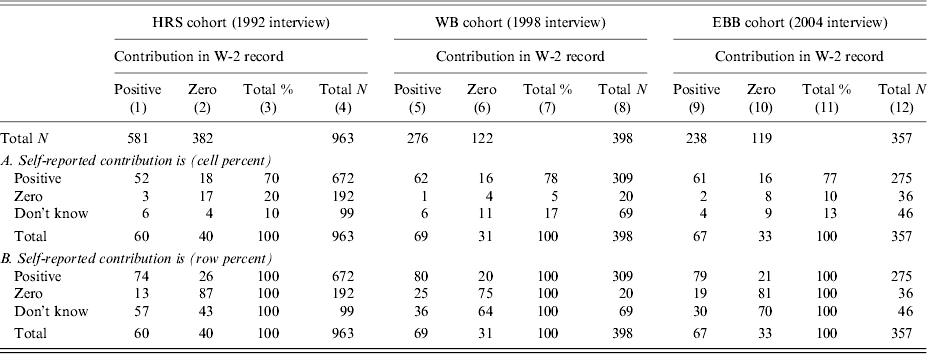
We now use the information on tax-deferred contributions in W-2 records to examine the accuracy of respondents’ reports regarding their contributions to DC plans. Our samples consist of the respondents in Table 1 who reported that they were included in at least a DC plan. Table 4 reports the joint distributions of tax-deferred contributions (whether positive or zero) as reported by respondents and as indicated in the W-2 records for the previous year. Panel A indicates that less than about one-fifth of respondents in each of the three cohorts (21%, 17%, and 18%, respectively)Footnote 22 misreported their contribution status at the interview, while 10%, 17%, and 13%, respectively in each cohort (row 3), reported that they did not know the value of their contributions. In the HRS cohort, 52% correctly identified a positive contribution compared to 62% in the WB cohort and 61% in the EBB cohort. An additional 17% of respondents in the HRS cohort, 4% in the WB cohort, and 8% in the EBB cohort, accurately identified a zero contribution.
Respondent-reported DC plan contributions at first interview and W-2 record contributions in the previous year, among respondents who report being included in a DC plan

Notes: Authors’ calculations using data from the HRS and Social Security W-2 earnings records. Samples consist of private sector wage and salary workers ages 51–56 in 1992 (members of the HRS cohort), in 1998 (members of the WB cohort), and in 2004 (members of the EBB cohort), who report inclusion in at least a DC plan (either a DC plan only or both DC and DB plans) for whom a matched SSA record is available. Numbers may not add to 100% due to rounding.
Among respondents who reported that they had contributed to their plans (Panel B, row 1), a substantial proportion in each cohort (26%, 20%, and 21%, respectively) did not in fact contribute in the previous year according to W-2 records.Footnote 23 This finding suggests that these employees’ projections of their DC wealth at retirement, as well as researchers’ projections based on survey reports, are likely to over-estimate realized wealth. Conversely, among respondents who reported that they did not contribute to their plans (Panel B, row 2), 13% in the HRS, 25% in the WB cohort, and 19% in the EBB cohort had in fact contributed to their plans in the previous year according to W-2 records suggesting that, for these employees, projected DC wealth at retirement will be an under-estimate of the realized wealth. Overall, these findings suggest that, for the majority of respondents who misreported contributions, projected DC wealth at retirement will be an overestimate of the realized wealth.
Finally, Table 4 provides information from W-2 records on the proportions of respondents who in fact contributed to their plans in the year prior to the interview. The last row of columns 1, 5, and 9 indicates that among respondents with matched W-2 records who reported that they were included in DC plans, only 60% in the HRS cohort, 69% in the WB cohort, and 67% in the EBB cohort had positive contributions according to W-2 records.Footnote 24 These relatively low participation rates may reflect either the respondents’ decisions not to contribute to their plans on a regular basis or their misidentification of their plans as DC plans.Footnote 25
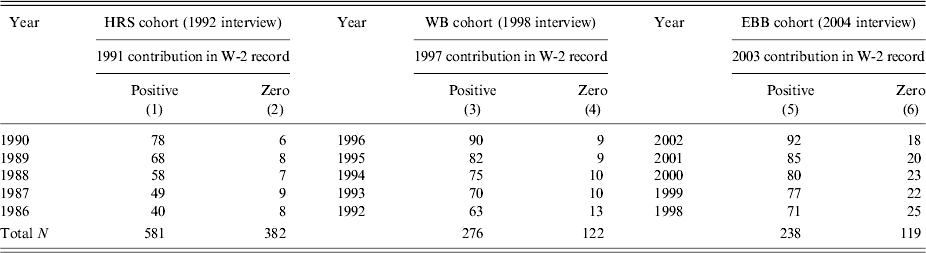
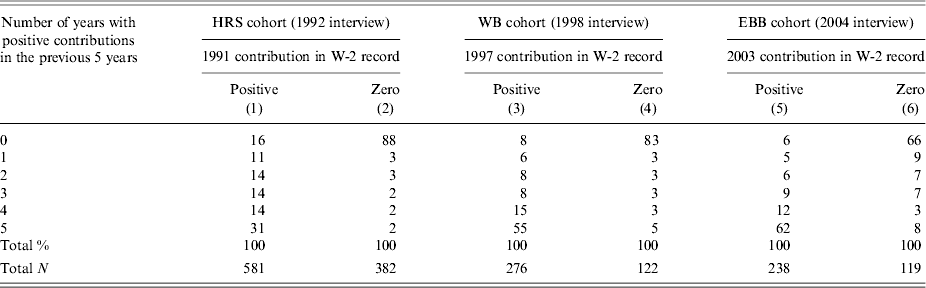
To distinguish between these two alternatives, we examine contributions over an extended time frame. Table 5 indicates a fairly high degree of consistency in the respondents’ actual contribution patterns as revealed in W-2 records. Among the HRS respondents who contributed in 1991 (col. 1), 78% had also contributed in 1990. Among the WB respondents who contributed in 1997 (col. 3) and the EBB respondents who contributed in 2003 (col. 5), 90 and 92%, respectively, had also contributed in the previous year. Furthermore, Table 6 also indicates that among respondents in the HRS cohort who contributed to their plans in 1991 (col. 1), 31% had contributed in all previous 5 years (row 6), and an additional 14% (row 5) had contributed in four of the preceding 5 years. In contrast, 16% of respondents had not contributed in any of the previous 5 years (row 1). The pattern of fairly regular annual contributions is even more pronounced in the WB and EBB cohorts: 55% and 62%, respectively, in each cohort had contributed in all five years prior to the interview (Table 6, row 6), and an additional 15 and 12% (row 5) had contributed in four of the 5 years prior to the interview. Only 8% and 6% of the respondents in each of the younger two cohorts had not contributed in any of the previous 5 years (row 1).
Proportions (%) of respondents with positive contributions in any of the previous five years, by contribution status in 1991, 1997, or 2003, among respondents who reported having a DC plan

Source: Authors’ calculations using W-2 earnings records. See notes in Table 4.
Contribution patterns in the five years prior to 1991, 1997, or 2003, by contribution status in 1991, 1997, or 2003, among respondents who reported having a DC plan

Source: Authors’ calculations using W-2 earnings records. See notes in Table 4.
Tables 5 and 6 provide additional evidence that many respondents are likely to have misreported their plan type. Among the respondents who, according to W-2 records, did not contribute to their plans in the HRS cohort in 1991 and in the WB cohort in 1997, relatively small proportions of them (less than 10% and 13%, respectively) had contributed in any of the previous 5 years (Table 5, cols. 2 and 4). Among the respondents who did not contribute to their plan in 2003 in the EBB cohort, somewhat larger but still relatively small proportions had contributed in any of the previous 5 years (less than 25%, col. 6). Table 6 also indicates that among the respondents who did not contribute in 1991 in the HRS cohort and in 1997 in the WB cohort, 88% and 83%, respectively, had not contributed in any of the previous 5 years (cols. 2 and 4). In the EBB cohort, 66% of respondents who did not contribute in 2003 had not contributed in any of the preceding 5 years (col. 6). This evidence suggests that these respondents were unlikely to have been enrolled in a DC plan and simply either incorrectly identified their plan type as a DC plan or incorrectly reported being included in a pension plan. Overall, these findings suggest that the potential for respondent misreporting of plan type should be taken into consideration when survey information is used to evaluate the role of pensions in retirement outcomes.Footnote 26
3.3 Contribution amounts: self-reported values and W-2 record information
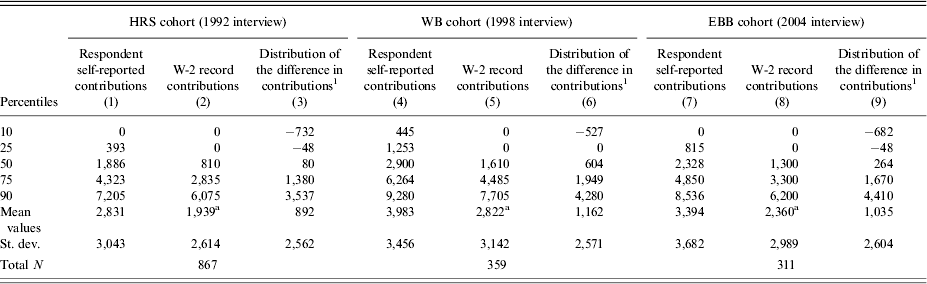
In the previous section, we examined the accuracy of respondents’ reports regarding whether they had contributed to a DC plan. We now turn to a comparison of self-reported contributions with amounts in W-2 administrative records among the respondents who indicated that they were included in DC plans and for whom both self-reported and W-2 contribution information is available. Table 7 reports univariate distributions of annual self-reported contributions (cols. 1, 4, and 7) and of annual W-2 contributions (cols. 2, 5, and 8). Columns 3, 6, and 9 report distributions of the difference between self- and W-2-reported contributions measured at the individual level (all monetary values are expressed in 2003 dollars).Footnote 27
Distribution of tax-deferred contributions (in $2003) as reported by respondents and in W-2 records among respondents for whom both self-reported and W-2 contributions are available

Notes: Authors’ calculations using data from the HRS and Social Security W-2 earnings records. Samples consist of private sector wage and salary workers ages 51–56 who report being included in at least a DC plan and for whom both the self-reported and W-2 contributions are available (either zero or positive). These samples exclude respondents with earnings above the Social Security taxable maximum and respondents with W-2 tax-deferred contributions above the maximum amount for the respective year. In all three cohorts, self-reported contributions are as reported at the interview and W-2 contributions are from the previous year (1991 for the HRS cohort, 1997 for the WB cohort, and 2003 for the EBB cohort); see text discussion.
1 The difference in contributions is measured as the respondent's self-reported minus W-2 record contribution.
a Denotes that the difference at the means between self-reported and W-2 record contributions is significant at the 1% level in each cohort.
Table 7 indicates that among the respondents in the HRS cohort, self-reported contributions exceed W-2 record contributions throughout the two distributions (cols. 1 and 2). The median self-reported contribution ($1,886) is more than twice as large as the W-2 contribution ($810). The mean self-reported contribution is $2,831, compared to the W-2 contribution of $1,939. This difference of $892 is statistically significant at the 1% level and is 46% of the mean W-2 contribution. Similarly, in the younger cohorts, self-reported contributions exceed W-2 contributions. In the WB cohort (cols. 4 and 5), the median self-reported contribution ($2,900) is 80% larger than the W-2 contribution ($1,610). The difference in mean values (of $1,162) is 29% of the mean W-2 contribution ($3,983) and is significant at the 1% level. In the EBB cohort (cols. 7 and 8), the median self-reported contribution ($2,328) is 79% larger than the W-2 contribution ($1,300). The difference in mean values (of $1,035) is 30% of the mean W-2 contribution of $3,394 and is significant at the 1% level.Footnote 28
Columns 3, 6, and 9 in Table 7 present the distributions of the difference between self-reported and W-2 contributions at the individual level. Column 3 indicates that there are substantial differences in the HRS cohort, ranging from −$732 at the 10th percentile (self-reported amount smaller than W-2 contribution) to $3,537 at the 90th percentile (self-reported amount greater than W-2 contribution). Similarly, in the WB cohort (col. 6), the difference increases from −$527 at the 10th percentile to $4,280 at the 90th percentile; respective values in the EBB cohort are −$682 and $4,410 (col. 9). The differences at the means between the self-reported and the W-2 record contributions are significant at the 1% level in each cohort. The magnitude of the reporting error of respondents in the HRS cohort is significantly larger at the mean (at the 10% level) from that of respondents in the WB cohort, but not significantly different compared to the EBB cohort.Footnote 29 This pattern of error in reported contribution values is a matter of concern for public policy, especially because 50% of respondents report contribution values that are considerably larger than their actual contributions. The magnitude of these reporting errors suggests that conclusions drawn from survey information alone are likely to result in upward-biased estimates of participation rates, contribution amounts, and projected account balances at retirement. This potential error may encourage researchers and policy makers to forecast a more positive picture regarding retirement preparedness than is warranted. Furthermore, many respondents may be surprised by their lower realized account balances at retirement.
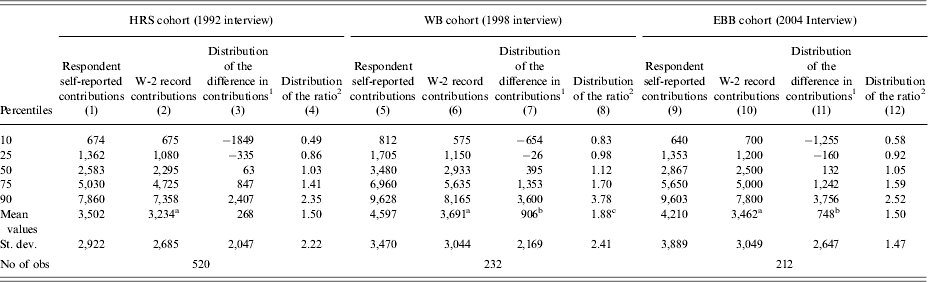
We now assess the degree of accuracy in reporting annual contributions among respondents who said they were included in a DC plan and whose W-2 records indicate a positive contribution in the year prior to the interview (Table 8). Self-reported contributions of respondents in this sample may be either positive or zero. Respondents with positive contributions in W-2 records, representing 60% of respondents in the HRS cohort, 69% in the WB cohort, and 67% in the EBB cohort (as reported in Table 4), are considerably more accurate than respondents in the broader samples reported in Table 7. In the HRS cohort, the difference in the mean self-reported and W-2 record contribution is $268 in this more selective sample, compared to $892 in the broader sample. In the WB cohort, comparable values are $906 and $1,162. In the EBB cohort, these values are $748 and $1,035, respectively. Among respondents in the HRS cohort, self-reported and W-2 values (cols. 1 and 2) are remarkably similar throughout the two distributions, a difference of about $300 up to and including the 75th percentile, increasing to $500 at the 90th percentile. A somewhat different pattern emerges among respondents in the WB and EBB cohorts (cols. 5, 6, 9, and 10). In the WB cohort, the difference between self-reported and W-2 contributions increases monotonically from $237 at the 10th percentile to $1,463 at the 90th percentile; in the EBB cohort, the difference increases from $60 to $1,803.
Distribution of tax-deferred contributions (in $2003) among respondents with positive contributions in W-2 records

Notes: Authors’ calculations using data from the HRS and Social Security W-2 earnings records. Samples consist of private sector wage and salary workers ages 51–56 who report being included in at least a DC plan and for whom W-2 contributions are positive whereas self-reported contributions are either positive or zero. These samples exclude respondents with earnings above the Social Security taxable maximum and respondents with W-2 tax-deferred contributions above the maximum amount for the respective year. In all three cohorts, self-reported contributions are as reported at the interview and W-2 contributions are from the previous year (1991 for the HRS cohort, 1997 for the WB cohort, and 2003 for the EBB cohort).
1 The difference in contributions is measured as the respondent's self-reported minus W-2 record contribution.
2 The ratio is calculated as the absolute difference in contributions (self-reported minus W-2 record) relative to the W-2 record contribution.
a Denotes that the difference at the means between self-reported and W-2 record contributions is significant at the 1% level in each cohort.
b Denotes that the difference in the mean values between columns 3 and 7, and columns 3 and 11, is significant at the 5% level.
c Denotes that the difference in the mean values between columns 4 and 8 is significant at the 10% level.
Table 8, columns 3, 7, and 11, compare self-reported and W-2 contributions for the same individual. At the medians, the differences between self-reported and W-2 record contributions in the HRS and EBB cohorts are relatively small ($63 and $132, respectively), but considerably larger in the WB cohort ($395). The differences between mean self-reported and W-2 contributions are significantly larger in the WB and EBB cohorts ($906 and $748) than in the HRS cohort ($268). In all three cohorts, the differences between self-reported and W-2 contributions in the lower (upper) percentiles of the distributions in Table 8 are larger (smaller) than the respective differences in the broader sample (Table 7).
Columns 4, 8, and 12 present distributions of the reporting error measured as the ratio of the absolute difference in contributions (self-reported minus W-2 contribution) relative to the W-2 record contribution. In the three cohorts, the relative reporting error increases systematically from approximately one-half of the W-2 contribution at the 10th percentile to more than twice the W-2 contribution at the 90th percentile. Thus, while the mean difference between the self-reported and the W-2 contributions is significantly larger in both the WB and EBB cohorts than in the HRS cohort (at the 5% level), the reporting error relative to W-2 contributions is significantly larger only in the WB cohort (at the 10% level).
Table 8 also reveals that at the mean, the self-reported contributions are significantly larger in the WB and the EBB cohorts than in the earlier HRS cohort. The mean self-reported contribution in the WB and EBB cohorts is $4,597 and $4,210, respectively, compared to $3,502 in the HRS cohort (differences significant at the 1% level). In addition, the mean W-2 record contribution in the WB cohort is $3,691 compared to $3,234 in the HRS cohort (this difference is significant at the 5% level); the mean W-2 record contribution in the EBB cohort is not significantly larger than in the HRS cohort.
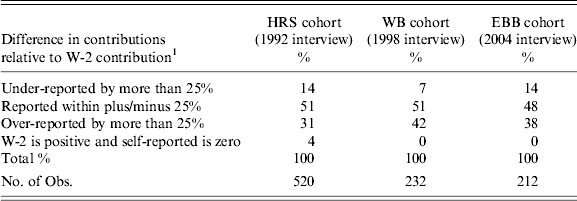
Table 9 provides an additional measure of the accuracy of respondents’ reports of annual contributions using the same sample as in Table 8 (respondents with positive contributions in W-2 records). We classify the respondents by an alternative measure of reporting accuracy: whether their reported contributions are either above 25%, or below 25%, or within plus or minus 25% of their W-2 record contribution. The reported contributions of roughly one-half of respondents in all three cohorts fall within the plus or minus 25% category. Approximately one-third of respondents (31, 42, and 38%, respectively) over-reported their contributions by more than 25% of their W-2 contributions, and less than 15% under-reported their contributions by more than 25%. A small proportion (4%) of respondents in the HRS cohort reported zero contributions when W-2 records indicated a positive contribution.
Accuracy of self-reported contributions among respondents with positive contributions in W-2 records

Note: See notes in Table 8.
1 The difference in contributions is measured as the respondent's self-reported minus W-2 record contribution.
Lastly, we estimate an OLS regression model, separately for each cohort and on the pooled sample, of the relationship between the relative magnitude of the error in respondents’ reports of contribution amounts and a number of demographic, job and plan characteristics, earnings, household wealth, financial planning, risk aversion measures, and expected years to retirement. We measure reporting error as the absolute value of the difference between self-reported and W-2 record contributions relative to the larger of the two values.Footnote 30
Overall, most of the estimated coefficients for each cohort and for the pooled sample are not significant.Footnote 31 In all of the three cohorts, the contribution reporting error is not systematically related to demographic and job-related characteristics. There are a few exceptions to this pattern. In the WB cohort, respondents with more than 6 years of tenure on the job, and respondents in the EBB cohort with more than 16 years of tenure, had 10% and 19% lower reporting errors compared to those with less than 6 years of tenure. This finding is true in the pooled sample as well. Surprisingly, college graduates in the HRS cohort have a higher reporting error (by 8%) than those with a high school degree or less. Among respondents in the EBB cohort, those who expected to retire in the next 7 to 12 years, and those with more than 12 years to retirement had smaller reporting errors (by 16% and 18%, respectively) than those who expected to retire within 6 years. Expected time to retirement is not an important factor with respect to the magnitude of reporting errors among members of the HRS and WB cohorts, or in the pooled sample. The reporting error is larger among respondents with account balances of less than $10,000, compared to those with balances of $10,000 to $49,999, in the HRS and WB cohorts (by about 13%) and in the pooled sample (by 8%), but not in the EBB cohort. Lastly, regression estimates of the relative size of the reporting error in the pooled sample of the three cohorts reveal that there may be unobserved differences between the HRS and WB cohorts, as indicated by the significant negative coefficient on the WB cohort indicator (a 5% smaller reporting error than in the HRS cohort). In contrast, the reporting error for the EBB cohort does not significantly differ from that of the HRS cohort.
4 Implications of reporting errors for account balances at retirement
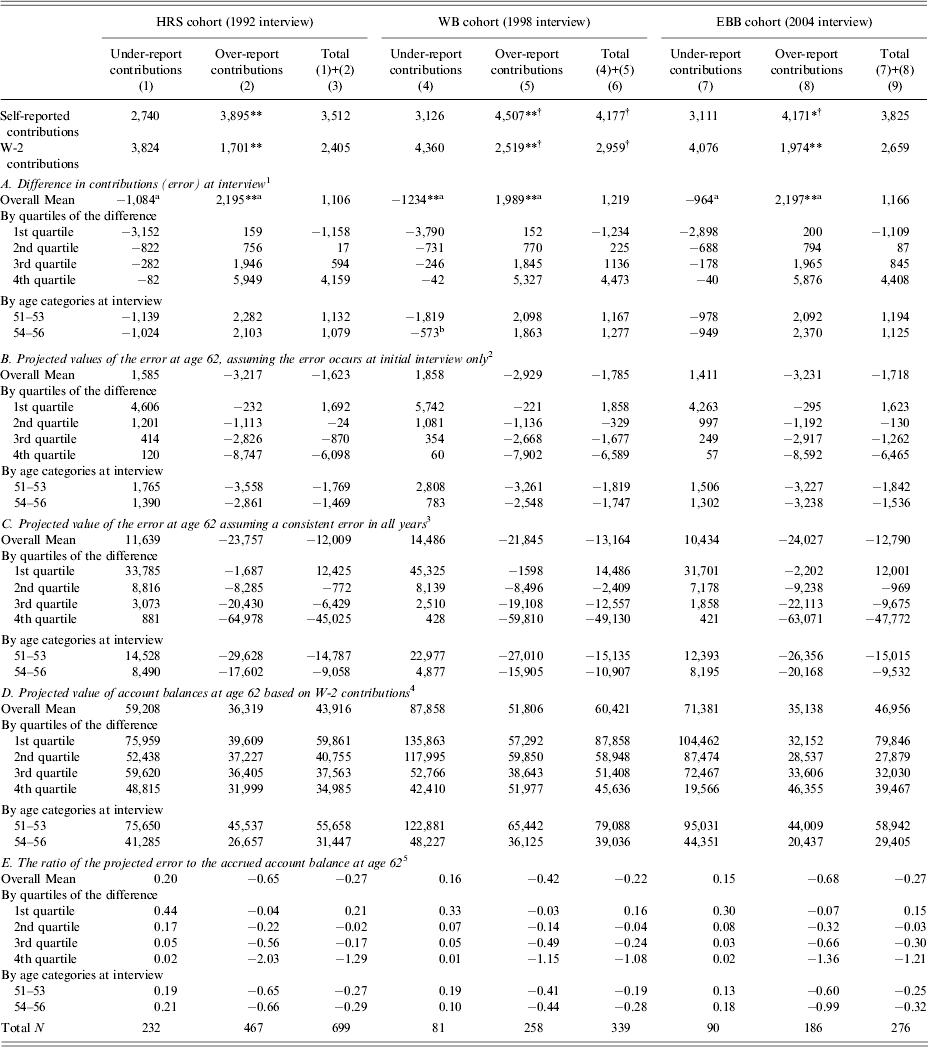
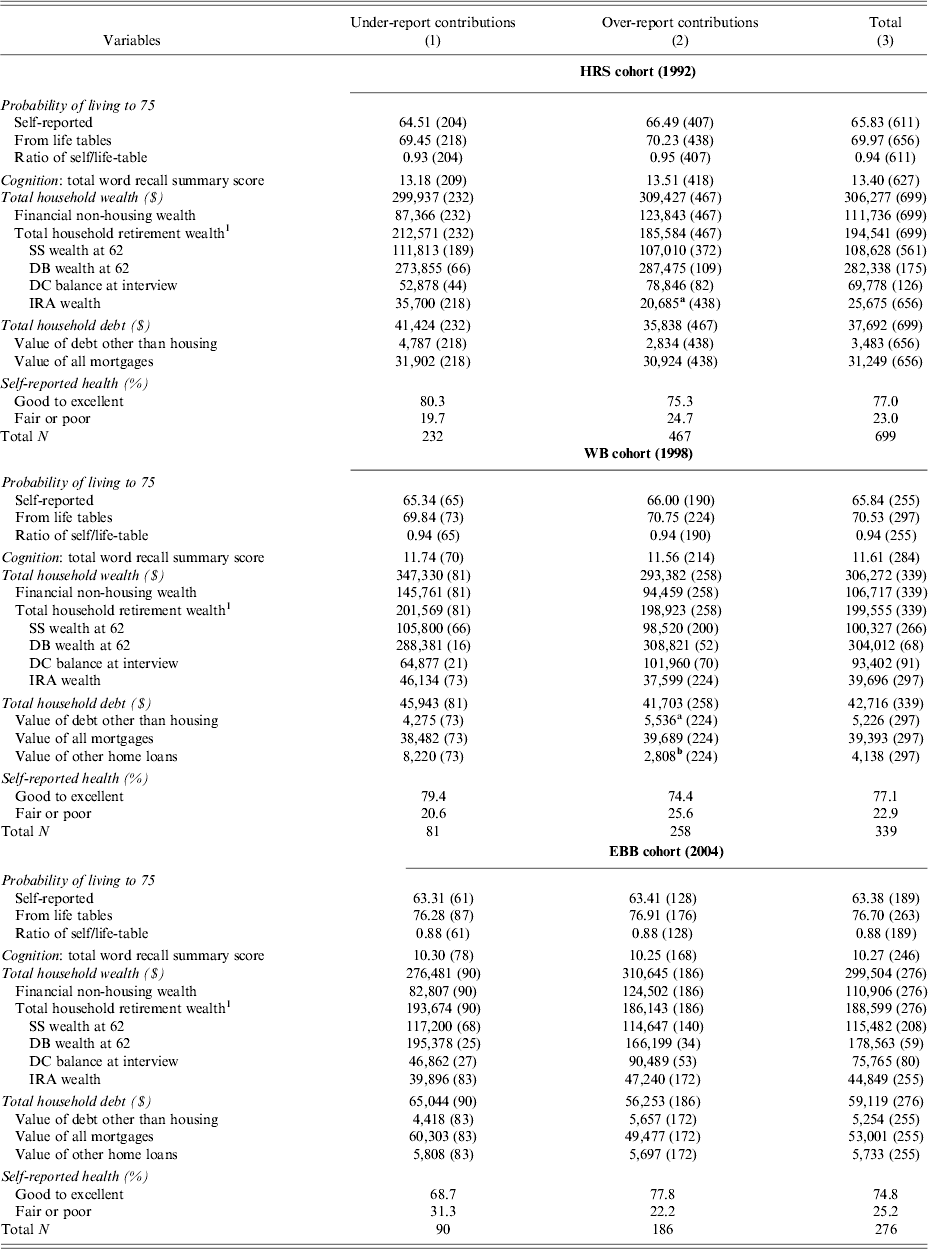
To gauge the magnitude of the respondent reporting error at retirement (assumed at age 62 for this calculation), we divide the overall samples for each cohort in Table 7 into two subsamples, those who under-reported and those who over-reported their contributions, and present the results in Table 10. In all the three cohorts, nearly twice as many respondents over-reported contributions than under-reported them. Furthermore, those who over-reported contributions have significantly smaller W-2 contributions (and larger self-reported contributions) than those who under-reported contributions. As a result, the magnitude of the error (the difference between self-reported and W-2 contributions) in absolute terms is almost twice as large among respondents over-reporting their contributions than those under-reporting them.
Mean values (in $2003) of the error in reported annual contributions at interview, its projected value at age 62, and the ratio of the error to the accrued account balances, separately for under- and over-reporters, by quartiles of the error and by age

Notes: See notes in Table 7. Samples in this table consist of respondents who either over- or under-reported their contributions at the initial interview.
1 The difference in contributions is measured as the respondent's self-reported contribution at the interview minus the W-2 record contribution.
2 We assume that the reporting errors occur only at the initial interview year and respondents attain accurate knowledge of their contributions in the following years. The projected values at age 62 are generated taking into account respondents age at the interview and assuming that contributions are invested in an equally-weighted portfolio of stocks and bonds, with a real rate of return of 4.5% (the average of historical real rates of return of 6.5% of stocks and of 2.4% of the 10-year Treasury notes). The positive sign of projected values at age 62 indicates that respondents' account balances will be larger than expected (i.e., they under-reported their contributions), whereas a negative sign indicates that respondents' account balances will be smaller than expected (i.e., they over-reported their contributions).
3 In this scenario we assume respondents do not become more accurate regarding their annual contributions and continue to make identical errors for each year following the interview year up to age 62.
4 Projected values of account balances at age 62 using respondents' own annual contributions in the W-2 records (in real dollars) from the year of the initial interview to the year they reach age 62. For respondents in the HRS cohort with missing W-2 records after 1992, respondents in the WB cohort with missing W-2 records after 1997, and respondents in the EBB cohort with missing W-2 records after 2003, we assume a 1% increase in contributions from the base year (1991, 1997, or 2003, respectively) and thereafter.
5 For each respondent we calculate the ratio of the projected error at age 62 (as in Panel C) to the projected value of contribution accruals at age 62 (as in Panel D).
* and ** denote that the difference in contributions between under- and over-reporters within each cohort is significant at the 5% and 1% levels, respectively.
a Denotes that the difference at the mean between self-reported and W-2 contributions within each subgroup is significant at the 1% level.
b Denotes that the reporting error between the two age groups within each subgroup is significant at the 1% level.
† Denotes that the differences between the HRS cohort and either the WB or the EBB cohort (columns 1 vs. 4, or 1 vs. 7; and 2 vs. 5, or 2 vs. 8; and 3 vs. 6, or 3 vs. 9) are significant at the 5% level.
In all the three cohorts, among respondents over-reporting contributions, one-quarter over-reported by nearly $6,000, about three times the group's average W-2 contribution (Panel A, columns 2, 5, and 8, in the 4th quartile row). This error, assuming it occurs only in the interview year and that respondents attain accurate information regarding their contributions in the following years, will result in an unanticipated shortfall at age 62 of roughly $8,000 to $8,800 (the projected value of the error in Panel B).Footnote 32 However, if we assume that respondents do not become more accurate regarding their annual contributions and continue to make the same reporting error in future years, the unanticipated shortfall at age 62 will amount to roughly $60,000 to $66,000 (Panel C). Among respondents who under-reported contributions, one-quarter in each cohort under-reported by roughly $2,900 to $3,800 (Panel A, columns 1, 4, and 7, in the 1st quartile row). This error would result in an unanticipated windfall at age 62 of roughly $4,300 to $5,800 when assuming the error occurs only at the initial interview (Panel B). The unanticipated windfall will be considerably larger, of course, when assuming the same reporting error in all future years (roughly $32,000 to $45,000, Panel C).
Overall, among respondents who over-reported their contributions, the shortfall due to the reporting error will, at the mean, amount to 65% of the accrued account balances among respondents in the HRS cohort, 42% for those in the WB cohort, and 68% for those in the EBB cohort (Panel E, cols. 2, 5, and 8, respectively). Among respondents in the HRS, WB, and EBB cohorts who under-reported their contributions, the windfall will amount to 20%, 16%, and 15%, respectively, of their accrued account balances at retirement.
Table 10 reveals another interesting pattern. Contrary to our expectations, the magnitude of the error does not significantly decrease with age (with the exception of WB respondents who under-reported their contributions), suggesting that older respondents are no more accurate in their assessments of their contributions than are the younger respondents (Panel A). The projected values of the errors are not negligible (Panels B and C), particularly among younger respondents who over-reported their contributions.Footnote 33
5 Conclusion
We utilize information in SSA W-2 earnings records to examine how accurately respondents in the HRS reported their inclusion in DC pension plans and their annual contributions to these plans. We examine whether more recent cohorts of respondents, whose participation rates in such plans are significantly higher than those of the earlier cohorts, are better informed. We use three samples representing the original HRS cohort interviewed in 1992 at ages 51–56, the WB interviewed in 1998 at ages 51–56, and EBB cohort at the same ages interviewed in 2004.
Our analysis indicates that respondents in the two younger cohorts were more likely to report correctly whether they were included in DC plans, but were not more accurate than the earlier cohorts when reporting whether they had recently contributed to their plans. While the reporting error, measured as the difference between respondents’ self-reported and W-2 contributions, is larger in the WB and EBB cohorts than in the HRS cohort, the absolute error relative to W-2 contributions is identical in the HRS and EBB cohorts (1.5% at the means), but slightly larger for the WB cohort (1.88% at the mean).
Of greater concern is our finding that in all three cohorts, about two-thirds of respondents who had contributed to their plans, significantly overestimated their annual contributions and thus are likely to experience smaller than expected account balances at retirement. The shortfall at the overall means in the three cohorts are likely to amount to 42% of accrued account balances in the WB cohort and about 68% in the HRS and EBB cohorts. This in turn is likely to have significant implications not only for sustaining their consumption levels in retirement, but perhaps also on the timing of their retirement, assuming that respondents’ retirement plans are based on these overstated savings.
Overall, these findings suggest that researchers using survey reports are likely to over-estimate not only participation in DC plans but also the savings that respondents are likely to accumulate in these accounts. Thus, researchers should err on the side of caution when making policy recommendations based on this information. The magnitude of this error is of particular concern for public policy because balances in DC plans are likely to constitute for many employees, especially those in more recent cohorts, the largest component of their retirement wealth. Our conclusions thus substantiate ongoing efforts, both public and private, to increase saving in tax-deferred pensions and to enhance financial literacy in the general population.
Appendix
Sample sizes of consenters ages 51–56 in the Health and Retirement Study (HRS)

Mean values of selected characteristics of the consenters in our analysis sample and of non-consenters, by cohort