I. INTRODUCTION
Ta–W alloy is a kind of Ta-based solid-solution strengthened refractory alloy, which is widely used in high-tech applications, such as power, aerospace, and nuclear engineering. Reference Trillo, Esquivel, Murr and Magness1–Reference Schwartz, Lassila and LeBlanc7 To get the demand properties in products, it is important to correlate deformation structures and orientation in Ta–W alloys and study the evolution of the deformation structures during plastic processing. Ta–W alloy with body-centered cubic (bcc) crystal structure has high stacking fault energy. It has been found that in medium to high stacking fault energy metals, such as most bcc metals and face-centered cubic (fcc) metals (Al, Ni, et al.), a large density of dislocations can be produced and stored in materials during plastic deformation. Reference Li, Cao, Liu and Liu8–Reference Wert, Liu and Hansen10 The majority of these stored dislocations would form boundaries of cells or subgrains other rather random structures. It has been observed that these dislocation boundaries can be mainly divided into two types at different length scales. The larger scale includes long, continuous planar boundaries with a high dislocation density (sometimes called geometrically-necessary boundaries, GNBs), while the smaller scale includes the ordinary, low-density cell boundaries (sometimes called incidental-dislocation boundaries, IDBs). Reference Hughes11–Reference Hughes and Hansen15 The boundaries of microbands, shear bands, and lamellar bands are typical examples of GNBs. So far, there has been a large amount of interest in the detailed characterization of the deformation structures of fcc metals, particularly Al and Ni. Most of these researches stemmed from Niels Hansen's group. Reference Hughes11–Reference Hughes, Hansen and Bammann18 These different deformation microstructures form at different stages of plastic deformation and also depend on the orientation of the crystal with respect to the deformation coordinates. Detailed research results on the relationship between grain orientation and deformation microstructure in fcc metals have been obtained. Reference Huang and Winther19 It can be concluded that the morphology of dislocation boundary structure at low and intermediate strains can be mainly classified into three types: dislocation cells (Type 2), and extended planar boundaries parallel to (Type 1) or not parallel to (Type 3) a {111} trace. Reference Huang and Winther19 Compared with these fcc metals, these detailed deformation behaviors of bcc metals lack through careful research. In our daily life, bcc metals, such as α-Fe, Mo, Ta, Nb, W, etc, are also very common and important. Therefore, the deformation behaviors of these metals deserve special attentions. It has been found that the dislocation boundaries in compressed molybdenum can be also classified into three types. Reference Wang, Wang, Chen, Xiao, Jia, Li and Wang20 However, the detailed microstructures in these different boundaries are still not clear. Meanwhile, the detailed structure of dislocation walls in the nanoscale has gradually been in a hot research at present. These would describe the nature and formation mechanism of these different boundaries. Unfortunately, most attentions about these have still been paid on fcc metals. Reference Wei, Godfrey, Liu, Liu, Huang, Hansen and Winther21,Reference Hong, Huang and Winther22 Landau et al. have investigated the evolution of dislocation structure in fcc metals. Reference Landau, Makov, Shneck and Venkert23,Reference Landau, Mordehai, Venkert and Makov24 It was found that the dislocations in fcc metals within the boundaries tend to rearrange themselves with increasing strain in a sequence: from tangles to wavy, parallel dislocations, and finally into arrays of parallel straight dislocations or dislocation nets. Reference Landau, Makov, Shneck and Venkert23 However, this topic has not been conducted in bcc metals by now. It is not clear whether the same sequence would be found in bcc metals. To figure out these results, this article was to investigate how deformation microstructures evolved at macroscale and nanoscale during the cold-rolled process at low to medium reduction levels in Ta–2.5 wt% W alloy.
II. EXPERIMENTS
Ta–2.5W alloy was prepared by a powder metallurgy method. The sintered plates with an average grain size of 50 μm were processed by hot forging. Then they were annealed to get a fully recrystallization plates with 10 mm in thickness. The average grain size of these plates was about 20 μm and the texture was almost random. The annealed samples were cold-rolled in the range from 5 to 40%. When the reduction was less than 10%, one rolling pass was used. Thickness reductions of 20, 30, and 40% were obtained by 2, 3, 4 rolling passes with 10% reduction per pass. The optical microscopic (OM) observation was carried out on Leica EC3 metalloscope (Wetzlar, Germany). Electron backscatter diffraction (EBSD) images were taken by FEI-Sirion 200 field emission scanning electron microscope (Houston, TX). EBSD investigations were done on ND (Normal direction)–RD (Rolling direction) of the plates. The position of samples for OM and EBSD was in the center of the plates. The transmission electron microscope (TEM) observation was conducted with a JEOL 2010 TEM (Tokyo, Japan). The specimens were jet polished in a mixing solution of HF, H2SO4, and CH3OH with ratio of 1:5:94 at 273 K.
III. RESULTS
A. Microhardness of Ta–2.5W alloy
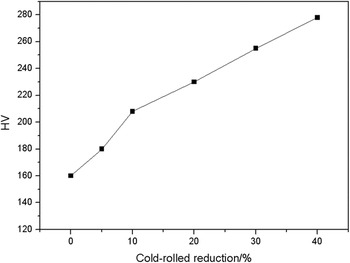
The microhardness of Ta–2.5W alloy at different conditions was plotted in Fig. 1. The microhardness of annealed plates was 160 HV. The microhardness increased with the increase of cold-rolled reduction. After cold-rolled by 40%, the microhardness can reach 280 HV.
Microhardness of Ta–2.5W alloy with different reductions.

B. OM observation of Ta–2.5W alloy
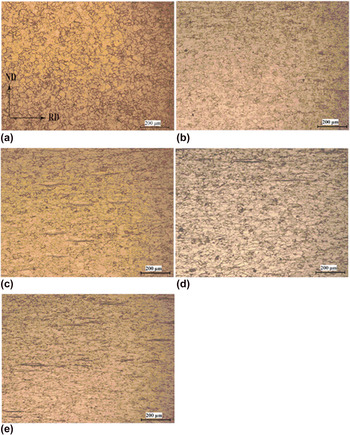
To well understand the evolution of microstructure in cold-rolled Ta–2.5W alloy, first emphasis was focused on the optical microstructure variation, which was shown in Fig. 2. It can be clearly seen that different microstructure was developed at different reduction. Equiaxed grains were still maintained in Ta–2.5W alloy cold-rolled by 5%. As the cold-rolled reduction increases, the aspect ratio of the grains increases. Grains were obviously elongated along RD when the reduction was larger than 20%. The bands structure cannot be investigated at this scale. Thus, EBSD was used to investigate these deformation microstructures.
Optical microstructure of different Ta–2.5W alloy. (a) Annealed at 1673 K for 1 h, (b) cold-rolled by 5%, (c) cold-rolled by 10%, (d) cold-rolled by 20%, and (e) cold-rolled by 40%.

C. EBSD observation of Ta–2.5W alloy
EBSD is a useful and powerful tool for microstructure analysis, allowing the rapid acquisition of large quantities of orientation data. Therefore, EBSD technique is well suited for a statistical investigation of the microstructure units and the relationship between microstructure and orientations.
Reference Kumar, Schwartz and King25
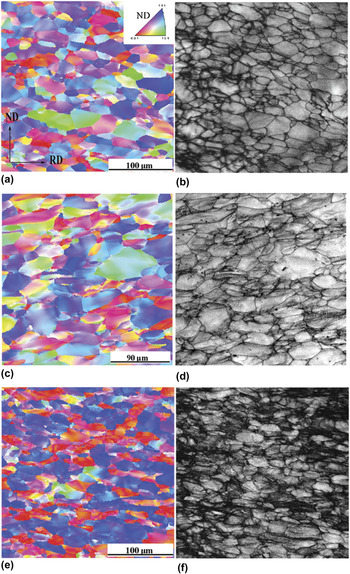
The typical large-scale EBSD microstructure of the different cold-rolled Ta–2.5W alloy was shown in Fig. 3. Deformation bands can be seen in Ta–2.5W cold-rolled by 10%. However, few microbands can be seen in it. Lots of microbands can be seen when Ta–2.5W alloy was cold-rolled by 20%. A set of parallel microbands which comprised two dislocation walls with opposite sign formed in a grain, as shown in Figs. 3(c) and 3(d). The density of microbands increased dramatically when reduction reached 40%. Meanwhile, the volume fraction of grains with
 ${\rm{ND//}}\left\langle {{\rm{111}}} \right\rangle$
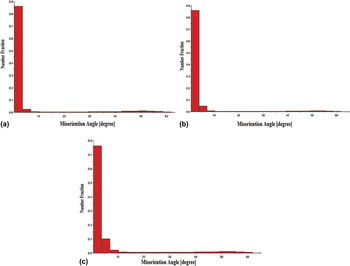
also increased during the cold-rolled processing. It can also be seen from Fig. 4 that the number fraction of misorientation angle between 5 and 15° became larger and larger as the cold-rolled reduction increased. It means that a lot of dislocation boundaries were produced during this process.
EBSD microstructure of cold-rolled Ta–2.5W alloy in ND–RD section, the step size: 0.2 μm. (a) ND orientation image of 10% cold-rolled samples, and (b) the corresponding IQ map of (a). (c) ND orientation image of 20% cold-rolled samples, and (d) the corresponding IQ map of (c). (e) ND orientation image of 40% cold-rolled samples, and (f) the corresponding IQ map of (e).

Misorientation angle distributions in Ta–2.5W alloy cold-rolled by different reductions. (a) 10%, (b) 20%, and (c) 40%.

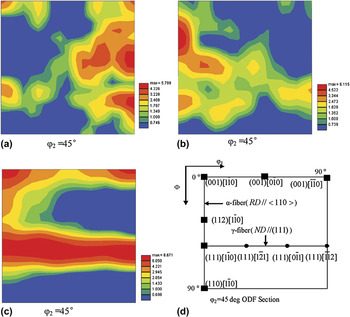
In addition, the texture of the different plates was analyzed by φ2 = 45 deg sections of orientation distribution function (ODF) maps, which were shown in Fig. 5. For bcc metals, in the Bunge version of Euler space, the full ODF need not be shown because the φ2 = 45 deg section contains sufficient information to allow a proper discussion of the bcc rolling texture, including α and γ fibers. Reference Barnett and Jonas26 It can be found that a mature bcc rolling texture, including α and γ fibers, was not developed in Ta–2.5W until the reduction reached 40%.
The φ2 = 45 deg section of ODF maps of Ta–2.5W alloy. (a) Cold-rolled by 10%, (b) cold-rolled by 20%, (c) cold-rolled by 40%, and (d) the φ2 = 45 deg section of Euler space showing the major components of the α and γ fibers.

Detailed typical EBSD microstructure was investigated to show the typical deformation microstructure at different reduction. Figure 6 showed the EBSD microstructure of Ta–2.5W cold-rolled by 10% in ND–RD section. It was observed that “rotation fronts”, which were arrowed in Fig. 6(a), formed inside the different grains. The “rotation fronts” showed the color difference and orientation difference in a grain. It was said that the “rotation fronts” would move with increasing strain from one side to the other side of the grain.
Reference Zhu, Sandim, Seefeldt and Verlinden27,Reference Zhu, Seefeldt and Verlinden28
The “rotation fronts” were usually not straight, which separated grains into different fragments. Take “grain A” with
 ${\rm{ND//}}\left\langle {{\rm{111}}} \right\rangle$
in Fig. 6(a) for example, the “rotation front” separated the grain A into two different fragments. The misorientation profile along the line in grain A was shown in Fig. 6(b). It can be seen that the point-to-origin misorientation increased gradually along the line, indicating no microbands form in this grain. The collected orientation data along the line were plotted in a (101) pole figure as shown in Fig. 6(c). The blue dots in the pole figure represented the orientation of the initial point while the red dots indicated the orientation of the final point on the line. Five out of six (101) poles had spread orientation around a (101) pole which kept a rather focused orientation. It seems that the other five (101) poles were rotating around this (101) pole (rotation axis) in the anticlockwise sense. The rotation front would move as the rotation of the grains. The rotation fronts can evolve into the boundaries of deformation bands as the strain increases.
Reference Zhu, Seefeldt and Verlinden28
EBSD microstructure of Ta–2.5W alloy cold-rolled by 10%. (a) ND orientation image, the arrows show rotation front. (b) Misorientation profile of the line scan in grain A of (a). (c) (101) pole figure of the collected orientations along the line scan in grain A of (a). The arrows in (c) show the rotation direction of the collected points.

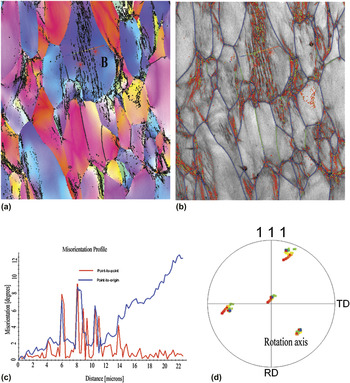
Figure 7 showed the EBSD microstructure of Ta–2.5W cold-rolled by 20% in ND–RD section. It can be seen that a group of microbands formed in grain B with
 ${\rm{ND//}}\left\langle {{\rm{111}}} \right\rangle$
. It can be found from Fig. 7(b) that the orientation of microbands alternated along the line perpendicular to microbands. The trace analysis showed that the microbands were aligned with {112} planes. It means that the slip systems of
 $\left\{ {112} \right\}\left\langle {111} \right\rangle$
were activated in Ta–2.5W alloy. Figure 7(d) showed a (111) pole figure of the collected orientations along the line scan in Figs. 7(a) and 7(b). It can be found that three out of four (111) poles had spread orientation around the initial one, except for the
 $\left[ {1\bar 11} \right]$
pole which kept a rather focused orientation. It seems that the other three (111) poles were rotating around this
 $\left[ {1\bar 11} \right]$
pole in the anticlockwise sense.
EBSD microstructure of Ta–2.5W alloy cold-rolled by 20%. (a) ND orientation image, the black lines show 2–15° grain boundaries. (b) The corresponding IQ map of (a), the red lines show 2–5° grain boundaries, the green lines show 5–15° grain boundaries, the blue lines show high angle grain boundaries. (c) Misorientation profile of the line scan in grain B. (d) (111) Pole figure of the collected orientations along the line scan in grain B.

It is well known that dislocation glide will force the slip planes to rotate toward the tensile axis and the slip directions to rotate toward the compression axis due to the constraint of the axis during cold rolling. The rotation axis R slip produced by the dislocation glide is (hkl) × (uvw), where (hkl) is the normal of the slip plane and (uvw) is the slip direction. Besides, the crystal will rotate about the transverse direction axis geometrically. Then, a rotation about ND and/or RD would also occur as a result of the influence of surrounding material. Reference Chen, Quadir and Duggan29 The total rotation matrix is given by
 $${R_{{\rm{combination}}}} = {R_{{\rm{RD}}}}{R_{{\rm{ND}}}}{R_{{\rm{TD}}}}{R_{{\rm{slip}}}}\quad .$$
In this study, the combination rotation axis was
 $\left\langle {{\rm{110}}} \right\rangle$
and
 $\left\langle {{\rm{111}}} \right\rangle$
in grain A and B, respectively. It seems that the rotation axis tended to be the ND of close-packed planes or the close-packed direction of bcc metals.
Figure 8 showed the misorientation profiles of typical orientations of bcc metals in Ta–2.5W cold-rolled by 40%. Two kinds of orientations, including
 $\left\{ {001} \right\}\left\langle {110} \right\rangle$
[red in Fig. 8(b)] and
 $\left\{ {111} \right\}\left\langle {110} \right\rangle$
[blue in Fig. 8(b)], were investigated. It can be seen from Figs. 8(a) and 8(b) that different microstructure was developed in different orientations. Cells are the typical microstructure in
 $\left\{ {001} \right\}\left\langle {110} \right\rangle$
and microbands were the typical microstructure in
 $\left\{ {111} \right\}\left\langle {110} \right\rangle$
, respectively. The misorientation between neighboring points in
 $\left\{ {001} \right\}\left\langle {110} \right\rangle$
orientations was usually about 1°–2°, which in
 $\left\{ {111} \right\}\left\langle {110} \right\rangle$
orientations can be up to 7°. It can be concluded that the deformation microstructure strongly depended on the orientation.
The misorientation profiles in different grains of Ta–2.5W alloy cold-rolled by 40%. (a) ND orientation map and (b) the corresponding IQ map. The red shows
 $\left\{ {001} \right\}\left\langle {110} \right\rangle$
orientations and the blue shows
 $\left\{ {111} \right\}\left\langle {110} \right\rangle$
orientations in (b). (c) Misorientation profile of the line 1 scan and (d) misorientation profile of the line 2 scan. Step size: 0.1 μm.

D. TEM observation of Ta–2.5W alloy
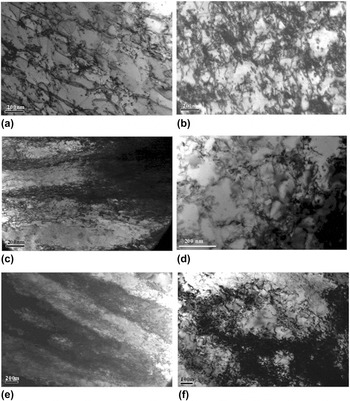
Typical dislocation microstructure in Ta–2.5W cold-rolled by different reductions was shown in Fig. 9. The dislocation microstructure was related with the orientations of grains, which was consistent with the results of EBSD. The dislocation configuration appeared in a sequence: firstly, lots of long straight dislocations and dislocation loops appeared. Then, dislocation meshes and dislocation tangles appeared. Finally, Cell boundaries and GNBs appeared. After cold-rolled by 5%, a set of parallel long straight dislocations formed in some grains and dislocation tangles formed in other grains. It means that different number of slip systems was activated in these different grains. GNBs and IDBs formed when the reduction reached 20%. It can be found that not all grains contained microbands after rolling to 40%, as shown in Fig. 9(f), which showed the microstructure of such a grain in which only cells and IDBs are present. This microstructure indicated that the grain deformed relatively homogeneously, when compared with those grains containing the microbands [Fig. 9(e)]. The microstructure features of microbands were very important since they had significant effects on deformation behaviors, i.e., yield strength, Bauschinger effect, work hardening, anisotropy, etc., and during subsequent annealing. Reference Afrin, Quadir, Bassman, Driver, Alboud and Ferry30
Typical dislocation microstructure in Ta–2.5W alloy cold-rolled by different reductions. (a, b) 5%, (c, d) 20%, and (e, f) 40%.

Figure 10 showed the typical dislocation microstructure composed of GNBs at nanoscale. It can be seen from Fig. 10(a) that although dislocation tangles formed in the boundaries, a set of long straight dislocation along the extending direction of GNBs can also be seen in the GNBs which can fix the shape of GNBs. The GNBs were dislocation walls lying along approximately {110} planes [Figs. 10(c) and 10(d)]. Each boundary consisted of two sets of dislocations. The predominant set lies along the longitudinal direction of GNBs, with spacing between dislocations of 5 and 10 nm, while the secondary set was much less dense, with an inclination angle of about 20° between the dislocations and the predominant set [Fig. 10(d)]. When cold-rolled by 40%, regular dislocation nets can be seen in GNBs. Mainly three sets of dislocation arrays can be seen in GNBs, which also consisted of a predominant set of dislocations aligning with the longitudinal direction of the GNBs. The reaction between the different dislocation sets probably fixed the dislocation structure during the formation of microbands.
The dislocation microstructure of GNBs in Ta–2.5W cold-rolled by different reductions. (a, b) Dislocation tangles, (c, d) parallel dislocation arrays, and (e, f) dislocation nets. The arrows show dislocation reactions.

IV. DISCUSSION
Above all, the deformation microstructure appeared in a sequence can be investigated by EBSD. Rotation fronts appeared firstly, and then microbands did not appear until the reduction reaches 20%. The dislocation configuration also appeared in a sequence investigated by TEM: firstly, lots of long straight dislocations and dislocation loops appeared. Then, dislocation meshes and dislocation tangles appeared. Finally, cell boundaries and GNBs appeared. The dislocations within the GNBs tended to rearrange themselves with increasing strain in a sequence from tangled dislocations to wavy, parallel dislocations, and finally into dislocation nets. The mature bcc rolling texture, including α and γ fibers, was not developed until the reduction reached 40%. It can be found that different microstructure was developed in α fiber and γ fiber. The formation of α fiber can be explained by a cross-slip mechanism. Obviously, the formation of γ fiber is related to banded structures.
Reference Wang, Chen, Jia and Wang31
The grains with
 $\left\{ {001} \right\}\left\langle {110} \right\rangle$
orientation were mainly composed of cells boundaries with low misorientation. The γ fiber grains were mainly composed of GNBs with high misorientation. The formation of cells or microbands depended on the number of activated slip systems in a grain. Therefore, deformation behaviors mainly depended on the orientations of different grains. The number of activated slip systems in α fiber is larger than that in γ fiber. Since only two or three kinds of dislocations were composed of microbands, it can be concluded that only two or three slip systems were activated in a grain leading to the formation of microbands. The thermodynamic conditions for the formation of dislocation cells or microbands have been studied. It was supposed that dislocations multiply and move in cooperative manners, which can be classified into two types. The first type cooperation is related to a strong dependence of the total dislocation energy on their mutual arrangements, which produces large driving forces that tend to transfer the system into the state of the lowest energy, such as dislocation cells. The second type cooperation is achieved under the conditions of highly localized microplastic deformation resulting in nonequilibrium structures, such as microbands.
Reference Romanov, Vladimirov and Nabarro32
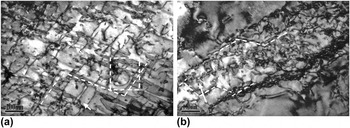
It can be seen from Fig. 10 that all GNBs had at least one predominant set of parallel dislocations which were aligning with the longitudinal direction of these boundaries. It means that this set of long dislocations played an important role in the formation of microbands. Through trace analysis of these dislocations, these predominant sets of dislocations lay along approximately [111]. Thus, they were of screw character. These long straight screw dislocations can cross-slip frequently during plastic deformation, which can be seen in Fig. 11.
Typical cross-slip of dislocation microstructure in Ta–2.5W alloy at different reductions. (a) 5% and (b) 20%. Cross-slip of screw dislocations can be seen, as shown by the dashed lines. The arrows show dipoles. Dislocation source can be seen in the dashed square frame.

It can be seen that in Fig. 11(a), after cold-rolled by 5%, the cross-slip of screw dislocations was very common. A lot of dislocation loops, dislocation dipoles, and dislocation sources were produced by the cross-slip of screw dislocations. This process depended on the length of the jogs between screw dislocations, as shown in Fig. 12(a). A dislocation source can be seen in the dashed box and the length of the jog was about 160 nm. It means when the length of the jogs was larger than 160 nm in Ta–2.5W, these jogs can be acted as dislocation sources. The dislocation source would send out dislocation loops, the nonscrew parts of which would travel quickly on the slip planes. Figure 12 showed a schematic of the formation of microbands. It showed the cross-slip of screw dislocations and how screw segments cross-slip back onto the primary plane to produce dipoles. Reference Chen, Ngan and Duggan33 The new dislocations lay on a plane parallel to the primary plane and dense dislocation walls were developed by this mechanism. These frequent double cross-slip processes produced dense dislocation walls on the closely spaced slip planes. The dislocation tangles would form because of the low mobility of the long straight screw dislocations, as shown in Fig. 11(b). It suggested that the cross-slip of long straight dislocations was the base for the formation of microbands. As the strain increased, other sets of dislocations can be produced, as shown in Figs. 10(c) and 10(e). These new sets of dislocations would be tangled by the primary dislocations and the dislocation reactions were inevitable, which can be seen in Fig. 10. Then dislocation nets formed in the dislocation boundaries, as shown in Fig. 10(e). It can be concluded that the dislocation nets were the stable structure of dislocation boundaries.
The schematic of the formation of microbands. The double cross-slip of screw dislocations produces new dislocations. The new dislocations lie on a plane parallel to the primary plane and two dense dislocation walls with opposite sign are formed by this mechanism.

V. CONCLUSIONS
-
(1) When the reduction reached 40%, the microhardness of Ta–2.5W alloy was 280 HV. Meanwhile, the mature bcc rolling texture, including α and γ fibers, was developed. The deformation behaviors of different grains mainly depended on the orientations.
-
(2) Rotation fronts can be seen firstly and microbands did not appear until the reduction reached 20%. The density of microbands increased with increasing strain. The cross-slip of long straight screw dislocations was the foundation of the formation of microbands.
-
(3) The dislocations within the GNBs tended to rearrange themselves with increasing strain in a sequence from tangles into wavy, parallel dislocations, and finally into dislocation nets. The GNBs always consisted of one set long straight dislocations, which lay along the longitudinal direction of the boundaries.
ACKNOWLEDGMENT
This work is supported by Special Foundation for State Major Basic Research Program of China (2014GB121000).