The study of local government in the United States presents a potential goldmine for political scientists seeking to understand central questions related to democracy, governance, and policy making. With over 90,000 local governments that vary in terms of institutional design and behavior (U.S. Census Bureau 2012), one might expect an abundance of scholarship exploring ideas around representation, responsiveness, policy preferences, and power. Recent scholarship on urban politics has examined many of these questions via time-intensive individually assembled large- $N$ datasets (Tausanovitch and Warshaw Reference Tausanovitch and Warshaw2014; de Benedictis-Kessner and Warshaw Reference de Benedictis-Kessner and Warshaw2018; Trounstine Reference Trounstine2018; Einstein, Palmer, and Glick Reference Einstein, Palmer and Glick2019). However, large gaps remain, as we often lack basic information about local politics in the United States. There are no central, public access databases of information about who holds the office, when they were elected or by what margin, what policies they pass, or even how many elected seats exist on city councils or county boards. As de Benedictis-Kessner and Warshaw (Reference de Benedictis-Kessner and Warshaw2016) note, “The major hurdle to studying local elections has been a paucity of data” (1127). As a result, urban research often focuses on case studies, local governments in those states where reliable local data is more easily available, or building on existing already assembled datasets (Trounstine Reference Trounstine2006; Crowder-Meyer, Gadarian, and Trounstine Reference Crowder-Meyer, Gadarian and Trounstine2015; Owens and Sumner Reference Owens and Sumner2016; Goodman Reference Goodman2018).
Following others’ call for increased attention to local politics (Trounstine Reference Trounstine2009; Holman Reference Holman2017), we offer a potential solution to the local politics data collection barrier: crowdsourcing data gathering. We demonstrate and test a method of crowdsourcing data on local politics using two different data collection projects. To assess the quality of the work, we evaluate different measures of consensus across coders and validate the crowd’s work against elite and professional datasets for both of our data collections. Crowdsourced data is both highly accurate and easy to use. To facilitate this form of crowdsourcing, we also provide an RShiny site to allow researchers to easily perform mass randomization using Qualtrics (2Randomize) and provide a how-to guide with step-by-step instructions on how to use crowdsourcing practically and ethically to collect data. We then discuss the processes of replicating our processes and additional applications for crowdsourced data collection efforts.
We theorize that crowdsourcing data collection increases replicability, agility, and equity in data collection. Elite-driven data collection is inherently difficult to replicate (Benoit et al. Reference Benoit, Conway, Lauderdale, Laver and Mikhaylov2016), while crowdsourced data can easily be replicated via the exact same processes used to collect the original data. The time investment required in elite-driven data collection often produces datasets that are not updated regularly or lead to data hoarding; crowdsourced local data is agile and can be used to update and build on other datasets. And the expense of data collection makes large- $N$ local data out of reach for many scholars, producing issues of inequity in political science, where well-resourced scholars can afford data that others cannot. Crowdsourced data is comparatively inexpensive to purchasing data or engaging in elite collection, increasing access to local data for research for a broader range of researchers.
In the following sections, we review the primary methods of collecting urban politics data to date, the theory and practice of crowdsourcing, and the potential benefits it offers for research on local politics. We discuss the process of crowdsourcing using randomization in Qualtrics, offer several tests of the process, and validate the data collection process using two different tasks. We then provide the best practices for using crowdsourced data for local data collection and speculate on additional uses for crowdsourced data collection. In doing so, we make the case that crowdsourcing data collection efforts can provide new opportunities for researchers interested in collecting all types of data across a variety of locations.
1 Primary Challenges and Methods of Collecting Local Data
Despite the possibilities of exploiting the rich variation in local political institutions and behavior, we see a lack of scholarly attention to the point where urban politics has been called the “black hole” of political science research (Sapotichne, Jones, and Wolfe Reference Sapotichne, Jones and Wolfe2007). A clear obstacle is the lack of easily accessible data available at the local level. Yet, it is the very difficulties of collecting local data that also offer so many opportunities for studying fundamental questions of political behavior and institutions, given the enormous variation in timing, institutions, competitiveness, and key players in local politics. All of these variations offer political scientists new ways to ask important questions.
Although local governments are numerous, empirical studies of urban or local politics often rely on the use of single or small- $N$ case studies. Classic works like Dahl’s Who Governs (Reference Dahl1961) and Stone’s Regime Politics (Reference Stone1989) theorize from single cases of New Haven, CT and Atlanta, GA, while others, like Browning, Marshall, and Tabb’s Protest is Not Enough (Reference Stone1989), use a small-
 $N$ comparative case study method. Many scholars have followed, examining politics in one or two cities in depth (e.g., Kaufmann Reference Kaufmann2004; Burns Reference Burns2006; Gillespie Reference Gillespie2012). While these studies can provide rich accounts of urban politics, the ability to scale this data beyond a limited number of cases is often difficult.
A small number of ambitious scholars have more recently collected large- $N$ studies of local political structures, representation, and behavior. For example, Trounstine (Reference Trounstine2008) combines case studies of Chicago and San Jose with a dataset of representation in 244 cities over time. Ferreira and Gyourko (Reference Ferreira and Gyourko2014) surveyed cities to evaluate “2,000 direct mayoral elections in over 400 U.S. cities between 1950 and 2000” (p. 400). Gerber and Hopkins evaluate elections in 134 “large U.S. cities” from 1990 to 2006, and Hopkins and Pettingill (Reference Hopkins and Pettingill2017) update this to include 1,264 mayoral elections between 1990 and 2011 across the cities. Kirkland (Reference Kirkland2018) built her own dataset of the backgrounds of 3,257 mayoral candidates from 263 U.S. cities from 1950 to 2007. Recent scholarship has taken advantage of those already constructed datasets, adding additional cases or historical data (de Benedictis-Kessner and Warshaw Reference de Benedictis-Kessner and Warshaw2016; Vogl Reference Vogl2014). The production of these large-
 $N$ urban politics datasets is quite remarkable, especially given the time commitment associated with these data collection tasks.
In what follows, we briefly outline how these researchers collected large- $N$ datasets, with the benefits and drawbacks of each approach. Scholars have primarily relied on three practices: (1) elite or semi-elite data collection; (2) professional data collection or purchasing existing datasets; and/or (3) scraping or automated data collection. We review some recent examples of scholarship utilizing each of these practices and discuss the potential limits of each approach. We then compare crowdsourcing to each approach, discussing the benefits and drawbacks.
1.1 Elite and Semi-Elite Data Collection
Most urban or local politics scholars primarily collect their data through their own time and resources. With the lack of a central database, scholars often must build original urban politics datasets on their own or with the help of research assistants. In their Reference Oliver and Conroy2018 article, Oliver and Conroy conducted an original survey of city council members from a random set of 590 cities; the authors personally collected contact information to conduct the survey. Similarly, the work of Holman (Reference Holman2014, Reference Holman2015) work involved two original surveys of local leaders (with contact information collected by hand) and coded budget information. Williamson (Reference Williamson2018) self-administered an original national survey of local government officials in new immigrant destination cities. Crowder-Meyer (Reference Crowder-Meyer2013) assembled lists of local party chairs from personal research and party lists and conducted a self-administered survey.
1.2 Professional Data Collection and the Use of Existing Datasets
With access to research funds, scholars may use professional services for local data collection, including paying others to collect local data or purchasing local data previously collected by professional organizations. For example, Smith’s (Reference Smith2014) research, funded by a National Science Foundation (NSF) dissertation improvement grant, used a survey research firm to call city clerks to collect data. Others use the U.S. Census on Governments (Goodman Reference Goodman2018) or data from the International City and County Managers Association (ICMA) (Watson and Hassett Reference Watson and Hassett2004). ICMA also sells access to surveys on different topics related to local government and policy, with costs increasing based on the recency of data.Footnote 1 Researchers often combine these datasets with other data; for example, Nelson and Svara’s (Reference Nelson and Svara2010) work combines ICMA surveys with data from the National League of Cities to produce a dataset of the form of government for most U.S. cities ( $N$
 $=$ 2883) with a population over 10,000. Others use large databases maintained by external organizations like signatories to the International Council for Local Environmental Initiatives (Krause, Yi, and Feiock Reference Krause, Yi and Feiock2016) or the National Sheriffs’ Association (Farris and Holman Reference Farris and Holman2015). Others use datasets that do not have an explicit urban focus with additional local data. For example, Einstein and Kogan (Reference Einstein and Kogan2016) combine the Harvard Election Data Archive dataset of 2008 electoral returns with census-block and municipal data to examine local voting patterns.
2 Scraping or Automated Data Collection
The use of computer-assisted scraping or mining offers another path to the collection of local information. This approach includes the Local Elections in America Project (LEAP), de Benedictis-Kessner and Warshaw’s use of OurCampaigns.com, work by Boussalis, Coan, and Holman (Reference Boussalis, Coan and Holman2018) and de Benedictis-Kessner (Reference de Benedictis-Kessner2019) that uses press releases scraped from city websites, or Holman (Reference Holman2016), which scraped state of the city addresses from city websites and repositories.
The LEAP is the most ambitious of the computer-assisted approaches to local data collection. Receiving a 2010 grant from NSF, the “funding supports the creation of a software tool to systematically collect, digitize, and disseminate data on municipal elections” (Marschall, Shah, and Ruhil Reference Marschall, Shah and Ruhil2011).Footnote 2 Scholars using LEAP data have largely focused on states that have more election data available online, such as Crowder-Meyer and Smith’s (Reference Crowder-Meyer and Smith2015) examination of women’s descriptive local representation in Louisiana and Crowder-Meyer, Gadarian, and Trounstine’s (Reference Crowder-Meyer, Gadarian and Trounstine2015) evaluation of candidate-level data from California.
3 Need for a New Approach to Local Data Collection
While all these approaches have produced interesting data and compelling findings, the existing approaches also represent high thresholds for entry in terms of cost and time. These barriers make replication, extension, and external validity challenging. Many of these datasets take years to collect and analyze, which often results in an outdated dataset far before others have access to it for analysis (if the datasets are ever made available publicly). It is also difficult to update datasets that are reliant on time-intensive efforts. And shortcuts, such as computer-assisted methods, have fallen short of the high expectations, given the difficulty in automating the collection of local data when cities often have unique websites designed or updated by amateurs with a lack of centralized databases of information.
We posit that the dominant methods of collecting local political data in the United States produce particular types of errors that bias results toward the political realities of larger citiesFootnote 3 and those cities in certain states like California and Louisiana, where the state provides reliable data on local politics (i.e., Crowder-Meyer, Gadarian, and Trounstine Reference Crowder-Meyer, Gadarian and Trounstine2015). In noting that ethnographic research on urban poverty focuses on a handful of cities, Small, Manduca, and Johnston (Reference Small, Manduca and Johnston2018) write, “today the selection of the city is a core methodological decision that will strongly influence what they observe and conclude” (580). In this context, the “tyranny of the available” produces bias that may shape what we can learn from local politics. This may be particularly true for collecting historical data that requires researchers seek out information from a variety of additional sources; in this context, the cities or states that readily provide historical data are used frequently in research, while those where the information requires additional data collection efforts are less likely to be used.
So what is a better option? We propose that researchers can use online workers to collect and validate data on local political factors in ways that are more equitable, have a more random distribution of errors, and are easier to validate. Following D’Orazio and colleagues (Reference D’Orazio, Kenwick, Lane, Palmer and Reitter2016; see also Beach and Jones Reference Beach and Jones2017 and Jäger Reference Jäger2017), we expect that crowdsourcing offers both the benefits of machines (“fast, cheap, and capable of collecting data on a large scale”) while also providing human intelligence to bypass the problems that have stymied machine collection at the local level.
4 Use of Crowdsourcing as an Alternative Form of Data Collection
We propose here that crowdsourcing can be used as a mechanism for collecting large sets of data on local politics, institutions, and leadership that can be easily validated and kept up to date. Here, we follow Benoit and colleagues (Reference Benoit, Conway, Lauderdale, Laver and Mikhaylov2016) when they argue that using crowdsourcing to generate data improves both the reproducibility of the data and the agility of a flexible design. We add an additional advantage: crowdsourcing increases the equity of the process of local data collection.
Replication: Political science research increasingly focuses on the need to provide data and methods in ways that allow for replication (Bishin and Dennis Reference Bishin and Dennis2002; Ward Reference Ward2004). And yet, political science—particularly local research in political science—is inherently difficult to replicate. As Benoit et al. (Reference Benoit, Conway, Lauderdale, Laver and Mikhaylov2016) note, “expert-driven process is inherently difficult to replicate or to assess on grounds of reliability” (p. 278), and Maestas, Buttice, and Stone (Reference Maestas, Buttice and Stone2014) explain that “getting access to and response from highly expert informants can be costly and challenging” (p. 354). Given the time and cost intensity of local data collection, many scholars may be reluctant to provide their data publicly until they have published from it. Research on economic behavior suggests that cost is a primary determinant of whether someone is willing to pay for a public good, regardless of the benefit of that public good (Baron and Maxwell Reference Baron and Maxwell1996). In these contexts, high quality data is often unavailable to all researchers. How does crowdsourcing increase the replicability of local data? By allowing researchers to repeat the exact same process of data collection, crowdsourcing bypasses one of the central problems of reproduction in local data projects. And, by making the data less costly, crowdsourcing could increase the odds that researchers will be willing to share their data.Footnote 4
Agility: Crowdsourcing local data is agile and adaptive in several key ways. First, local data collection can remedy problems of existing data sources being quickly out of date. Local elections happen year round across the country (the adage is “every day is election day in America”), so data collected even three months ago could have up to a quarter of the data out of date. Crowdsourcing can easily be rerun over time to update datasets. Crowdsourcing can also remedy project design and data collection mistakes by allowing researchers to change protocol, even mid-data collection, or to redo parts of a data collection.
Equity: We argue that researchers who do not have access to large research funds, grant monies, student assistance, or years of time can collect data via crowdsourcing.Footnote 5 This democratization feature means that graduate students, scholars in temporary positions, or those at institutions with limited research funds can more easily participate in the creation and extension of knowledge about local politics. We suggest that ethical crowdsourcing with fair compensation can still be cheaper than other methods of acquiring data.
4.1 How Does Crowdsourcing Work?
Crowdsourcing involves paying online workers, unfamiliar with the task or project, small amounts of money to complete a discrete, short task.Footnote 6 One popular platform for crowdsourcing is Amazon Mechanical Turk (MTurk), where people may request the completion of small tasks (“Human Intelligence Tasks” or HITs) by workers. Similar platforms exist online, including Crowdflower and Clickworker.Footnote 7 Social scientists have widely adopted MTurk as an online participant market for its low-cost pool which allows for easy to field, quick data collection, especially surveys and experiments. Scholars have replicated results from multiple fields including political science (Berinsky, Huber, and Lenz Reference Berinsky, Huber and Lenz2012; Casey et al. Reference Casey, Chandler, Levine, Proctor and Strolovitch2017). Beyond recruiting research subjects for experimental survey research, MTurk also has the potential value for scholars interested in other forms of crowdsourcing, particularly in regard to data preprocessing. Leeper (Reference Leeper2016) details the process for crowdsourcing via MTurk workers to process “messy” data and notes the potential application in a variety of tasks such as human transcription and content analysis, among others. Others have used crowdsourcing to gather difficult-to-access data (D’Orazio et al. Reference D’Orazio, Kenwick, Lane, Palmer and Reitter2016; Jäger Reference Jäger2017). We argue that MTurk provides an easy and reliable platform to collect local data.
Crowdsourcing data raises critical ethical concerns regarding the compensation and protection of workers (Williamson Reference Williamson2016). The mean hourly wage for MTurkers is far below federal minimum wage, and although workers report a variety of motivations for the labor, at least some rely on MTurk as an important source of income (Gleibs Reference Gleibs2017). While MTurk could be a significant bargain, as essentially an unregulated labor marketplace, we urge researchers to engage in an ethical and fair compensation for crowdsourcing labor. We recommend scholars to follow the compensation guidelines set by Williamson (Reference Williamson2016): individual researchers should set a minimum wage at an ethical rate for their research, ideally higher than the federal minimum wage. Researchers wishing to crowdsource should fairly assess how long a task will likely take a worker to complete and then set a pay rate equal at least to the researcher’s state or federal minimum wage rate. Higher pay rates do not seem to affect subject recruitment or participation (Andersen and Lau Reference Andersen and Lau2018). We also recommend the practice of reporting the compensation rate in research and echo Williamson’s recommendations for broader institutional oversight and protection for crowdsourcing workers through journal editors, grant makers, and institutional review boards. We urge caution when rejecting work, following the concern by Gleibs (Reference Gleibs2017) for power differentials between researchers and workers.
Like all forms of data collection, crowdsourcing data has the potential for concern. As workers are online and work remotely, the quality of data they collect may be compromised, including from inattentiveness in data collection. Like most citizens, MTurk workers may not be familiar with the details of local government, which may lead to accuracy and consistency problems in the quality of the data. And yet, these are also concerns in using research assistants. The MTurk system monitors worker quality by tracking the workers’ approval ratings and number of HITS a worker has completed, and the platform allows researchers to set up prequalifications in HITS. Further, by randomizing the assignment of cities to coders, this method alleviates concerns that errors may be nonrandom as, for instance, a research assistant may become less attentive over time while filling out a spreadsheet, introducing an error that is correlated with (often alphabetical) data order. To explore the concern over data quality in crowdsourcing local politics data, we offer several tests of crowdsourced local data.
4.2 Data and Method
In what follows, we discuss the method of using MTurk workers to collect local data and outline how we use and assess this approach. As a central element of this approach, we randomize the assignment of cities (using Qualtrics) such that several MTurk workers collect the same piece of information. This collective approach, we argue, provides both an opportunity to assess the quality of the work provided by each worker and the overall accuracy of each item of data collected. We introduce two methods of assessing the quality of the data: equality consensus, which relies on an exact match across answers, and similarity consensus, which assesses the similarity of two string variables. To assess our approach, we collect data across two tasks that varied in their complexity: a basic data collection task (Wave 1: who are the mayors in the United States?) and a task that involves assessment of online information (Wave 2: which cities have experienced financial crisis in the United States?). We then discuss our experiences and provide some guidelines on how others might utilize this approach. In Section 7.1, we then suggest some additional ways that researchers might be able to use crowdsourcing to collect data.
To collect and assess the data, we use a combination of MTurk, TurkPrime, and Qualtrics. A step-by-step guide to the data collection process is available in Supplementary Appendix. For both waves of data collection, the approach was the same: we used Qualtrics to randomize city assignment, and every worker who accepted our HIT was randomly assigned one of the several hundred cities.Footnote 8 Then they were told which types of information to collect and instructed on how to enter the information into the form. After completion, they were paid via TurkPrime’s payment structure, which allowed us to monitor the time for completion of the task and to make sure that we were paying the workers a minimum wage (Williamson Reference Williamson2016).
As a practical matter, while there are different ways to achieve this kind of randomization using Qualtrics, these methods of randomization involve entering each randomization individually by hand at some stage in the process, which can be daunting when there are several hundred items (or more) to randomize. In addition to being tedious and time-consuming, entry by hand introduces the potential for human error into the process. To get around this, we wrote R code (available as an RShiny app, 2Randomize: https://jlsumner.shinyapps.io/2randomize/) that automates the randomization process and produces a file (.qsf) that can be uploaded to Qualtrics as a new survey for anyone interested in implementing randomization across a large number of items. While we do not anticipate that everyone who uses this approach would need to use 2Randomize, as those with sufficient programming ability (in R, Javascript, PHP, etc.) may be able to create their own randomization scheme, we hope that this RShiny app makes the crowdsourced data collection process available to a broad set of researchers.
While we did not ask the workers to provide any personal information, we can code the task completion time and what time of day they completed the task from the information provided by Qualtrics. We also asked the workers to provide where they found their information, allowing us to examine whether particular sources provide better or worse local information.
4.3 Validating Data via Consensus
The ultimate aim of this data collection venture is to collect a dataset containing the correct answers. In order to demonstrate the utility of crowdsourcing for data collection, we need to assess whether the workers arrived at an answer that is indeed correct. We operate with the assumption that when several workers identified the same answer, there is a higher likelihood that the answer is right (i.e., the wisdom of the crowds). To start, we assess the degree to which the workers agreed about the answers to their task (“consensus”) and then whether we are correct to assume that the consensus answer is correct by comparing our consensus answers to the benchmarked data. We assess two different ways of determining the existence of consensus: equality and similarity.
We operate from the assumption that a type I error (assuming that an incorrect response is the correct response) is not remarkably worse than a type II error (assuming that a correct response is incorrect) in assessing which of our coders got the right answers in the task. Given the nature of the data collection, with multiple data collectors for each observation, we assume that if everyone provides a similar response, that response is probably right or has been recently correct. But, as we outline in this section, individual researchers can choose their level of certainty about the quality of the data. Just as researchers can choose the level of statistical significance that they are comfortable with or the means by which they establish a statistically significant relationship, we provide different methods that researchers can choose to use to validate the data. Each has a level of certainty associated with the results. To examine whether workers were correct, we employ two forms of consensus: equality and similarity. These two measures offer differing opportunities to assess the correctness of any individual worker’s answer in comparison to the other workers’ answers on the same data task.
Equality consensus: The most obvious way to assess whether there is a consensus is to tabulate the coder’s answers and define the consensus is as any answer upon which a given percentage (e.g., greater than 50%) of coders agree. The benefit of this approach is its intuitive nature—if more than half of the coders give an answer, it is a consensus—and relative ease of implementation. The drawback of the tabulation approach is that human coders make mistakes, including misspellings, inclusion of titles, middle names, etc. Tabulating to find a consensus will not consider these as equivalent even though they are the same. We expect that this is going to be common, and thus simply tabulating string data and selecting the one that occurs most frequently will miss misspellings, typing errors, and other entries that are probably the same but not exactly the same.
Similarity consensus: We use a string similarity measure (specifically, the Levenshtein similarity) as a metric for assessing the similarity of character strings. The Levenshtein similarity is a function of the Levenshtein distance, which estimates how many single-character edits (substitution, insertion, and deletion) would be necessary to make two strings equal. We obtain the similarity by dividing the distance by the number of characters in the longest string, determining what proportion, rather than what absolute number, of edits would be necessary to bring them to equality and then subtracting the proportion from 1. More formally, the Levenshtein similarity is
 $$\begin{eqnarray}1-d(\text{str}A,\text{str}B)/\max (A,B),\end{eqnarray}$$
where str $A$ and str
 $B$ are two strings,
 $d$ denotes the Levenshtein distance between them, and
 $A$ and
 $B$ denote the length in characters of each. As an example, if there were two strings, “apple” and “appel,” two single-character edits would be necessary (changing the penultimate and last characters), meaning the Levenshtein distance would be 2. Because each string has five characters,
 $2/5$ of the characters in the string would need to be altered to make the strings equal.Footnote 9 The resulting Levenshtein similarity between the strings would, therefore, be
 $3/5$ or 0.6.
In the following sections, we apply these ideas to two data collection tasks. First, an attempt to categorize the names, emails, and election dates of all the mayors of cities with a population over 50,000. We discuss the process of collecting this data, how we verified the data against an outside source, and the processes of determining consensus. We then turn to a second data collection task: asking workers to evaluate whether a city had gone through a financial crisis in the past two decades. We assess the correctness of the workers’ assessments and evaluate this against an elite collected sample.
5 Wave 1: Mayors
We start first with a simple data collection task—who are the mayors in the United States?—that we believed would (a) introduce very little error from interpretation of the task, (b) would be easy to validate, and (c) would have a single “right” answer that could be compared across coders. We collected data from all U.S. cities with a population over 50,000, 716 cities in total. We estimated that the task would take 5 minutes and the median time for completion was 3 minutes.Footnote 10 The cost of assigning three workers to collect data on each city was $1673.10, or $.65 per worker, which resulted in an hourly wage of approximately $13 for the median worker. For the mayoral round, every coder who accessed the site was randomly assigned one of the 716 cities. In total, we collected 2,369 observations, with 2,273 finished data collection tasks. Cities ended up with a varied number of coders even though the assignment was set to be roughly equal.Footnote 11 Six hundred and fifty-seven cities (91.8%) were coded by at least one person.Footnote 12 Only one city each had eight and nine coders.
Coders were asked to identify the date of the most recent mayoral election (month, day, and year), the first and last name of the person who won the most recent mayoral election, and the mayor’s email address. They were also asked to provide URLs for the websites where they found the election date and the email address.
Task simplicity: While not every single city in the United States has a website, most do and most list their mayor on their website. There are also several other reliable sources, including local newspapers, Ballotpedia, and OurCampaigns (itself a crowdsourced resource), that provide information on the mayor, which allow for workers to access a variety of sources to obtain the information. We anticipated that this task would be easy and simple for the workers to complete.
The data we collected was compared against a proprietary dataset from the U.S. Conference on Mayors, which routinely collects data on who serves in mayoral positions in the United States. Yet, this is not freely available data. A dataset of mayors and their contact information for the current year is available for $1400 or $450 as a member of an educational or nonprofit organization. We purchased this data to benchmark our approach. However, future researchers should not have to purchase benchmark or validation data given what we detail below.
Correctness: Did the workers collect and provide the correct information? To evaluate this question for task 1, we start with the mayors’ names because, except in exceedingly rare circumstances (where a city has a commission style government and several potential mayors, for example), there is a single correct answer for who is the mayor, which allows us to validate our measure. We then tested two other tasks that vary in simplicity and correctness: mayor email and election date. It is quite possible that no email address exists publicly for a mayor or that there are multiple election dates, such as a primary and general election or a general election and runoff.
Consensus: If we start with the rule that an answer is correct for any city where a given percentage (50%) of coders agree (our equity consensus rule), 508 cities in our data with more than one coder end up with a consensus for mayoral surname (92%), 456 for email (82.6%), and 332 for date (60.1%). To remedy the problems associated with requiring exactly the same answers from each coder, we also use a similarity consensus measure, Levenshtein distance. As we previously noted, to use the Levenshtein distance, we specify that any two strings with a similarity of greater than 0.5 were probably the same, meaning that less than half of the characters would need to be changed to make the two strings the same.Footnote 13 Using this rule rather than the strict equality rule, we find a consensus surname for 526 cities (95.2% of assigned cities with more than one coder), a consensus email for 500 cities (90.6%), and a consensus date for 483 cities (87.5%).
The similarity consensus measure increases our level of consensus (an improvement of  $+$18 cities for names,
 $+$44 for emails, and
 $+$151 for dates), indicating cities where we would have (falsely) concluded that there was no consensus when there actually was consensus. Common near-misses in surnames include not only misspellings but also punctuation differences (e.g., hyphens, apostrophes, or lack of spaces) and inclusion of suffixes or prefixes.Footnote 14
The increased inclusion of the similarity consensus is even more helpful for dealing with emails because often there is more than one correct email address for any given mayor. For instance, it is especially common for there to be a generic mayoral email address as well as the mayor’s specific email address or for the mayor to have two emails at two different domains. The similarity consensus rather than the equality consensus often identifies these as being probably the same, as generally either the first half or the second half of the address are similar.
The Levenshtein similarity measure is a measure of string similarity and is thus best suited for character data, not numbers. For the election date, the increased inclusion from the Levenshtein measure is less positive: most dates can be changed to other dates by altering less than half of the characters. As a result, we highly recommend altering the cutoff threshold to be higher for dates or evaluating consensus for the day, month, and year in separate evaluations.
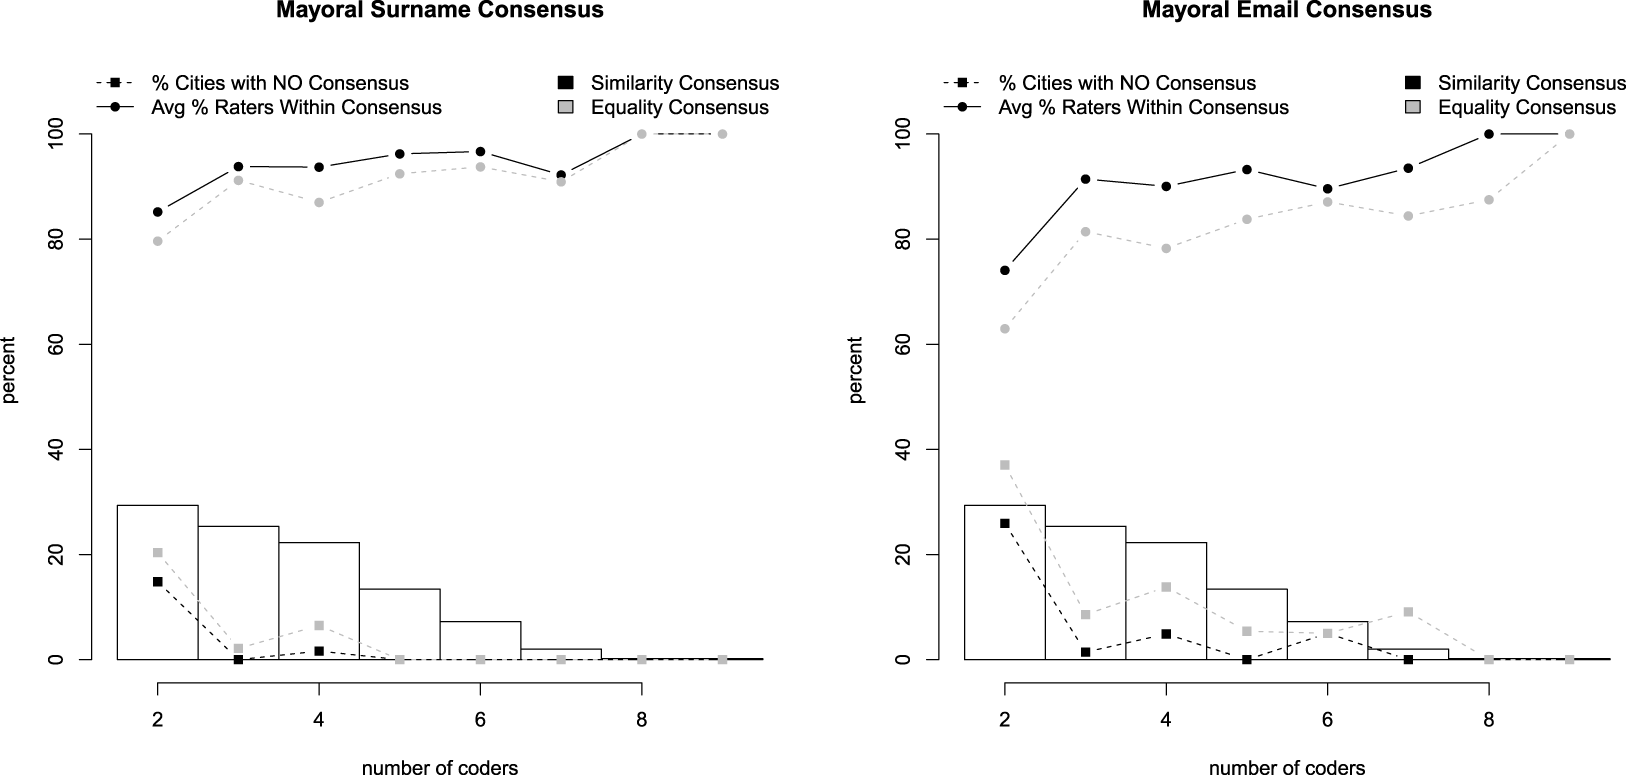
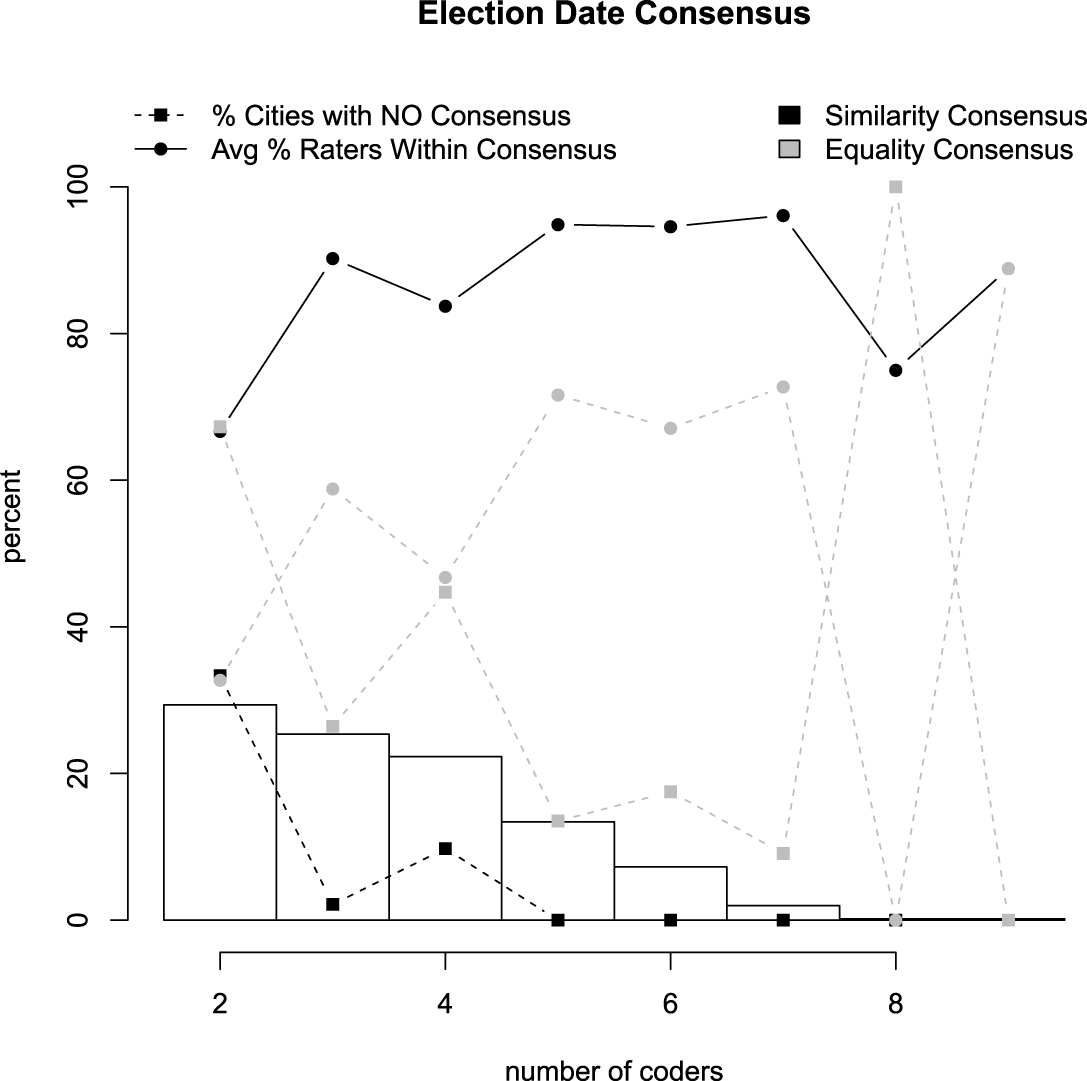
In addition to establishing whether there is a consensus, it is useful to establish the degree of consensus. That is, conditional upon the existence of a consensus, what proportion of coders end up in the consensus? Figures 1 and 2, respectively, illustrate two consensus metrics for mayoral surname, email, and election date. The first metric (black square, dashed line) is the percentage of cities that did not reach a consensus. The second (round dot, solid line) is the average percentage of coders within each city that agreed with the consensus. All the results presented in the paper use only data from workers who completed the task and fall under the 90% threshold for time to completion.
Consensus metrics for mayoral surname and mayoral email by number of coders.

Barriers to consensus: What are the central causes of a lack of consensus among coders? In the case of mayoral surnames, the major culprit appears to be the number of coders. If we only look at those cities that meet our minimum criteria of consensus of three coders,Footnote 15 there are only two cities with three or more coders and no consensus on mayoral surname and both provide an additional argument for using this method. A closer look at Baton Rouge reveals that there was a consensus on the mayor but a disagreement about the mayor’s surname: two coders said Sharon Weston Broome’s surname was Broome and two coders said Weston Broome; given that she goes by both names, all coders were correct.Footnote 16 Gresham is the only case in our surname data with a tied disagreement: two coders answered “Wheeler” and two answered “Bemis.” The correct answer is Shane Bemis. The two dissenters incorrectly named Ted Wheeler, the mayor of neighboring Portland. Although in the case two of the coders are wrong and it results in no consensus, arbitrating between the two options is quick and easy. In short, less than 1% of the cities with three coders did not have consensus, and only one of those provided the wrong information.
Consensus metrics for election date by number of coders.

For email addresses, 10 cities had three or more coders and no consensus; upon examination, three issues lead to a lack of consensus. The first is ties among even numbers of coders, typically with equally valid email addresses. An example of this is Great Falls, Montana, where three coders listed the mayor’s campaign email and three coders listed his government email. Four of the ten cities with no consensus encountered this issue. The second problem is coders listing generic government contact email addresses in place of the mayor. The third issue is coders entering junk or nothing when they could not find the email address. For instance, while three of the six coders for Gilbert, AZ correctly identified the mayor’s email, one left it blank, and one entered a fake email. To overcome these issues, we recommend providing the coders with clear information about what they should do if they cannot find the information.
The issue of lack of consensus on election dates is more complex, given that the rate of consensus was low. Most cities in our data (384 or 58.4%) ended up with two possible consensus dates, while only 30.6% of cities (201) had a single identifiable consensus date and 68 cities had three or more possible consensus dates.Footnote 17 Most of the dates tended to cluster within the same two-week span. Indeed, 440 cities (70.0%) have a single consensus on the month, while 51.3% have a single consensus on the day and 408 (62.1%) have consensus on the year. The latter is not as surprising as it would seem: coders are sometimes off by an election cycle (or perhaps mistype a year) but get the general time period correct.
Coders appeared to have difficulty differentiating between the date an election was held, the date of the news article announcing the winner, and the date the mayor took office. Other coders were rightly confused: in some cases, the most recent election was not a mayoral election, while others confused primary elections (which sometimes occur without a general election), general elections (which sometimes occur without a primary), and special elections. While the consensus dates can give us a general time of year that mayoral elections occur, and a sense of how often (because often the consensus dates differ by a term), the cities that lack consensus provide insight into the incredible variation of election rules throughout the country.
But is the crowd right? Consensus is important but only useful insofar as the consensus also provides us with a correct answer. For both name and email, we can check our consensus answers against the correct answers from the U.S. Council on Mayors, while for the financial crisis evaluations, we can compare the responses to one of the author’s constructed databases.
Mayor surname: Using the U.S. Council on Mayors data, we find that the crowd is, in every verifiable case we have checked, correct on the mayor’s surname. We start with a basic check—did the consensus answer of the mayor’s name match the benchmark data? Using the similarity consensus, we find that 435 (78.8%) of the consensus mayor names are verified and correct according to our benchmark data.Footnote 18 But what about the remaining 117 cities? To start, 43 cities are either missing consensus in our database (26 cities) or are missing information in the benchmark data (17 cities). We are then left with 74 cities where there are mismatched responses between the crowd consensus and the benchmark data. In 52 of these cities, the answer provided by the consensus was correct at the time we collected the data but are no longer correct because a new mayor had been elected or had taken office between the data collection (in August 2017) and purchasing the benchmark data (December 2017). For instance, coders correctly identified Kasim Reed as the mayor of Atlanta as of October, but our benchmark data lists the new mayor, Keisha Lance Bottoms. In 10 cities, the consensus coders provided the correct information and the benchmark data was incorrect or outdated. In the remaining 12 cities, the mayor is a ceremonial position that rotates between members of the city council and the mayor had rotated. In short, the consensus answers appear to be exceptionally accurate for the time they were collected.
Email addresses: For email addresses, the similarity consensus is correct for 309 cities (56% of the assigned cities with more than one coder) and the equality consensus is correct for 286 cities (51.8%). Of the 243 cities that are not verified among the similarity consensus, 29 do not appear in the benchmark data and 50 do not have a consensus response in the data. That leaves 164 that are verifiable but do not match the benchmark data. Of these, 57 (35.2%) also have out-of-date mayor surnames and, thus, would be expected to also have out-of-date emails. Of the remaining 105, most of the consensus answers appear to be valid but different emails than those in our benchmark data (e.g., generic mayor’s office email vs. individual’s specific email). In five cities, the consensus appears to be an email address for another member of the city government.
6 Task 2: Financial Crises in Cities
For the second task, we selected a data collection activity that required that the workers make a judgment about the data they collected: whether a randomly assigned city had undergone a financial crisis in the past two decades. For this task, we started with the dataset of 914 cities collected by de Benedictis-Kessner and Warshaw (Reference de Benedictis-Kessner and Warshaw2016) to demonstrate the utility of crowdsourcing for building on existing replication data. As with the mayoral information task, workers were presented with a single city, randomly assigned to a city via 2Randomize and were asked to search online to see if the city had undergone a financial crisis in the previous 20 years. Workers were told:
We want to know if there is any history of the city experiencingfinancial distress such as bankruptcy, financial distress, fiscal crises, monitoring by the state government, issues with cash flow, unpaid debt, or large pension debts anytime over the last twenty years. Most cities will NOT have experienced financial distress. You might try searching for the city and terms like “city budget problems” or “financial distress.” You might obtain this information from local news stories, Wikipedia, or other sources. If the city has experienced distress, please record the site where you get this information, as well as the years when the city experienced the distress.
Workers answered whether the city had gone through a financial crisis and provided a start and end year of the crisis and URLs for where they found the information. Workers were asked if they would like to be contacted for future tasks and if they ran into any issues with the task. We estimated that the task would take 5 minutes and the median time for completion was 2.4 minutes. The cost of assigning three workers to collect data on each city was $798. Workers were paid $.55 per task, which resulted in an average hourly wage of $14.
Task simplicity: The financial crisis data collection process relied less on the workers consulting one or two potential sources of information and more on the workers assessing multiple pieces of information. Thus, the potential for error in the process was much higher, given that the process was not a simple “search and retrieve” function but instead required the workers to make a judgment of information. We thus classified this as a more difficult task. We validate this information against a dataset collected by one of the authors via newspaper searches, Moody’s bond ratings, and think tank, news, and nonprofit lists of cities in financial crisis. The author’s database took four years of work to assemble, including work by a full-time graduate student research assistant for three months.
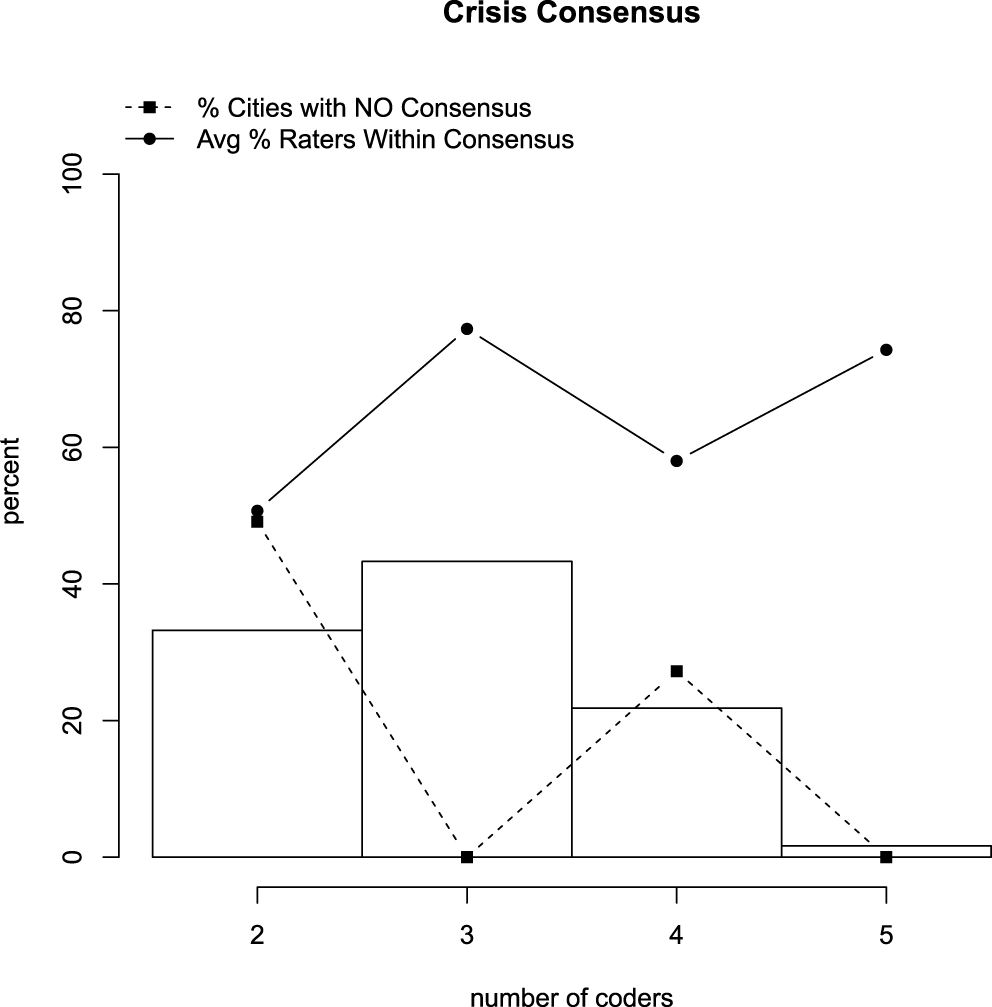
Consensus: For task 2, we examined whether the consensus of the workers agreed about whether or not there had been a previous crisis and compared this to our database. Because the task involved a dichotomous outcome (had the city experienced a financial crisis or not), we apply the exact consensus measure. In 77.8% of the cities, the workers agreed about the outcome. We also find a very similar pattern of correctness by the number of coders (see Figure 3): 3 seems to be the number where researchers can evaluate the quality of responses, but no additional data quality is gained from more workers. As before, the black square, dashed line is the percentage of cities that did not reach a consensus, while round dot, solid line is the average percentage of coders within each city that agreed with the consensus.
Can the crowd accurately evaluate local financial crises? Overall, we found the crowd far better at evaluating the presence of a financial crisis than we anticipated. Looking at the financial crisis assessment, we find that the crowd is accurate, especially via consensus. Of the 1,000 cities in the dataset, 902 (90%) contain agreement between the consensus and the expert list—630 cities with the agreement that there has not been a crisis in the past 20 years and 272 cities with the agreement that there has been a crisis in the past 20 years. False positives (crowd believed there to be a crisis and there was not) occurred in 54 of the cases; these can be attributed to a crisis in an alternative government (a county, university, or school district—25 cities) or a city with the same name but in another state (Springfield, MA and Springfield, IL, for example—10 cities). In 19 of the cases—or 2.2% of the cities—the consensus identified a crisis when one does not exist and there was not a reasonable explanation as to why the coder had identified the crisis. False negatives (where the crowd missed a crisis when one exists) occurred very rarely—the crowd consensus missed a crisis in three cases. Like with wave 1, the crowd is occasionally more accurate than expert list; there are 22 cities where the crowd identified a crisis and the expert had not previously identified a crisis in that location.
Consensus metrics for financial crisis by number of coders.

7 Suggestions and Best Practices for Implementation
In addition to providing some practical tools for researchers aiming to crowdsource local government data, we also have suggestions for best practices. To assist others interested in using crowdsourced workers for data collection, we created a how-to document, which is available in Supplementary Appendix. Novice users who do not frequently request tasks on MTurk will find that Supplementary Appendix includes a step-by-step guide to aid in adapting this research tool, while researchers more familiar with MTurk, Qualtrics, or data programming may find particular parts of the manual useful. For launching the crowdsourcing task, we have several suggestions. The first one is to use our website, 2Randomize, to handle the randomization task if researchers are not comfortable with a programming language that will allow them to program the randomization themselves. Second, aim (and budget) to have 3–4 coders per city. Fewer than that has a high rate of nonconsensus because it allows no room for error. More than three or four coders per item produces an additional cost with little to no added benefit in data quality. Third, use TurkPrime (Litman et al. Reference Litman, Robinson and Abberbock2017) to monitor the task and ensure that workers are compensated an appropriate wage for their work; one advantage of TurkPrime is that you can provide bonuses even after workers have finished the task if you have underpaid them for their work. Finally, consider whether there might be an advantage of having workers collect more than one piece of information at a time. We have outlined how to add data collection items to each task in Qualtrics. This might be particularly interesting for researchers who believe that there is some element of learning that needs to occur before workers provide quality data.
After collecting the crowdsourced data, we have suggestions for processing it. Exact matching works well for dichotomous choices but not for complex pieces of data. Instead, we suggest using a string similarity measure rather than string matching to account for the potential for misspellings, typos, and other text entry quirks. The cutoff you use for determining whether there is a consensus should be conditioned on the type of data. Dates should have a higher cutoff than names and email addresses due to the logic of the string similarity. If there appears to be no consensus, we recommend that researchers collect the data themselves. Some of those may be errors and others may be informative on their own. Luckily, this task is far less arduous than collecting the entire dataset from scratch for the researcher.
We find no evidence that coder characteristics or city characteristics (apart from city size) predict correctness (see Supplementary Appendix C), but it may be helpful to advise coders against using Wikipedia, which can be out of date or misleading. We do recommend recruiting beta testers prior to launch to determine the wording of questions and instructions. Beta testers can also help you determine a likely range of reasonable completion times, which can both help you calculate an ethical wage on an hourly basis and institute a time cap.
7.1 Future Applications
While we believe our approach will prove especially useful for acquiring local data, researchers engaged in a variety of data collection tasks may find that this approach increases their data access to data, validity, and replicability. We suggest a variety of options for using the approach, with the firm stance that we have not covered nearly the universe of applications.
Local data: We anticipate that researchers interested in local data collection could use crowdsourced workers to gather information on candidates for local office, political campaigns, historical election results, backgrounds of candidates, endorsements, campaign contributions, issues or trait presentations on websites, or voting returns, especially at the precinct level. Crowdsourced workers could also be used to access zoning rules, the membership of local boards and commissions, or the composition of or contact information for local political party leadership (Crowder-Meyer Reference Crowder-Meyer2013). Local media coverage and information about the characteristics of local reporters could be crowdsourced (Searles and Smith 2015). We also anticipate that crowdsourced workers could be used to identify data sources, such as links to city council meeting minutes, videos of debates, or news coverage for researcher to then analyze.
State-level data: Several organizations routinely collect information about who holds state-level office in the United States. Additionally, crowdsourced websites such as OurCampaigns.com provide some information on state and local elections. Researchers might consider using crowdsourced workers to collect information to supplement these existing datasets, such as cataloging the candidates for office, identifying key events in campaigns, or researching endorsement information for candidates. Crowdsourced workers might also enable researchers to build on, supplement, or extend data collection enterprises like Hansen and Clark’s Descriptive Representation in State Legislatures project (2019). And, while researchers increasingly know about the sponsorship behavior and the content of legislation within state legislatures (Holman and Mahoney Reference Holman and Mahoney2018; Collingwood, Omar El-Khatib, and O’Brien Reference Collingwood, Omar El-Khatib and O’Brien2019), opportunities exist to use crowdsourced workers to collect committee meeting minutes, floor votes, and bill markups.
Comparative data collections: Scholars engaged in comparative data collection exercises might consider the ways that in-country MTurk workers could provide an opportunity for on-the-ground data collection. Researchers might use MTurk workers to collect bill sponsorship information in subnational governments abroad (Barnes Reference Barnes2016), document candidate lists (Barnes, Tchintian, and Alles Reference Barnes, Tchintian and Alles2017), or collect background, occupation, or descriptive information about candidates or leaders (Schwindt-Bayer Reference Schwindt-Bayer2011; Barnes and Holman Reference Barnes and Holman2018). This could also be a fruitful way to collect data on phenomena that can manifest in different ways, such as regulations on foreign direct investment (Pandya Reference Pandya2014). For researchers aiming to collect information about many indicators of a latent trait (Gandhi and Sumner Reference Gandhi and Sumner2019), the ability to crowdsource these may greatly reduce both the time it takes to conduct the research as well as the cost.
Moving beyond political science: While our examples have focused on political science, there are ample opportunities for researchers in sociology, psychology, education, policy, public administration, anthropology, or economics to use crowdsourced workers to collect data. Information on the composition of religious bodies (Guhin Reference Guhin2018), charter school boards (Lay and Bauman Reference Lay and Bauman2017), or appointed positions in the local government (Hamidullah, Riccucci, and Pandey Reference Hamidullah, Riccucci and Pandey2015) would all be easily collected by MTurk workers, but the opportunities hardly stop there. We hope that scholars from a wide range of disciplinary approaches would see crowdsourcing as an opportunity to increase the quality and accessibility of their data.
What crowdsourcing (probably) cannot do: In our use of crowdsourced data collection processes, several clear lessons emerge: first, researchers need to be familiar with the data collection process that they are asking workers to engage in; without this, researchers do not know what to ask for and thus cannot provide clear instructions. Thus, exploratory data collections are probably better done by elites or trained students. Crowdsourcing is also not a viable alternative if researchers are simply too cheap to hire workers at a minimum wage; instead, researchers should anticipate that crowdsourced workers can produce data more quickly and potentially with fewer errors than other workers who were paid the same wage (such as undergraduate research assistants). Finally, for tasks where a researcher needs some level of professional training to evaluate the quality of data or differentiate between two data sources, crowdsourced workers may introduce more error into the process over trained researchers.
8 Conclusion
Scholars of local politics have long decried the lack of attention that political science pays to what happens in cities, counties, and other local layers of government, leading scholars to claim that “No ideas escape the event horizon surrounding urban politics; furthermore, ideas from outside rarely penetrate the subfield’s borders” (Sapotichne, Jones, and Wolfe Reference Sapotichne, Jones and Wolfe2007, 76). One of the principal causes beyond this disconnect is the lack of reliable, replication-ready, cheap data on local politics in the United States. We offer a new remedy: crowdsourcing data collection.
We take up the task of data collection in local politics and show that in less than a week and for less than $1000, researchers can have an up-to-date accounting of the mayors of cities with a population over 50,000 in the United States, their email addresses, and their election dates. We develop a system for evaluating the “correctness” of this data, focusing on consensus as a signal of a correct answer. We then compare this against a gold standard benchmark dataset purchased from another source and find that consensus provides an incredibly accurate dataset. We argue that this provides further evidence of the value of crowdsourcing as a mechanism for collecting data on local politics, with the caveat that hiring at least three workers per task will increase the data quality. This further reduces the time and cost necessary to complete the data collection process.
Throughout this process, we present a new way of using crowdsourced workers: to collect data in arenas where existing data collection is expensive, unreliable, limited in scope, or simply unavailable. We also argue that crowdsourcing data makes it easier for scholars studying local politics fall into line with the movement of political science toward transparency and reproducibility. Lowering the costs of data collection make it less likely that someone will be inclined to “hoard” their data until they have fully published from it. And data can easily be re-collected, reproduced, and extended (Benoit et al. Reference Benoit, Conway, Lauderdale, Laver and Mikhaylov2016, 278). Finally, crowdsourcing democratizing elements allow more people to ask urban politics questions, which pushes the field toward transparency. While crowdsourcing is not the answer to all data-related questions for local politics scholars, it does offer a clear path forward that does not involve the dedication of enormous amounts of time or resources.
Supplementary material
For supplementary material accompanying this paper, please visit https://doi.org/10.1017/pan.2019.32.