I. INTRODUCTION
LiFePO4 is a particularly advantageous cathode material for lithium-ion rechargeable batteries. Compared to conventional cathode materials, such as LiCoO2 and LiMn2O4, it has improved capacity retention versus charge–discharge cycle numbers, particularly at elevated temperatures, and it is less toxic, more affordable, thermally stable, easily synthesized, and environmentally safe.Reference Padhi, Nanjundaswamy and Goodenough1–Reference Striebel, Guerfi, Shim, Armand, Gauthier and Zaghib3 Particularly, LiFePO4 is much safer at higher temperatures, owing to the thermal stability of PO43− polyanion.Reference Padhi, Nanjundaswamy and Goodenough1 LiFePO4 has an ordered olivine structure (S.G: Pnma) in which FeO6 octrahedra share common corners in the b–c plane. The oxygen atoms in the crystal structure of LiFePO4 are arranged in distorted, hexagonal close-packed arrangement, in which the lithium and the iron atoms occupy octahedral sites, whereas the phosphorous atoms occupy the tetrahedral sites. The strong P–O covalent bonds stabilize the antibonding Fe3+/Fe2+ state through the Fe–O–X (X = P, S, As, Mo, or W) inductive effects to produce high operating potential. This results in a high lithium intercalation voltage of 3.4 V versus lithium metal. LiFePO4 also has a high theoretical capacity of 170 mAh/g. However, its application as a cathode material has been largely hampered by its poor electrical conductivity (10−9 S/cm)4 when compared to that of LiCoO2 (10−3S/cm)Reference Molenda, Stoklosa and Bak5 and LiMn2O4 (10−5 S/cm).Reference Shimakawas, Numata and Tabuchi6 Suboptimal rate capability and electrochemical performance of LiFePO4 system are the consequences of its limited electrical conductivity.
Extensive research has been performed to enhance the electrical conductivity of LiFePO4 including the use of dopants, metal dispersions, carbon coating, and the cosynthesis of the phosphate with carbon.Reference Chung, Bloking and Chiang7–Reference Hu, Doeff, Kostecki and Finones20 Yamada et al.Reference Yamada, Chung and Hinokuma21 found that controlling the particle size by varying the annealing temperatures is important for the high performance of the LiFePO4 cathode material. On the other hand, Chung and ChiangReference Chung and Chiang22 found that by doping supervalent cations in LiFePO4, the electronic conductivity can be enhanced by a factor of 106 and capacity can be increased to about 160 mAh/g at C/10 rate. Nonetheless, Nazar et al. attributed such an improvement in electronic conductivity to the formation of an iron phosphide phase during high annealing temperature (>600 °C).Reference Subramanya Herle, Ellis, Coombs and Nazar23 Furthermore, Armand et al., by improving the kinetics of the electrochemical reaction and chemically coating LiFePO4 with conducting carbon, achieved a capacity value almost equal to the theoretical capacity at 80 °C.Reference Striebel, Guerfi, Shim, Armand, Gauthier and Zaghib3, Reference Ravet, Besner, Simoneau, Vall′ee, Armand and Magnan24, Reference Ravet, Goodenough, Besner, Simoneau, Hovington and Armand25 In addition, Delacourt et al.Reference Delacourt, Poizot, Levasseur and Masquelier26, Reference Delacourt, Poizot, Morcrette, Tarascon and Masquelier27 synthesized carbon-free LiFePO4 with a narrow particle size distribution by an aqueous precipitation method and delivered 140 mAh/g at C/10 rate. Recently, a low temperature polyol processReference Kim and Kim28 and sol–gelReference Dominko, Bele, Gaberscek, Remskar, Hanzel, Goupil, Pejovnik and Jamnik29–Reference Choi and Kumta33 technique have been successfully used in producing nanosized LiFePO4 particles of 20- to 40-nm size with much more favorable electrochemical properties. It is well established that nanosize particles with conductive coating are required to obtain high-capacity due to the intrinsic poor electrical conductivity of polyanion cathodes.Reference Prosini, Zane and Pasquali4 Therefore, numerous synthetic techniques have been used to produce nanosize phosphate-based cathode materials, and different processes are utilized to improve electrical conductivity of this class of cathode materials. It is also crucial to make phase pure phosphate with olivine structure to achieve high electrochemical performances. Impurity phases such as iron oxides and other non-olivine phosphates are detrimental to cell cycle life.Reference Arnold, Garche, Hemmer, Strobele, Vogler and Wohlfahrt-Mehrens18, Reference Salah, Mauger, Julien and Gendron34
In this article, we report a novel, simple, inexpensive, durable, and easily reproducible surfactant-based sol–gel technique for the synthesis of pure LiFePO4 and C-LiFePO4 cathode materials. We used lauric acid (LA) as a precursor in various concentrations to achieve different carbon coverage for LiFePO4 cathodes. We have demonstrated that electrochemical performance, particle morphology, and crystallite size of C-LiFePO4 cathode material vary as a function of carbon coverage. We observe that excess carbon coverage lowers the capacity of C-LiFePO4 material, which can be attributed to the reduction of the active component in the composite in conjunction with increasingly disordered carbon in the system. The optimum carbon coverage was obtained by incorporating 0.25 M LA precursor, which delivered a specific capacity very close to the theoretical limit of ∼170 mAh/g at C/2 rate.
II. EXPERIMENTAL
LiFePO4 and C-LiFePO4 samples were prepared by sol–gel method with CH3CO2Li.2H2O (lithium acetate dehydrate, 99%; Alfa Aesar, Ward Hill, MA), FeCl2.4H2O (ferrous chloride; Fisher Scientific, Pittsburgh, PA), and P2O5 (phosphorous pentoxide; Fisher Scientific) precursors. Each precursor was dissolved separately in ethanol (200 proof) to make 1 M solutions. The Fe and P solutions were first mixed in the desired stoichiometric ratio and stirred for 3 h followed by the addition of stoichiometric amount of the Li solution. After 3 h of stirring, 1 M solution of LA surfactant (Fisher Scientific) in ethanol was added to the main solution which was left for another 4 h to ensure the completion of the reaction to provide carbon shell structure on LiFePO4 nanoparticle cores. To prevent the formation of Fe3+ impurities, the entire synthesis process was carried out under an inert atmosphere maintained by a continuous flow of nitrogen gas. The resulting sol was kept at 80 °C until it dried off completely. Three C-LiFePO4 composite cathode materials with different amounts of carbon were prepared by setting the concentration of LA in the mixture to 0.25 M (sample B), 0.50 M (sample C), and 1.00 M (sample D), respectively. These dried sol nanopowders were annealed at 600 °C under the continuous flow of H2/Ar (10%:90%) reducing gas for 5 h to obtain the single-phase materials avoiding the formation of Fe3+-related complexes, except pure LiFePO4 (sample A), which was annealed at 500 °C for 5 h under identical conditions.
The phase purity of the samples was verified by powder x-ray diffraction (XRD) using a Rigaku RU2000 rotating anode powder diffractometer (The Woodlands, TX). Raman spectra of all samples were measured using a Jobin–Yvon Horiba Triax 550 spectrometer (Edison, NJ), a liquid-nitrogen-cooled charge-coupled device detector, an Olympus model BX41 microscope (Center Valley, PA) with a 100× objective, and a 514.5 nm Modu-Laser (Stellar Pro-L) argon-ion laser (South Centerville, UT). The laser power at the sample was maintained at very low level (∼1 mW) to avoid any heating effect. The Raman-scattered light from the sample was collected with the same microscope objective and focused on the entrance slit of the spectrometer with a 1200 line/mm diffraction grating. The data was recorded and analyzed by LabSpec software. The morphology and microstructure of the pure and three carbon-coated LiFePO4 powders were investigated by using a JSM-6510LV-LGS scanning electron microscope (SEM; Peabody, MA) and a JEOL-2010 transmission electron microscope (TEM; Peabody, MA). A precision materials analyzer (Radiant Technologies, Albuquerque, NM) was used to measure the conductivity of all samples by attaching electrodes to the top and bottom of pressed pellets with conducting silver epoxy.
For electrochemical characterization, the cathodes were prepared by mixing 80 wt% of active material, 15 wt% of an expandable graphite as a conducting material, and 5 wt% of ethylene propylene diene monomer (M-class-terpolymer) as a binder. This composite was mixed with xylene (using micronizer mixer) to make homogenous slurry paint. The slurry paint was coated on graphitized aluminum (Al) foil, using a 15-μm-gap doctor blade draw-down technique over a vacuum bench to hold down the Al foil. The electrode was then dried inside a well-ventilated hood for at least 3 h to remove excess xylene, and subsequently transferred into a hot antechamber (110 °C) of a dry box and evacuated for at least 4 h. The dry sample was then transferred into a box filled with Argon with less than 1 ppm oxygen and moisture, where disk electrodes were cut and tested in coin cells against lithium counter electrode. We used the binary electrolyte consisting of ethylene carbonate (EC) and dimethyl carbonate solvents (DMC), (50:50) with 1 M LiPF6. The electrochemical properties of the cells were characterized using galvanostatic charge and discharge studies performed at a current of 0.1 mA with cut off voltages of 2.2–4.4 V at room temperature.
We measured the surface area of the pure LiFePO4 and 0.25 M LA-coated LiFePO4 samples using a Quantachrome Autosorb Automated Gas Sorption System (Boynton Beach, FL). We outgassed 0.5761 g of the pure LiFePO4 sample at 150 °C for 39 h. The BET surface area of this sample was measured 3.33 m2/g. Similarly, 0.6207 g of 0.25 M LA-coated LiFePO4 sample was outgassed at 150 °C for 19 h, and a BET surface area of 54.13 m2/g was obtained. The sample containing the 0.25 M LA provides the best electrochemical performance, close to theoretical capacity at C/2 rate. The surface areas for the 0.50 and 1.0 M LA-coated samples were found to be 68.14 and 74.12 m2/g, respectively.
III. RESULTS AND DISCUSSION
The XRD patterns of one pure LiFePO4 and three C-LiFePO4 samples, shown in Fig. 1, are characteristic of the ideal orthorhombic olivine structure without any discernable impurity phases, where all the peaks can be indexed in the orthorhombic LiFePO4 system with the Pnma space group (PDF No. 40-1499). We did not observe any major effects of carbon coating on the XRD of the cathode materials, except a minor change in the width of some of the peaks, suggesting that the coated carbon is largely amorphous. The crystallite size (D) was calculated from the Scherrer equation β Cos (θ) = kλ/D, where β is the full-width-at-half-maximum of the XRD peak and k is a constant (∼0.9).Reference Xia, Yoshio and Noguchi35 The mean crystallite size D of the LiFePO4 decreased from 29 nm to approximately 23 nm when LA was added during the synthesis. The addition of LA increased the residual carbon content. Specifically, in the three C-LiFePO4 samples we get 3.7, 7.8, and 11.6 wt% of carbon corresponding to 0.25, 0.5, and 1 M LA, respectively. The room temperature electronic conductivities measured on the pellet synthesized with and without the surfactant are 5.0 × 10⁻⁸ and 6.4 × 10⁻⁴ S cm−1 for the pure LiFePO4 and 0.25 M coated LA samples, respectively (Fig. 2). The four orders of magnitude higher conductivity of the 0.25 M treated sample in comparison with the pure LiFePO4 sample suggests that a percolating network of carbon coating is formed to facilitate the charge transport. The conductivity value for pure LiFePO4 is also somewhat higher than the literature value,Reference Prosini, Zane and Pasquali4 which could be partially due to the presence of a small amount of Fe2P metallic magnetic impurity phase (having high electrical conductivity ∼5.2 × 10⁻² S cm−1 in pressed powder forms) in the cathode material.Reference Subramanya Herle, Ellis, Coombs and Nazar23 Although the amount of Fe2P impurities was so minute that the XRD measurements did not indicate the presence of the strongest (111) peak corresponding to the phosphides near 2θ angles in the range of 40.28–42.39°,Reference Arnold, Garche, Hemmer, Strobele, Vogler and Wohlfahrt-Mehrens18 our Mossbauer spectroscopy measurement (A. Dixit et al., unpublished data) indeed revealed the presence of a phosphide peak in the form of a quadrupole doublet. The presence of Fe2P phase has been suggested to increase the electronic conductivity,Reference Subramanya Herle, Ellis, Coombs and Nazar23 with respect to other insulating iron oxide phases, which usually hamper electronic conductivity and thus electrochemical performance. Using the sensitivity of Fe57 Mossbauer spectroscopy, we identified four iron-containing phases in the pure and carbon-coated cathode materials (A. Dixit et al., unpublished data). These are Fe2+ in LiFePO4, Fe2P, γ-Fe2O3, and Fe phases. The amount of Fe2+ varied between 80 and 85% in the samples. There was no Fe2P phase identified in the pure LiFePO4 sample. The amount of Fe2P remained practically constant at 9% in the three carbon-coated samples. The amount of iron oxide varied between 0 and 4%, and the metallic Fe phase varied between 9 and 4% for the 0.25, 0.50, and 1 M samples, respectively. Thus, for the majority of the impurity phases, Fe2P and Fe, the d-electrons of iron will be delocalized extending the d-electron wave functions over many iron sites, which would affect the conducting and electrochemical properties of the carbon-coated samples. It appears that the effects of Fe2P impurity phase in influencing the conducting and electrochemical properties would be about the same but may be different when considering the Fe impurity phase. We speculate that the presence of residual metallic iron is due to a carbothermal reduction of iron oxide with reactive carbon that is formed by thermal decomposition of LA during heating process.
Powder x-ray diffraction patterns of pure LiFePO4 (samples A) and three different carbon-coated LiFePO4 samples B (0.25M LA), C (0.50M LA), and D (1.0 M LA), respectively.

Conductivity of pure LiFePO4 (sample A) and three different C-LiFePO4 samples B (0.25M LA), C (0.50M LA), and D (1.0M LA), respectively.

The morphology and the microstructure of the pure and carbon-coated LiFePO4 samples analyzed by SEM measurements are shown in Figs. 3(a), 3(e), and 3(g), respectively. It is clear that the average size of the nanoparticles in the carbon-coated sample is smaller than that in pure LiFePO4 suggesting that the addition of LA inhibits the particle size growth. The corresponding TEM images for pure and carbon-coated LiFePO4 samples [Figs. 3(b), 3(f), and 3(h)] show that the nanosized particles are highly spherical with smooth surfaces and are well dispersed for lower LA carbon-coated samples. Additionally, we also observed the onset of small nonuniformity in the size of particles for higher LA carbon-coated LiFePO4 sample [Fig. 3(h)]. The representative electron diffraction pattern and high-resolution TEM micrograph, shown in Figs. 3(c) and 3(d) respectively, suggest that these LiFePO4 nanoparticles are highly crystalline. We do not observe any discernible carbon coating on pure LiFePO4 nanoparticles [Fig. 3(b)]. On the other hand, the carbon-coated LiFePO4 nanoparticles are uniformly covered with an about 4-nm-thick layer of carbon, as shown in Fig. 3(f), which appears to be favorable for lithium-ion transport across the interface between LiFePO4 and the electrolyte in addition to the enhanced electronic conductivity. The surface of the nanoparticles also contains nanorods of Fe2P as indicated by the arrows in the Fig. 3(f). Such crystallites/nanorods have previously been reported in another studyReference Rho, Nazar, Perry and Ryan36, Reference Kim, Park and Lee37 and have been suggested to enhance conducting property of the cathode materials. The SEM/TEM micrographs for LiFePO4 samples with higher carbon concentration [Fig. 3(h)] exhibit large clusters with nonuniform carbon coverage unlike the 0.25 M LA-carbonated LiFePO4 sample. The structure of the carbon, particularly the sp3/sp2 disordered/graphitic (D/G) ratio, strongly influences the electronic conductivity of the cathodes. Samples containing smaller amounts of high-quality carbon (graphitic) can outperform those containing larger amounts of less-conducting carbon (disordered). It has been shown that the structure of the carbon in the composite cathode materials strongly depends on the nature of the carbon source (organic or polymeric precursor) and the processing conditions. The excess of carbon coverage has been known to change the diffusion length and reduce ionic conduction.Reference Peters, Kortes, Hesse, Zakharov and Janek38
(a), (e), and (g) are SEM images and (b), (f), and (h) are TEM images of pure LiFePO4, 0.25 M LA and 1.00 M LA-carbon coated LiFePO4 samples, respectively. (c) Selected area electron diffraction pattern of LiFePO4 crystallites from pure LiFePO4 sample, and (d) high-resolution TEM image for pure LiFePO4 crystallite.

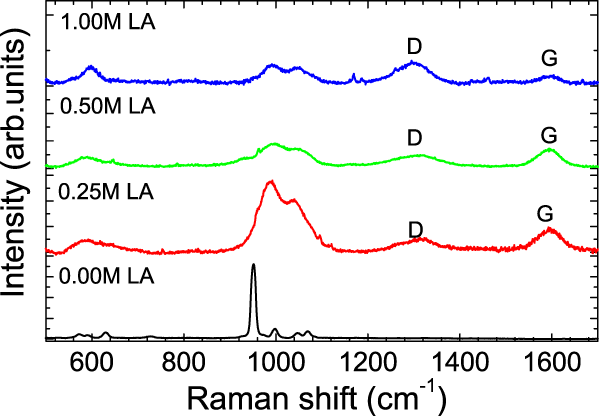
Figure 4 shows the Raman spectra of pure LiFePO4 sample (annealed at 500 °C) and three C-LiFePO4 samples (annealed at 600 °C) in the 500–1700 cm−1 region. The observed low wavenumber Raman vibrational modes (below 500 cm−1) are not shown here. However, they are in good agreement with the reported values.Reference Peters, Kortes, Hesse, Zakharov and Janek38 The representative Raman spectrum for LiFePO4 sample, shown in bottom panel of Fig. 4, consists of a strong Raman mode ∼950 cm−1 [Ag(9)] along with 998 cm−1 [Ag(10)], 1047 cm−1 [Ag(11)], and 1069 cm−1 [B2g(11)] modesReference Shi, Zhang, Ke, Ouyang, Lei and Chen39 without any discernible signature for possible carbon-associated Raman modes. The Ag(9) mode shifts toward higher energy ∼990 cm−1, and its energy remains nearly independent of carbon concentration in LiFePO4. More interestingly, there is a significant drop in the intensity of Ag(9) Raman mode after carbon functionalization and reduces continuously with increased carbon concentration in LiFePO4. In addition to this Ag(9) mode, we also observed a broad peak centered at ∼1040 cm−1, indicating the smearing of Ag(10), Ag(11), and B2g(11) Raman modes. The observed shift in the Ag(9), Ag(10), Ag(11), and B2g(11) modes and strong reduction in their intensity after carbon coating suggests a strong carbon bonding with LiFePO4 lattice. Additionally two intense broad peaks at ∼1350 and ∼1590 cm−1, assigned to the D- and G-bands of residual carbon,Reference Song, Reade, Kostecki and Striebel40 respectively, have been found to depend strongly on the carbon content in the samples. These two bands represent the fingerprints of the amorphous and graphitic carbon content present in the surface layers of these particles. Figure 4 illustrates the change of the shapes of the D- (sp3-type carbon) and G-bands (sp2-type carbon) for the three carbon-coated samples. To evaluate the effect of carbon coverage, we calculated the D-band to G-band intensity ratios, ID/IG, for the 0.25, 0.5, and 1 M C-LiFePO4 samples, which are 0.750, 0.817 and 0.833, respectively. It appears that a thinner uniform carbon coat on the LiFePO4 nanoparticles is responsible for an enhanced electrochemical characteristics. It is well known that the ID/IG Raman intensity ratio decreases as the carbon coating becomes less disordered (more graphitic), leading to the enhancement of the electronic conductivity and higher performance of the LiFePO4 composite electrode. This is consistent with our finding that the LiFePO4 sample with the addition of 0.25 M LA has the largest electrochemical capacity and the lowest ID/IG intensity ratio among all samples.
The characteristic Raman vibrational spectra for samples A (pure LiFePO4), B (0.25 M LA), C (0.50 M LA), and D (1 M LA) in the range 500–1700 cm−1.
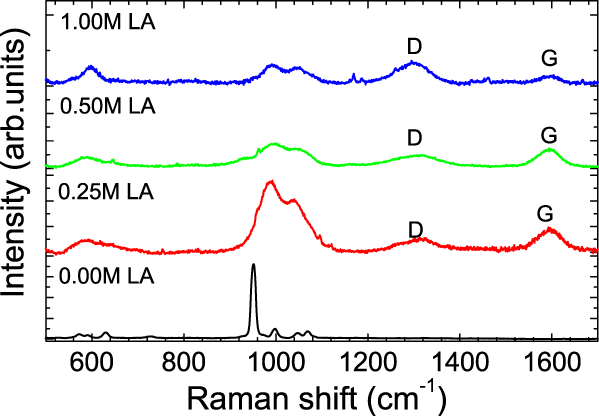
Figure 5(a) shows the galvanostatic charge–discharge profiles of the four LiFePO4 cathode samples, A, B, C, and D, measured at C/2 between 2.2 and 4.4 V versus Li. The LiFePO4 synthesized without surfactant (sample A) yielded only ∼75 mAh/g at C/2 rate. The specific capacity improved when LA was introduced to the LiFePO4 material. At C/2 rate, specific capacity was 100 mAh/g for the 1 M and 140 mAh/g for 0.5 M LA precursor solutions. The LiFePO4 synthesized with 0.25 M surfactant exhibited significantly better electrochemical performance with a specific capacity of ∼170 mAh/g, very close to the theoretical limit. This significant improvement in the electrochemical kinetics of the C-LiFePO4 powders could be attributed to a number of factors, such as improved surface area, reduced particle size, and the porous structure of the phosphates, as well as formation of a more conductive carbon coating. The increased value of the specific surface area along the a–c plane caused by a narrow distribution of nanosized particles would tend to offset the barriers to high rates governed by both the poor intrinsic electronic and ionic conductivities of the phosphates.Reference Delacourt, Poizot, Levasseur and Masquelier26, Reference Chen, Song and Richardson41, Reference Srinivasan and Newman42 The electronic diffusion coefficient in the olivine LiFePO4 cathode is known to be 8 × 10⁻¹⁸ m2 s−1, and the Li+ diffusion coefficient in the LiFePO4 and close to fully charged FePO4 phases is found to be 1.8 × 10⁻¹⁸ and 2.2 × 10⁻²⁰ m2 s−1, respectively.Reference Prosini, Lisi, Zane and Pasquali43 By comparison, the Li+ ion and electronic conductivities are in the same range of magnitude; it would be important to shorten both electronic and ionic paths within the particlesReference Franger, Lecras, Bourbon and Rouault44, Reference Wang, Sastry, Striebel and Zaghib45 to achieve better conducting behavior of the material. In the case of pure LiFePO4, the particles have wide size distribution. Therefore, the smaller particles will be lithiated faster than the larger ones particularly during fast discharge/charge reaction, and the LiFePO4 near the center of the larger particle will thus contribute very little to the redox reaction.
(a). The voltage profile recorded during charge–discharge versus the specific capacity; (b) the discharge-specific capacity versus the cycle number for pure and different concentration of lauric acid (LA) surfactant carbon-coated LiFePO4 samples; and (c) capacity versus molar fraction of LA used for the synthesis of these carbon-coated LiFePO4 samples.

By adding surfactant to the pure cathode material, we inhibited particle size growth and created a porous structure for the 0.25 M sample to achieve unhindered transport of electrolyte into the particle’s exterior.Reference Dominko, Goupil, Bele, Gaberseek, Remskar, Hanzel and Jamnik15, Reference Takahashi, Tobishima, Takei and Sakurai17 In addition, we increased the surface area from 3.33 m2/g for pure LiFePO4 to 55.41 m2/g for the 0.25 M LA-carbonated LiFePO4 sample. This feature has a direct consequence to the electrochemical performance (specific capacity ∼170 mAh/g) among the four samples investigated in this study. The porosity and the thickness of cathode play an important role in the electrochemical and conducting properties of the electrodes in Li-ion batteries. Small pore size has been shown to produce better electronic conductivity but not so good ionic conductivity. In a recent studyReference Chen, Wang, Zhang and Sastry46 on a composite material Li/LiPF6:(EC and DMC; 2:1 v/v)/Li(Ni1/3Mn1/3Co1/3)O2/Al, it was noticed that the active electrode material [volume fraction percentage (vf%)] increases almost linearly with decreasing porosity (vf%). Therefore, there is a trade-off between the ionic conductivity of the electrolyte phase and electronic conductivity of the solid phase. The porosity also influences the utilization of the cathode materials. In one-dimensional simulation, it was found that at C/10 rate, the lower porosity shows better capacity.Reference Chen, Wang, Zhang and Sastry46 However, as the C-rate increases, the higher porous electrode has higher capacity. The sample B with 0.25 M carbon additive has the best electronic conductivity and the C-rate among the four samples. But, adding more carbon to the sample not only reduces conductivity and C-rate but also penalizes the gravimetric properties irrespective of enhanced surface area for 0.75 and 1.00 M LA carbon-coated samples.
Figure 5(b) shows a plot of capacity versus cycle number for Li/LiFePO4 cells containing different concentrations of LA surfactant additives. It shows clearly that the specific capacity of the C-LiFePO4 with 1.00 M LA decreased faster during the early cycles, signifying high contact and matrix resistance related to the poor electronic conductivity of the carbon-rich phosphate.Reference Song, Reade, Kostecki and Striebel40 However, the specific capacity of the 0.5 and 0.25 M LA-surfacted LiFePO4 slightly increased with the early cycles and remains almost constant with the number of cycles for all the samples. The specific capacity of the sample with 0.25 M LA concentration was found to be the highest, approaching the theoretical value of ∼170 mAh/g. The specific capacity decreased with further increasing LA concentration, as shown in Figs. 5(b) and 5(c). The constant value of the specific capacity with cycling numbers for all the four cathode materials validates the uniform and nanosized nature of the LiFePO4 particles. The observed excellent cycling characteristics combined with improved kinetics of LiFePO4 confirm the importance of optimizing the particle size and porosity of the LiFePO4 electrode material synthesized using LA as the surfactant. Also, improvement in electronic conductivity through effective carbon coating by varying the amount of surfactant could further optimize the rate capability. As a continuation of the current study, the effect of various carboxylic acids, such as myristic and oleic acids, on the microstructure and electrochemical performance is being investigated presently and will be reported subsequently.
IV. CONCLUSION
Nanostructured LiFePO4 and three C-LiFePO4 powders were prepared by a sol–gel method using LA as the surfactant. The three C-LiFePO4 synthesized with LA delivered specific capacity values of 100, 140, and 170 mAh/g for 1, 0.5, and 0.25 M surfactant concentration at a discharge rate of C/2, respectively, which is significantly better compared to the phosphate obtained without any surfactant (∼75 mAh/g). These results show that the rate of performance for LiFePO4 cathode can be enhanced by optimizing the particle size and porosity of LiFePO4 particles through treatment with a suitable surfactant. The major advantage of the current sol–gel approach is the formation of a porous networked structure with uniform particle size by utilizing a carboxylic acid surfactant, which acts as a capping agent, preventing and minimizing the agglomeration of the phosphate particles.
ACKNOWLEDGMENTS
We thank Robert Cunningham from Kettering University for assisting with SEM work. We are also thankful to the Richard Barber Foundation for the financial support to perform this work.