

Introduction
The study of the interaction between horses and surfaces during different activities is essential to understand the sport-specific risks associated with the material properties of the surface. Recent research in the equine industry has been focused on the hoof surface interaction and how different types of surfaces can affect aspects of equine locomotionReference Thomason and Peterson1. Material characteristics of surfaces can have a profound effect on the limb loading ratesReference Reiser, Peterson, McIlwraith and Woodward2–Reference Robin, Chateau, Pacquet, Falala, Vallette and Pourcelot4, shock and vibration characteristicsReference Robin, Chateau, Pacquet, Falala, Vallette and Pourcelot4–Reference Gustas, Johnston and Drevemo6, tendon loadsReference Crevier-Denoix, Pourcelot, Ravary, Robin, Falala and Uzel3, hoof landing velocityReference Burn and Usmar7, hoof deceleration and braking forcesReference Robin, Chateau, Pacquet, Falala, Vallette and Pourcelot4, Reference Gustas, Johnston and Drevemo6, Reference Chateau, Robin, Falala, Pourcelot, Valette and Ravary8. From these results, surface-induced changes have been implicated in relation to the incidence of musculoskeletal injuries, although the specific demands on the horse will also influence the level of risk.
One such demand relates to leading limb hoof slide during jump landing, as mechanical stress has been reported to increase with increases in horizontal shockwaves and vibration through the distal limbReference Robin, Chateau, Pacquet, Falala, Vallette and Pourcelot4–Reference Gustas, Johnston and Drevemo6, Reference Chateau, Robin, Falala, Pourcelot, Valette and Ravary8. Hoof slide has been measured using kinematics and force platformsReference Merkens, Schmhardt and Van Osche9–Reference Wilson and Pardoe11, with force platforms considered to be the ‘gold standard’ when detecting the initial hoof contactReference Schamhardt and Merkens12. As force platforms are often embedded into a concrete runway and covered by rubber matting, the majority of studies that have reported hoof slide from force platforms are restricted by the number of different surfaces that can be investigated and by the types of activities that can be performed upon themReference Schamhardt and Merkens12–Reference Ramon, Prades, Armengou, Lanovaz, Mullineaux and Clayton14. In addition, the stiffness characteristics of the force plate will alter the overall hardness characteristics of a surface.
Jumping mechanics have mainly been studied using kinematic analysesReference Hole, Clayton and Lanovaz15, but difficulties in determining foot strike and hoof slide from kinematic data remain. Accurate knowledge of the timing of the initial ground contact is necessary to determine hoof slide, which is difficult to pinpoint accurately from kinematic analysis aloneReference van Weeren, van den Bogert, Bruin and Barneweld16. The use of fetlock angle to detect limb impact from kinematics was investigatedReference Schamhardt and Merkens12, and it was reported that the angle of the fetlock joint does not show a recognisable peak that can be used as an indicator for ground contact. Another studyReference Peham, Scheidl and Licka13 developed a kinematic method based on speed distribution analysis to detect the stance phase of horses walking and trotting on a treadmill and over ground and human walking, and found results comparable to those obtained for a force platform. For a study investigating the surface effects from kinematic data at trot, the start of the stance phase was determined when the base of the hoof first went below the level of the track surfaceReference Burn and Usmar7. Horizontal velocity of a hoof marker has also been used to determine foot contact during walking and trotting on a treadmillReference Bobbert, Gomez Alvarez, van Weeren, Roepstorff and Weishaupt17, and vertical displacement and velocity of a marker positioned on the first phalanx (PI) were previously used to determine foot contact during jump landing on an arena surfaceReference Hobbs, Brigden, Northrop and Richards18. Similar methods have also been reported to define human gait eventsReference Mickleborough, van der Linden, Richards and Ennos19.
For field-based kinematic studies on more compliant surfaces, detection of foot contact is still somewhat problematic, and therefore the overall aims of this study were (1) to develop and validate a simple device capable of determining foot strike on an arena surface using a force platform; and (2) to apply the method in the context of measuring foot strike during jump landing on an arena surface, and compare the results with kinematic results.
Two separate studies were designed to validate the device developed to determine foot strike on an arena surface against a ‘gold standard’ (force platform) under laboratory conditions. For both the studies, the time the device switched ‘on’ was compared with the timing of force platform onset, and to the applied load and loading rate at the time the device switched ‘on’. The first study aimed to explore the difference in timing with respect to load and loading rate by using two different activities that are known to produce different loading rates at foot strike. The second study aimed to explore the difference in timing with respect to a difference in depth of an arena surface. Consistency in timing from the device (that is, no significant differences in timing between activities or depths) was required if precision in foot strike determination on an arena surface was to be achieved. A field-based study was then used to test the device in the context of measuring foot strike during jump landing on an arena surface.
Ethical approval
Ethical approval was obtained for this project from the School of Psychology Ethics Committee, University of Central Lancashire (UCLan), the Animal Projects Committee, UCLan and Myerscough College Ethics Committee.
Methods
Loading rate study
Participants
Fifteen healthy participants having a height of 1.78 ± 0.1 m and weight of 75.4 ± 15.5 kg (mean ± SD) were used in the study.
Equipment
Eight infrared cameras (Qualysis Medical AB, Goteburg, Sweden) were positioned around a force platform (Kistler Instruments Ltd, Alton, UK; Model 9281CA) and calibrated. The onset threshold of the force platform was set to 20 N. A large groundsheet was placed over the force platform and surrounding area and secured [12 mm of a medium-density fibreboard was bolted to the force platform, which was then covered with 6.5 mm sports flooring (Altro Mondosport HP20, Altro Ltd, Letchworth Garden City, UK)]. A bespoke contact mat (the device developed) was then positioned on the groundsheet over the force platform. The mat consisted of two layers of 600 × 400 mm aluminium foil glued to Fablon sticky-back plastic (to produce two electrodes), and separated by high-density 3 mm laminate floor underlay with 30 × 30 mm2 cut-outs. A commercial high-strength, fabric-backed 50 mm-width tape was then wrapped around the two electrodes to form the mat. To each sheet of the aluminium foil a single-core 1 mm wire was wired in series to an adjustable output AC/DC convertor (Farnell Instruments Ltd, Leeds, UK) set at 13 V DC and 13 V 250 mA DC infrared emitter with 20° viewing angle (Honeywell Sensing and Control, North Shields, UK) in a ‘normally open’ circuit design. When pressure was applied to the mat the two electrodes contacted, which completed the circuit and illuminated the infrared emitter, indicating that the mat had switched ‘on’. Due to the elasticity of the foam, automatic recoil occurred once the pressure was released, and the electrodes separated, thus breaking the circuit and consequently the light was extinguished.
Once in place, a retaining rubber matting was arranged around the area of the force plate and contact mat, coarse sand was then used to fill the internal volume and arena surface was used to cover the contact mat to a depth of 2 cm. The offset of the centre of pressure was then adjusted to include the total floor surface to force platform centre, a distance of 65 mm. A 360 mm-high platform was positioned to the side of the force platform during step-down trials, and was moved away from the path of participants during running trials.
Procedure
The height and weight of each participant was recorded, retroreflective markers were placed on the heel of each shoe for reference and then each participant completed a suitable warm-up. Participants completed three successful running trials at their preferred speed and three step-down trials from the platform. A successful trial was defined by a strike of either foot on the contact mat. Data were discounted when only the edge of the mat was contacted (which was determined from a three-dimensional reconstruction in the laboratory) or when the mat became badly deformed. Kinematic data, contact mat data and force data were all recorded at 500 Hz. The frame difference between force platform onset and the contact mat switching ‘on’, the force recorded when the mat switched ‘on’ and one frame prior to switching ‘on’ were extracted from Qualisys Track Manager (Qualysis Medical AB, Goteburg, Sweden), and were tabulated in Excel (Microsoft Corp., Redmond, WA, USA).
Data analysis
For each trial, the time delay (ms) between the onset of the force platform and the contact mat switching ‘on’ was calculated. Instantaneous loading rate was then calculated using the difference between the load when the mat switched ‘on’ and the load recorded for the frame before the mat switched ‘on’ divided by time. The mean, standard deviation (SD), variance and confidence intervals for each trial for the delay in timing between the force platform onset and the mat switching ‘on’ were calculated. The consistency of the mat was evaluated using a repeated measures general linear model to test for significant differences (P < 0.05) between the two activities and the three trials for delay, vertical force, anterior–posterior force and loading rate and their interactions. Relationships between delay and vertical force, delay and anterior–posterior force, and delay and instantaneous loading rate were evaluated for the two activities using Pearson's correlations with significance set at P < 0.05. All statistical analyses were carried out in SPSS (SPSS Inc., Chicago, IL, USA).
Surface depth study
Participants
Twenty-five healthy participants (a sample different from that of the activity study) having a height of 1.75 ± 0.07 m and weight of 72.6 ± 11.7 kg (mean ± SD) were used in the study.
Equipment
Equipment was arranged as described previously, but on this occasion, an arena surface was used to fill the internal volume and to cover the contact mat. Two depths were used to cover the contact mat, 1 and 2 cm. In order to maintain consistency of depth, the difference in mass (1.6 kg) of the surface removed was recorded and checked following each removal to the 1 cm depth.
Procedure
The height and weight of each participant was recorded, retroreflective markers were placed on the heel of each shoe for reference and then the participant completed a suitable warm-up. Participants completed three successful running trials (as defined previously) at their preferred speed at the 1 cm depth, and three successful running trials at their preferred speed at the 2 cm depth. Depths were alternated between participants. Kinematic data, contact mat data and force data were all recorded at 500 Hz. Data were extracted as described previously.
Data analysis
Data analysis was carried out as described previously, but for this study, consistency in delay between the two depths of the surface and relationships between delay and force and instantaneous loading rate for depth of surface were evaluated, with significance set at P < 0.05.
Field-based study
Participants
Six shod and clinically sound riding horses (162 ± 5 cm and 499 ± 25 kg) were used for this study. All horses were used for jumping lessons on average 4 h per week, and were capable of jumping >1 m. The horses were ridden by an experienced rider (international-level showjumper).
Equipment
The study was conducted in two indoor arenas with artificial surfaces of sand, rubber, fibre and wax composition. A two-striding double was set up along the long side of each arena, which was jumped from left to right and consisted of a cross-pole followed by a 1 m vertical. A high-speed camera (Redlake, Integrated Design Tools Inc., Tallahassee, FL, USA; Model M1) was positioned perpendicular to the landing side of the second element, and was calibrated using a 50 × 50 × 50 cm3 cube placed parallel to the direction of motion of the horse and in the centre of the leading limb landing area. A 3 m jump pole was placed perpendicular to the furthest jump wing of the second element to act as a horizontal reference in the field of view of the camera. On this occasion, a 6 V bicycle LED front light (Hugo Brennenstuhl GMBH & Co., Tübingen, Germany) was connected to the contact mat and positioned on a tripod in the right-hand corner of the field of view of the camera.
Procedure
Self-adhesive circular markers were attached to the proximal third metacarpal bone, the centre of rotation of the metacarpophalangeal joint and the distal first PI of the right forelimb. In addition, two horizontal, spherical markers were attached to a polymer frame that was secured to the lateral side of the shoe of the right forelimb in a horizontal orientation (dorsal and palmar hoof markers). Five jumping trials of right lead landing were recorded before the contact mat was placed under the surface, to measure hoof slip for another study. The contact mat was then placed according to the right lead hoof print of the horse at a depth of 2 cm. When the right forelimb made contact with the mat, it switched the torch ‘on’ and the light was recorded together with the kinematics. One successful jumping trial was recorded where the right forelimb landed on the embedded contact mat. The jump landings were recorded at 500 Hz and later digitized in Hu-m-an (HMA Technology Inc., King City, ON, Canada) from the latter part of the flight phase to mid-stance phase. Vertical and horizontal displacement of PI and the two hoof markers was calculated and smoothed with a second-order Butterworth filter with a 25 Hz cut-off frequency. Vertical displacement, velocity and acceleration and horizontal velocity were then derived, and the frame when the light switched ‘on’ was also recorded. These data were then exported to Excel (Microsoft Corp.).
Data analysis
To evaluate foot strike events, timing of the contact mat light ‘on’ was compared with the timing of the first vertical velocity minimum and vertical acceleration maximum found at the end of the flight phase of the leading limb, the highest maximum of speed distribution using both vertical and horizontal velocity frequenciesReference Peham, Scheidl and Licka13, the first point where the horizontal velocity crossed 0 at the end of the flight phase and the point where the rate of vertical displacement began to reduce. Mean and standard deviation of these data was plotted and compared in Excel (Microsoft Corp.).
Results
Loading rate study
Table 1 shows the mean, SD, variance and confidence intervals for delay, forces and instantaneous loading rate for each trial for the two activities. No significant differences (F(15) = 0.29, P = 0.866) in delay between the force platform and the contact mat for running and stepping down were found. This was despite significant differences between activity for vertical force (F(15) = 19.93, P = 0.001) and instantaneous loading rate (F(15) = 27.302, P < 0.001) being measured by the force platform. No significant relationships were found for this study.
Mean, standard deviation (SD), confidence intervals and variance of the delay between the force platform onset and the contact mat switching ‘on’ (ms)

Mean and SD of load in the vertical (V) and anterior–posterior (A–P) directions (N) at the frame where the mat switched ‘on’ and mean instantaneous loading rate (LR) (kN s− 1) for the loading rate test results. n, total number of observations. * Significant difference (P < 0.05) between run and step-down activities.
Surface depth study
Table 2 shows the mean, SD, variance and confidence intervals for delay, forces and instantaneous loading rate for each trial for the two depths. No significant differences (F(25) = 1.922, P = 0.178) in delay between the force platform and the contact mat for the 1 and 2 cm depths were found. In addition, no significant differences (P < 0.05) between depths were found for vertical force, anterior–posterior force or instantaneous loading rate (see Table 2). Significant relationships were found for delay and vertical force (r = 0.505, P = 0.010 and r = .439, P = .028) for the 2 and 1 cm depths, respectively, for delay and anterior–posterior force for the 1 cm depth (r = 0.635, P = 0.001) and for delay and instantaneous loading rate for the 2 cm depth (r = 0.424, P = 0.034).
Mean, standard deviation (SD), confidence intervals and variance of the delay between the force platform onset and the contact mat switching ‘on’ (ms)

Mean and SD of load in the vertical (V) and anterior–posterior (A–P) directions (N) at the frame where the mat switched ‘on’ and instantaneous loading rate (LR) (kN s− 1) for the surface depth test results. n, total number of observations.
Field-based study
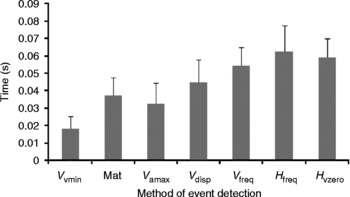
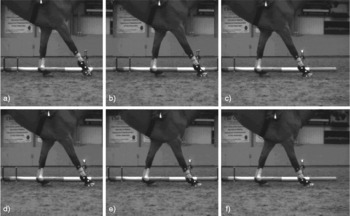
Two trials were not recorded: one horse pulled off a shoe and one horse was considered fatigued prior to data collection from the mat. Plots of vertical displacement, velocity and acceleration and horizontal velocity of the palmar hoof marker, together with their corresponding events, are shown in Fig. 1, together with the position of foot strike determined using the contact mat. The mean difference in time to foot strike determined by the mat and time to events detected using the kinematic data for all the successful trials are shown in Fig. 2. Corresponding frames from the video data are shown in Fig. 3.
Plots of vertical displacement (mm), velocity (cm s− 1) and acceleration (m s− 2) and horizontal velocity (cm s− 1) of the palmar hoof marker, together with their corresponding events (vertical lines) and the position of foot strike, determined using the contact mat for one jumping trial (dashed vertical line)

The mean difference in time (s) to foot strike determined by the mat and time (s) to events detected using the kinematic data for all the successful trials. Abbreviations: V vmin, vertical velocity minima; Mat, contact mat ‘on’; V amax, vertical acceleration maxima; V disp, vertical displacement; V freq, highest maximum vertical speed distribution; H freq, highest maximum horizontal speed distribution; H vzero, point where the horizontal velocity first crosses 0

Corresponding frames for one jumping trial to the events depicted in Fig. 2; (a) vertical velocity minima, (b) vertical acceleration maxima, (c) contact mat ‘on’, (d) change in vertical displacement rate, (e) highest maximum vertical speed distribution and highest maximum horizontal speed distribution and (f) point where the horizontal velocity first crosses 0

Discussion
A bespoke contact mat was designed to determine foot strike, validated using a force platform and tested during jump landing. For both loading rate and surface depth studies, the mean delay between a force platform onset of 20 N and the contact mat was consistent, despite differences in load, loading rate and depth. The mat was then tested in the field during jump landing, and was found to consistently record foot strike after the vertical velocity minima and acceleration maxima, but before the vertical displacement event. All these events were found earlier in the landing phase than the horizontal velocity and speed distribution events.
The laboratory-based studies were designed to test the consistency of the mat under different loading and surface conditions, as variability in the surface depth and foot strike kinetics were expected to vary between horses, surfaces and trials in the field-based studies. Instantaneous load and loading rate were recorded to assess the variability in load and loading rate at the point at which the contact mat switched ‘on’. Peak vertical loads and loading rates were found in the region of 5 and 500 kN s− 1 for the step-down activity. Vertical ground reaction force magnitudes have been reported in the leading limb to range from approximately 1.5 to 9.0 kNReference Meershoek, Roepstorff, Schamhardt, Johnston and Bobbert20, which are of a similar order of magnitude. However, comparison of instantaneous load and loading rate is not possible as the stance phase onset chosen for this study was 1000 N. Detailed force–time curves at the initial foot contact have been published at trotReference Gustas, Johnston and Drevemo6, Reference Gustas, Johnston, Roepstorff, Drevemo and Lanshammar21, which show a low loading rate initially that increases in the first 10 ms following foot contact to approximately 1000 N, producing an approximate loading rate of 100 kN s− 1. This value is also comparable to the loading rates found in our study, so it was considered that the laboratory-based studies were a sufficiently robust validation for the mat.
The depth below the arena surface chosen to test the mat was determined by the composition of the arenas. The top layer of the two surfaces was composed of a mixture of silica sand, synthetic fibres, rubber chips and wax. Below this, at a depth of 2 cm was a harder substrate surface made up of silica sand, polypropylene and rubber fibres. For the field test, the mat was laid on the substrate, and then the top 2 cm of the surface were replaced and levelled. However, it was felt that some of the material may be displaced during contact with the surface, so a comparison between depths was considered important. The delay from the contact mat was found to occur slightly earlier for the 1 cm depth compared with the force platform onset, which resulted in a lower vertical force magnitude but with a similar loading rate. Although no significant differences were found, the reduction in delay suggests that less time was required for the 1 cm depth of the surface above the mat to deform, resulting in an earlier contact of the electrodes, as there was less material to deform. For this study, relationships were found between delay and all loading variables, which may relate to the increased number of observations for each variable used in the analysis. In addition, a higher force and loading rate were expected from a longer delay.
Comparison of kinematic data with the contact mat during jump landing suggests that the foot strike determined from the mat occurs close to the vertical acceleration maxima. If the delay between the mat and the force platform onset is taken into account, then the event would occur between the vertical velocity minima and acceleration maxima. For kinematic studies where the onset of the stance phase is defined from a higher force value, speed distribution analysis and horizontal velocity may better define these events. However, for kinematic studies requiring data from the initial contact, the mat or kinematic data from the vertically derived curves may be more appropriate.
Studies of equine locomotion often present real challenges when attempting to replicate true field-based conditions. The contact mat helped to determine foot strike without altering the properties of the substrate during jump landing, but it created a new substrate layer which undoubtedly influenced the overall surface properties. The surface composition helped to hold the 2 cm top surface in place over the mat, but the coefficient of friction between the mat and the top surface and between the mat and the substrate was inevitably reduced. Surfaces with a lower coefficient of friction are known to allow the hoof to slide further, which increases hoof deceleration time and distanceReference McClinchey, Thomason and Runciman22. In this case, the lower coefficient of friction between the top surface and the mat could have caused a shearing effect between these layers. For horses that land with a higher horizontal braking force, which have been identified as poorer jumpersReference Powers and Harrison23, this is more likely to be evident. A rougher covering attached to the outer surface of the mat to match the coefficient of friction between the substrate and top surface may improve the mat design for this type of application.
Several mats of identical design were constructed and tested prior to carrying out the studies, to ensure that repeatable results were produced. Performance was only found to deteriorate during a study if the electrode surfaces became badly deformed. This occurred during the loading rate test (stepping down) with a participant of larger mass that landed with high braking forces on the toes, which produced higher pressure spots and greater shearing forces. This also occurred during jump landing when contact was made at the edge of the mat. In both cases the mat was replaced, but would have continued to function successfully if only elastic deformation had occurred. Reliability deteriorated under three conditions: following plastic deformation of the foam (as elastic recoil no longer occurred), when landing on the edge of the mat or when internal tearing of the foil making up the electrodes occurred.
Conclusion
A bespoke contact mat designed using cost-effective methods and materials was successfully used to estimate foot strike during jump landing on an arena surface. Further work is needed to enhance the design, but initial results indicate that the contact mat may provide an effective method of determining foot strike for a number of field-based applications.