1 Introduction
The computation of non-colloidal suspension rheology, even when the matrix fluid is Newtonian, is still work in progress – see the recent review by Denn, Morris & Bonn (Reference Denn, Morris and Bonn2018). In the present paper we seek to contribute to the more difficult case where the matrix is viscoelastic.
For the case of Newtonian matrices, pioneering results were found by Sierou & Brady (Reference Sierou and Brady2002) using the Stokesian dynamics method, which is difficult to implement for viscoelastic matrices. Following this work, various authors have made useful contributions using different computational techniques; we mention the work of Bertevas, Fan & Tanner (Reference Bertevas, Fan and Tanner2010), Gallier et al. (Reference Gallier, Lemaire, Peters and Laurent2014), Mari et al. (Reference Mari, Seto, Morris and Denn2014), Vázquez-Quesada, Tanner & Ellero (Reference Vázquez-Quesada, Tanner and Ellero2016b ) and Cheal & Ness (Reference Cheal and Ness2018). In some cases, bimodal sphere distributions were used (Mari et al. Reference Mari, Seto, Morris and Denn2014; Cheal & Ness Reference Cheal and Ness2018), which needs to be taken into account when comparing with experiments using monosized spheres. In all cases repulsive forces were used to prevent particle overlap. In simple shear flow, these extensive computations show that for large volume fractions interparticle friction becomes important and results depend on the details of how the friction is modelled. The work of Gallier et al. (Reference Gallier, Lemaire, Peters and Laurent2014) shows that the suspension viscosity at volume fractions less than 0.3 is independent of interparticle friction, and in the present work we will concentrate on these dilute/semi-concentrated cases in detail. Even for the Newtonian matrices without friction, at a volume fraction of 0.3 there are differences of 5 % in the estimates of viscosity from the works cited above. One needs to bear this in mind when comparing computations and experiments.
For the case of viscoelastic suspensions, much less computational work is available. The two-dimensional (2-D) simulations of Hwang, Hulsen & Meijer (Reference Hwang, Hulsen and Meijer2004b ) using an Oldroyd-B model matrix have been instructive, but for three-dimensional (3-D) spheres there is the work of Hwang et al. (Reference Hwang, Hulsen, Meijer, Kwon, Lee and Lee2004a ), D’Avino et al. (Reference D’Avino, Greco, Hulsen and Maffettone2013), Yang, Krishnan & Shaqfeh (Reference Yang, Krishnan and Shaqfeh2016) and Yang & Shaqfeh (Reference Yang and Shaqfeh2018b ) and little else. On the other hand, there are a considerable number of experiments using viscoelastic matrices; we mention Zarraga, Hill & Leighton (Reference Zarraga, Hill and Leighton2001), Scirocco, Vermant & Mewis (Reference Scirocco, Vermant and Mewis2005), Pasquino et al. (Reference Pasquino, Grizzuti, Maffettone and Greco2008) and Dai, Qi & Tanner (Reference Dai, Qi and Tanner2014).
By concentrating on lower volume fractions, we minimize the effects of friction; here we wish to demonstrate clearly the effect of viscoelasticity on the viscosity of suspensions without the complication of interparticle friction. The computational technique used here is smoothed particle hydrodynamics (SPH); this method to study suspensions has already been used successfully by the authors elsewhere (Vázquez-Quesada & Ellero Reference Vázquez-Quesada and Ellero2016; Vázquez-Quesada et al. Reference Vázquez-Quesada, Tanner and Ellero2016b , Reference Vázquez-Quesada, Mahmud, Dai, Ellero and Tanner2017; Vázquez-Quesada & Ellero Reference Vázquez-Quesada and Ellero2017) and will be shown to be accurate. For the matrix, we have chosen a discrete viscoelastic model derived in the context of generic (Grmela & Öttinger Reference Grmela and Öttinger1997). In the specific case of Hookean dumbbells, the model can be interpreted as a specific discrete SPH version of the Oldroyd-B equation with a single relaxation time, which satisfies thermodynamic consistency (Vázquez-Quesada, Ellero & Español Reference Vázquez-Quesada, Ellero and Español2009). The model shows a constant shear viscosity and extensional thickening.
The work will demonstrate improved agreement between computation and experiment for volume fractions
 ${\leqslant}0.3$
. In particular, multibody simulations are essential – it is not sufficient, at any volume fraction greater than 0.02, to use single-sphere computations. From a microstructural point of view, it will also show that elastic thickening is associated with regions of large polymer stresses, but only those occurring in combination with extensional flow components. The present results show that, thanks to the flow complexity (i.e. local extensional components) induced by the presence of the solid particles, the global rheology of the viscoelastic suspension under simple shear can differ qualitatively from the rheology of the underlying liquid matrix.
The structure of the paper is the following one. In § 2 the full viscoelastic models for the liquid and solid phases are presented. Then § 3 presents the numerical results of the suspension rheology under dilute up to semi-concentrated conditions and comparison with experimental data is performed. Moreover, a detailed microstructural analysis is presented. Finally, in § 4 the conclusions are reported.
2 Suspension model
2.1 SPH viscoelastic matrix fluid modelling
A coarse-grained fluid-particle model for a polymer fluid originally proposed by Vázquez-Quesada et al. (Reference Vázquez-Quesada, Ellero and Español2009) and Vázquez-Quesada, Ellero & Español (Reference Vázquez-Quesada, Ellero and Español2012) and recently validated in the case of suspended spheres (Vázquez-Quesada & Ellero Reference Vázquez-Quesada and Ellero2017) is considered. Every fluid particle represents a moving thermodynamic subsystem containing a given number of polymer molecules. The elastic state of the fluid particle is characterized by a configuration tensor
 $\boldsymbol{c}$
that describes their underlying molecular elongation and orientation. The specification of very simple physical mechanisms inspired by the dynamics of single polymer molecules allows one, with the help of the generic formalism (General Equation for Non-Equilibrium Reversible–Irreversible Coupling) (Grmela & Öttinger Reference Grmela and Öttinger1997), to derive the equations of motion for the positions, velocities and conformation tensor associated with a set of fluid particles carrying polymer molecules in suspension which satisfy strictly thermodynamic consistency. For the sake of completeness, in this section we provide a brief overview of the main discrete evolution equations (focusing on the deterministic limit) and discuss their interpretation in the context of constitutive viscoelastic models.
If we consider a set of fluid particles labelled by indices
 $i,j=1,\ldots ,N$
, in the most general case, the generic-derived ordinary differential equations for the positions, velocities and conformation tensor associated with each fluid particle read
 $$\begin{eqnarray}\displaystyle \left.\begin{array}{@{}c@{}}\displaystyle \dot{\boldsymbol{r}}_{i}=\boldsymbol{v}_{i},\\ m\dot{\boldsymbol{v}}_{i}=-\mathop{\sum }_{j}\left[{\displaystyle \frac{\unicode[STIX]{x1D745}_{i}}{d_{i}^{2}}}+{\displaystyle \frac{\unicode[STIX]{x1D745}_{j}}{d_{j}^{2}}}\right]\,W_{ij}^{\prime }\boldsymbol{e}_{ij}+2(D+2)\unicode[STIX]{x1D702}_{s}\mathop{\sum }_{j}{\displaystyle \frac{\boldsymbol{e}_{ij}\boldsymbol{\cdot }\boldsymbol{v}_{ij}}{r_{ij}}}\,{\displaystyle \frac{W_{ij}^{\prime }}{d_{i}d_{j}}}\boldsymbol{e}_{ij},\\ \displaystyle \dot{\boldsymbol{c}}_{i}=\left(-\mathop{\sum }_{j}{\displaystyle \frac{1}{d_{j}}}\boldsymbol{v}_{ij}\,\boldsymbol{e}_{ij}W_{ij}^{\prime }\right)\boldsymbol{\cdot }\boldsymbol{c}_{i}+\boldsymbol{c}_{i}\boldsymbol{\cdot }\left(-\mathop{\sum }_{j}{\displaystyle \frac{1}{d_{j}}}\boldsymbol{v}_{ij}\,\boldsymbol{e}_{ij}W_{ij}^{\prime }\right)^{\text{T}}+{\displaystyle \frac{2}{\unicode[STIX]{x1D706}}}d_{i}\,\unicode[STIX]{x1D748}_{i}\boldsymbol{\cdot }\boldsymbol{c}_{i},\end{array}\right\} & & \displaystyle\end{eqnarray}$$
where
 $m$
is the mass of each particle;
 $D$
is the number of dimensions of the system;
 $\boldsymbol{v}_{ij}=\boldsymbol{v}_{i}-\boldsymbol{v}_{j}$
are the relative particle velocities;
 $W_{ij}=W(r_{ij}=|\boldsymbol{r}_{i}-\boldsymbol{r}_{j}|,r_{cut})$
is a normalized smoothing kernel function;
 $W_{ij}^{\prime }=\unicode[STIX]{x2202}W(r,r_{cut})/\unicode[STIX]{x2202}r|_{r=r_{ij}}$
is its derivative;
 $\boldsymbol{e}_{ij}=\boldsymbol{r}_{ij}/r_{ij}$
is the unit vector joining particle
 $i$
and
 $j$
; the number density on particle
 $i$
is evaluated as a standard summation
 $d_{i}=\sum _{j}W_{ij}$
;
 $\unicode[STIX]{x1D702}_{s}$
is the Newtonian matrix viscosity; and
 $\unicode[STIX]{x1D706}$
is the polymer relaxation time. In the most general case, the total stress tensor reads
 $\unicode[STIX]{x1D745}_{i}=P_{i}\boldsymbol{I}+2d_{i}\,\unicode[STIX]{x1D748}_{i}\boldsymbol{\cdot }\boldsymbol{c}_{i}$
, where
 $P_{i}$
is the isotropic particle pressure (computed by using an equation of state
 $P_{i}=c_{s}^{2}(\unicode[STIX]{x1D70C}_{i}-\unicode[STIX]{x1D70C}_{0})$
with
 $c_{s}$
being the speed of sound,
 $\unicode[STIX]{x1D70C}_{i}=md_{i}$
and
 $\unicode[STIX]{x1D70C}_{0}$
the local and a reference mass density). This set of Newton’s equations for the particles can be interpreted as a specific SPH (Monaghan Reference Monaghan2005; Ellero, Serrano & Español Reference Ellero, Serrano and Español2007) Lagrangian representation of the general momentum conservation with an additional evolution equation for the conformation tensor. In the most general case, the polymeric stress reads
 $$\begin{eqnarray}\unicode[STIX]{x1D749}_{i}=-2d_{i}\,\unicode[STIX]{x1D748}_{i}\boldsymbol{\cdot }\boldsymbol{c}_{i},\end{eqnarray}$$
with
 $\unicode[STIX]{x1D748}_{i}=T(\unicode[STIX]{x2202}S_{p}(\boldsymbol{c})/\unicode[STIX]{x2202}\boldsymbol{c})_{i}$
being a tensorial variable thermodynamically conjugated to
 $\boldsymbol{c}_{i}$
, where
 $T$
is a constant temperature and
 $S_{p}(\boldsymbol{c})$
is the conformational-dependent entropy function (Vázquez-Quesada et al.
Reference Vázquez-Quesada, Ellero and Español2009). The previous expressions are of general validity, as no assumption is made on the specific force law of the polymer. Owing to the generic structure of the above equations, thermodynamic consistency is satisfied at the discrete level. Polymer physics comes into play in this model with a proper definition of
 $S_{p}(\boldsymbol{c})$
. In the specific case of a dilute suspension of non-interacting Hookean dumbbells, the entropy reads (Ottinger Reference Ottinger2005)
 $$\begin{eqnarray}\displaystyle S_{p}(\boldsymbol{c})=k_{B}{\displaystyle \frac{N_{p}}{2}}(\text{Tr}[\mathbf{1}-\boldsymbol{c}]+\ln \det \boldsymbol{c}), & & \displaystyle\end{eqnarray}$$
where
 $k_{B}$
is the Boltzmann constant and
 $N_{p}$
is the total number of dumbbells contained in each fluid particle. In Vázquez-Quesada et al. (Reference Vázquez-Quesada, Ellero and Español2009) we have shown that the specific choice (2.3) leads to
 $\unicode[STIX]{x1D748}_{i}=(\boldsymbol{c}_{i}^{-1}-\mathbf{1})$
and a resulting expression for the total stress is
 $$\begin{eqnarray}\unicode[STIX]{x1D745}_{i}=P_{i}+{\displaystyle \frac{\unicode[STIX]{x1D702}_{p}}{\unicode[STIX]{x1D706}}}(\boldsymbol{c}_{i}-\mathbf{1}),\end{eqnarray}$$
where the polymeric viscosity is defined as
 $\unicode[STIX]{x1D702}_{p}=N_{p}d_{i}k_{B}T\unicode[STIX]{x1D706}$
. Finally, the last term on the right-hand side of the evolution equations (2.1) for
 $\boldsymbol{c}_{i}$
reduces to
 $$\begin{eqnarray}{\displaystyle \frac{2}{\unicode[STIX]{x1D706}}}d_{i}\,\unicode[STIX]{x1D748}_{i}\boldsymbol{\cdot }\boldsymbol{c}_{i}={\displaystyle \frac{1}{\unicode[STIX]{x1D706}}}(\mathbf{1}-\boldsymbol{c}_{i}).\end{eqnarray}$$
The resulting equations correspond to a very specific SPH discretization of the classical Oldroyd-B constitutive model with a single relaxation time
 $\unicode[STIX]{x1D706}$
, which is the one used in this work. Owing to the generic structure (Vázquez-Quesada et al.
Reference Vázquez-Quesada, Ellero and Español2009), this particular set of equations for the particles conserves exactly local and total linear/angular momentum and it is consistent – in its discrete form – with the first and second laws of thermodynamics.
One possible problem of this specific formulation is related to the loss of the positive character of the conformation tensor due to purely numerical errors, which is a general issue in computational rheology (Owens & Phillips Reference Owens and Phillips2002). To remedy it, several stabilization strategies have been considered in the literature, with the log-conformation formulation proposed by Fattal & Kupferman (Reference Fattal and Kupferman2004) representing the most popular choice. In this approach a constitutive viscoelastic equation is reformulated in terms of the matrix logarithm of the conformation tensor, which replaces possible dangerous exponential variations of the stress with more accurate polynomial interpolation, therefore preserving its positive definiteness. As discussed in detail in Vázquez-Quesada et al. (Reference Vázquez-Quesada, Ellero and Español2009), another possibility is to evolve directly its eigenvalues
 $\unicode[STIX]{x1D706}_{\unicode[STIX]{x1D6FC}}$
(not to be confused with the elastic relaxation time
 $\unicode[STIX]{x1D706}$
) and eigenvectors
 $\boldsymbol{u}_{\unicode[STIX]{x1D6FC}}$
(
 $\unicode[STIX]{x1D6FC}=1,2,3$
) (sub-indices referring to fluid particles are suppressed to simplify the notation) rather than the tensor components themselves. The evolution of the eigenvalues and eigenvectors can be obtained from the dynamic equation (2.1) by taking the time derivative of the eigenrepresentation of the conformation tensor and left and right multiplying this time derivative with the eigenvectors (see Vázquez-Quesada et al. (Reference Vázquez-Quesada, Ellero and Español2009) for the details). Finally, we obtain
 $$\begin{eqnarray}\displaystyle \left.\begin{array}{@{}c@{}}\displaystyle \dot{\unicode[STIX]{x1D706}}_{\unicode[STIX]{x1D6FC}}=2\unicode[STIX]{x1D706}_{\unicode[STIX]{x1D6FC}}\unicode[STIX]{x1D705}_{\unicode[STIX]{x1D6FC}\unicode[STIX]{x1D6FC}}+{\displaystyle \frac{2}{\unicode[STIX]{x1D706}}}[1-\unicode[STIX]{x1D706}_{\unicode[STIX]{x1D6FC}}]+{\displaystyle \frac{2}{\unicode[STIX]{x1D706}N^{p}}},\\ \displaystyle \dot{\boldsymbol{u}}_{\unicode[STIX]{x1D6FC}}=\mathop{\sum }_{\unicode[STIX]{x1D6FD}\neq \unicode[STIX]{x1D6FC}}H_{\unicode[STIX]{x1D6FC}\unicode[STIX]{x1D6FD}}\boldsymbol{u}_{\unicode[STIX]{x1D6FD}},\end{array}\right\} & & \displaystyle\end{eqnarray}$$
where
 $$\begin{eqnarray}\displaystyle & \displaystyle \unicode[STIX]{x1D705}_{\unicode[STIX]{x1D6FC}\unicode[STIX]{x1D6FD}}=\boldsymbol{u}_{\unicode[STIX]{x1D6FC}}\boldsymbol{\cdot }(\unicode[STIX]{x1D6FB}\boldsymbol{v})^{\text{T}}\boldsymbol{\cdot }\boldsymbol{u}_{\unicode[STIX]{x1D6FD}}, & \displaystyle\end{eqnarray}$$
 $$\begin{eqnarray}\displaystyle & \displaystyle H_{\unicode[STIX]{x1D6FC}\unicode[STIX]{x1D6FD}}=\left\{\begin{array}{@{}ccc@{}}{\displaystyle \frac{1}{(\unicode[STIX]{x1D706}_{\unicode[STIX]{x1D6FC}}-\unicode[STIX]{x1D706}_{\unicode[STIX]{x1D6FD}})}}[\unicode[STIX]{x1D706}_{\unicode[STIX]{x1D6FC}}\unicode[STIX]{x1D705}_{\unicode[STIX]{x1D6FD}\unicode[STIX]{x1D6FC}}+\unicode[STIX]{x1D706}_{\unicode[STIX]{x1D6FD}}\unicode[STIX]{x1D705}_{\unicode[STIX]{x1D6FC}\unicode[STIX]{x1D6FD}}] & & \text{if}~\unicode[STIX]{x1D706}_{\unicode[STIX]{x1D6FC}}\neq \unicode[STIX]{x1D706}_{\unicode[STIX]{x1D6FD}},\\ 0 & & \text{if}~\unicode[STIX]{x1D706}_{\unicode[STIX]{x1D6FC}}=\unicode[STIX]{x1D706}_{\unicode[STIX]{x1D6FD}}.\end{array}\right. & \displaystyle\end{eqnarray}$$
Once eigenvalues/vectors are evolved, the conformation tensor is directly re-obtained via the dyadic product
 $\boldsymbol{c}=\sum _{\unicode[STIX]{x1D6FC}}\unicode[STIX]{x1D706}_{\unicode[STIX]{x1D6FC}}\boldsymbol{u}_{\unicode[STIX]{x1D6FC}}\boldsymbol{u}_{\unicode[STIX]{x1D6FC}}$
, which is positive definite, provided that the time integration scheme for (2.6) enforces the eigenvalues to be numerically positive and the eigenvectors orthonormal. In the current work we have not observed any loss of positive definiteness in the range of flow conditions explored. It is also possible to reconstruct the eigenvector dynamics from a Cayley transformation (see appendix C in Vázquez-Quesada et al. (Reference Vázquez-Quesada, Ellero and Español2009)) to ensure exact orthogonality and a formally well-defined symmetric and positive definite conformation tensor through
 $\boldsymbol{c}=\sum _{\unicode[STIX]{x1D6FC}}\unicode[STIX]{x1D706}_{\unicode[STIX]{x1D6FC}}\boldsymbol{u}_{\unicode[STIX]{x1D6FC}}\boldsymbol{u}_{\unicode[STIX]{x1D6FC}}$
. A related approach was also used by Vaithianathan & Collins (Reference Vaithianathan and Collins2003).
This eigenrepresentation formulation is also useful to incorporate more easily thermal fluctuations on the conformation tensor in a thermodynamically consistent way (i.e. such that they satisfy exactly the fluctuation–dissipation theorem), therefore generalizing the deterministic SPH equations (2.1) to a stochastic viscoelastic particle model that operates under Brownian conditions (smoothed dissipative particle dynamics (Vázquez-Quesada et al. Reference Vázquez-Quesada, Ellero and Español2009)), i.e. for colloidal suspended particles (Vázquez-Quesada et al. Reference Vázquez-Quesada, Ellero and Español2012). Rheology of a colloidal viscoelastic suspension will be the focus of a separate work. In the present work, we restrict ourselves to the deterministic case of a non-colloidal particle system.
Temporal integration of the SPH equations for the matrix fluid is performed with a second-order predictor–corrector scheme (Ellero & Adams Reference Ellero and Adams2011). For the weighting function
 $W$
, the present work adopts a quintic spline kernel (Morris, Fox & Zhu Reference Morris, Fox and Zhu1997) with cutoff radius
 $r_{cut}=4\,\text{d}x$
(
 $\text{d}x$
being the mean fluid-particle separation) (Ellero & Adams Reference Ellero and Adams2011).
It should be borne in mind that in the derivation of the above-mentioned discrete viscoelastic equations, no reference to a target partial differential equation is considered. The fact that an SPH discretization of an Oldroyd-B equation was finally recovered represents an a posteriori proof of the consistency of the coarse-graining approach, as it is the expected result for Hookean dumbbells in suspension. Generalization to more complex polymeric models, such as finitely extensible nonlinear elastic springs, is straightforward. In particular, coarse-grained thermodynamic consistent models can be constructed by physical specification of conformation-tensor-dependent entropy of the fluid particles appearing in (2.3), rather than by brute-force discretization of existing continuum constitutive equations. For a more detailed discussion on the formal aspects of the SPH viscoelastic matrix model, its generalization to Brownian conditions and its link to generic, the reader is referred to Vázquez-Quesada et al. (Reference Vázquez-Quesada, Ellero and Español2009).
2.2 Solid particles: fluid–structure and short-range interparticle interaction
Fluid–structure interaction with suspended inclusions of arbitrary shapes can be modelled using boundary particles located inside a solid region (Bian et al.
Reference Bian, Litvinov, Qian, Marco and Nikolaus2012). The no-slip boundary condition at the liquid–solid interface is enforced during each interaction between fluid particle and boundary particle by assigning an artificial velocity to the boundary particle, which satisfies zero interpolation at the interface (Morris et al.
Reference Morris, Fox and Zhu1997). Finally, once all fluid–boundary forces are defined, a total force
 $\boldsymbol{F}_{\unicode[STIX]{x1D6FC}}^{sph}$
and torque
 $\boldsymbol{T}_{\unicode[STIX]{x1D6FC}}^{sph}$
exerted by the surrounding fluid on a given solid sphere labelled
 $\unicode[STIX]{x1D6FC}=1,\ldots ,N_{c}$
can be calculated and the corresponding coordinates updated as a rigid-body translation/rotation (Vázquez-Quesada & Ellero Reference Vázquez-Quesada and Ellero2016, Reference Vázquez-Quesada and Ellero2017).
Long-range viscoelastic interactions between suspended solid particles are mediated by the matrix fluid and are accurately described. As discussed in Bian & Ellero (Reference Bian and Ellero2014) and Vázquez-Quesada & Ellero (Reference Vázquez-Quesada and Ellero2016), in order to reproduce accurately the short-range hydrodynamic behaviour and solid particle impenetrability, we add viscous lubrication as well as short-range interparticle repulsion. Normal and tangential lubrication forces acting between close spheres read
 $$\begin{eqnarray}\displaystyle \left.\begin{array}{@{}c@{}}\displaystyle \boldsymbol{F}_{\unicode[STIX]{x1D6FC}\unicode[STIX]{x1D6FD}}^{lub,n}(s\leqslant s_{c}^{n})=f_{\unicode[STIX]{x1D6FC}\unicode[STIX]{x1D6FD}}(s)\boldsymbol{V}_{\unicode[STIX]{x1D6FC}\unicode[STIX]{x1D6FD}}\boldsymbol{\cdot }\boldsymbol{e}_{\unicode[STIX]{x1D6FC}\unicode[STIX]{x1D6FD}}\boldsymbol{e}_{\unicode[STIX]{x1D6FC}\unicode[STIX]{x1D6FD}},\\ \displaystyle \boldsymbol{F}_{\unicode[STIX]{x1D6FC}\unicode[STIX]{x1D6FD}}^{lub,t}(s\leqslant s_{c}^{t})=g_{\unicode[STIX]{x1D6FC}\unicode[STIX]{x1D6FD}}(s)\boldsymbol{V}_{\unicode[STIX]{x1D6FC}\unicode[STIX]{x1D6FD}}\boldsymbol{\cdot }(\mathbf{1}-\boldsymbol{e}_{\unicode[STIX]{x1D6FC}\unicode[STIX]{x1D6FD}}\boldsymbol{e}_{\unicode[STIX]{x1D6FC}\unicode[STIX]{x1D6FD}}),\end{array}\right\} & & \displaystyle\end{eqnarray}$$
where
 $\boldsymbol{e}_{\unicode[STIX]{x1D6FC}\unicode[STIX]{x1D6FD}}=\boldsymbol{R}_{\unicode[STIX]{x1D6FC}\unicode[STIX]{x1D6FD}}/R_{\unicode[STIX]{x1D6FC}\unicode[STIX]{x1D6FD}}$
is the vector joining the centres of mass of solid particles
 $\unicode[STIX]{x1D6FC}$
and
 $\unicode[STIX]{x1D6FD}$
,
 $\boldsymbol{V}_{\unicode[STIX]{x1D6FC}\unicode[STIX]{x1D6FD}}$
is their relative velocity,
 $s=R_{\unicode[STIX]{x1D6FC}\unicode[STIX]{x1D6FD}}-(a_{\unicode[STIX]{x1D6FC}}+a_{\unicode[STIX]{x1D6FD}})$
is the distance in the gap between sphere–sphere surfaces, and
 $a_{\unicode[STIX]{x1D6FC}}$
and
 $a_{\unicode[STIX]{x1D6FD}}$
are the sphere’s radii. Expressions for the scalar functions
 $f_{\unicode[STIX]{x1D6FC}\unicode[STIX]{x1D6FD}}(s)$
and
 $g_{\unicode[STIX]{x1D6FC}\unicode[STIX]{x1D6FD}}(s)$
are given by Vázquez-Quesada & Ellero (Reference Vázquez-Quesada and Ellero2016) and an accurate and stable semi-implicit splitting scheme (Bian & Ellero Reference Bian and Ellero2014) is adopted for their time integration.
Finally, an additional repulsive force acting between solid particles is introduced to prevent artificial particle overlap (Bian & Ellero Reference Bian and Ellero2014; Vázquez-Quesada & Ellero Reference Vázquez-Quesada and Ellero2016),
 $\boldsymbol{F}_{\unicode[STIX]{x1D6FC}\unicode[STIX]{x1D6FD}}^{rep}=F^{rep}\unicode[STIX]{x1D70F}\text{e}^{-\unicode[STIX]{x1D70F}s}/(1-\text{e}^{-\unicode[STIX]{x1D70F}s})\boldsymbol{e}_{\unicode[STIX]{x1D6FC}\unicode[STIX]{x1D6FD}}$
, where
 $\unicode[STIX]{x1D70F}^{-1}$
determines the interaction range and
 $F^{rep}$
its magnitude. In order to model nearly hard spheres, typically values of
 $\unicode[STIX]{x1D70F}^{-1}=0.001a$
and
 $F^{rep}=2.115$
are adopted (Vázquez-Quesada & Ellero Reference Vázquez-Quesada and Ellero2016). The model for solid non-colloidal (i.e. non-Brownian) particles in a viscoelastic matrix has been validated in Vázquez-Quesada & Ellero (Reference Vázquez-Quesada and Ellero2017) where the dynamics of single and mutually interacting rigid spheres under shear flow and in the presence of confinement has been simulated. Brownian conditions (i.e. colloidal suspended particle) have also been studied in Vázquez-Quesada et al. (Reference Vázquez-Quesada, Ellero and Español2012).
All interparticle interactions are implemented within the so-called parallel particle mesh library (PPM) Sbalzarini et al. (Reference Sbalzarini, Walther, Bergdorf, Hieber, Kotsalis and Koumoutsakos2006), a Fortran 90 software layer between the message passing interface (MPI) and client applications for simulations of physical systems using particle-mesh methods with optimal scaling performance.
3 Numerical results
3.1 Simulation set-up
In this section we consider a suspension of non-Brownian solid spheres of radius
 $a$
confined between two parallel walls and study its viscometric behaviour as a function of the bulk Deborah number
 $\mathit{De}=\unicode[STIX]{x1D706}\dot{\unicode[STIX]{x1D6FE}}$
, where
 $\unicode[STIX]{x1D706}$
is the elastic polymer relaxation time and
 $\dot{\unicode[STIX]{x1D6FE}}$
is the macroscopic shear rate. As in Vázquez-Quesada & Ellero (Reference Vázquez-Quesada and Ellero2016) and Vázquez-Quesada et al. (Reference Vázquez-Quesada, Tanner and Ellero2016b
), a shear rate is applied to the sample by moving upper and lower planar walls separated by a distance
 $L_{z}$
with equal and opposite velocities
 $\pm V_{w}$
. From
 $\dot{\unicode[STIX]{x1D6FE}}$
and from the component
 $\unicode[STIX]{x1D70E}_{xz}$
of the shear stress (obtained from the total force
 $F_{x}$
exerted by the fluid on the walls), the total suspension viscosity is calculated as
 $\unicode[STIX]{x1D702}=\unicode[STIX]{x1D70E}_{xz}/\dot{\unicode[STIX]{x1D6FE}}=F_{x}/(L_{x}L_{y}\dot{\unicode[STIX]{x1D6FE}})$
.
It should be pointed out that in this work the shear rate
 $\dot{\unicode[STIX]{x1D6FE}}=2V_{w}/L_{z}$
is kept constant in such a way that the dimensionless shear rate is uniquely defined in terms of
 $\mathit{De}$
. As a consequence, the particle Reynolds number is fixed to
 $Re_{p}=a^{2}\dot{\unicode[STIX]{x1D6FE}}\unicode[STIX]{x1D70C}_{0}/\unicode[STIX]{x1D702}_{t}=0.00625\ll 1$
to avoid inertial effects. Here
 $\unicode[STIX]{x1D702}_{t}=\unicode[STIX]{x1D702}_{s}+\unicode[STIX]{x1D702}_{p}$
is the total matrix viscosity. Particle concentration is defined as
 $\unicode[STIX]{x1D719}=4\unicode[STIX]{x1D70B}N_{c}a^{3}/3V$
, where
 $V=L_{x}\times L_{y}\times L_{z}$
is the total volume of the simulation box and
 $N_{c}$
is the total number of suspended solid particles.
Results for the relative suspension viscosity
 $\unicode[STIX]{x1D702}_{r}=\unicode[STIX]{x1D702}/\unicode[STIX]{x1D702}_{t}$
and suspension microstructure are shown for different Deborah numbers
 $\mathit{De}$
and solid volume fractions
 $\unicode[STIX]{x1D719}$
and compared with existing simulation and experimental data in the next sections.
3.2 Suspension rheology: dilute case
To the best of our knowledge only a few works presenting simulation data on the rheology of a 3-D dilute suspension of spheres in viscoelastic media are present in the literature. Hwang et al. (Reference Hwang, Hulsen, Meijer, Kwon, Lee and Lee2004a
) studied a single particle in the cell of a Lees–Edwards system for volume fractions
 $\unicode[STIX]{x1D719}$
up to 0.27. They used an Oldroyd-B model where the polymer viscosity was 0.5 of the total viscosity and the value of the Deborah number
 $De$
was 0.5. At
 $\unicode[STIX]{x1D719}=0.27$
the relative viscosity was approximately 1.7 for the Newtonian case and approximately 1.8 for the viscoelastic case. Whilst these results are slightly above the Einstein result for
 $\unicode[STIX]{x1D719}=0.27$
(1.675), they are less than the Batchelor–Green prediction (2.23), and are therefore to be regarded with caution. D’Avino et al. (Reference D’Avino, Greco, Hulsen and Maffettone2013) investigated the rheology of the viscoelastic suspension under small- and large-amplitude oscillatory shear using a fictitious domain method coupled with a finite element approach for the fluid phase. More recently, suspension rheology of a 3-D particulate system under dilute conditions has been simulated by Yang et al. (Reference Yang, Krishnan and Shaqfeh2016) using the immersed-boundary approach to handle fluid–structure interaction coupled with a finite volume scheme. In both cases a Giesekus model for the viscoelastic matrix has been used. In Yang et al. (Reference Yang, Krishnan and Shaqfeh2016), to reproduce dilute conditions, a single spherical particle has been considered located in the middle of the channel between two planar walls generating a shear flow. Results have been presented at solid volume fractions
 $\unicode[STIX]{x1D719}=0.01$
and
 $0.05$
, tested against box size effects and compared directly with the experimental data of Dai et al. (Reference Dai, Qi and Tanner2014). Deviations, however, were reported, i.e. a very mild shear thickening in the total suspension viscosity up to
 $\mathit{De}\sim 1$
, followed by shear thinning at larger
 $De$
. Very recently Yang & Shaqfeh (Reference Yang and Shaqfeh2018a
,Reference Yang and Shaqfeh
b
) have extended their calculations for suspensions using multiple particles (
 $N=10$
at
 $\unicode[STIX]{x1D719}=0.05$
and
 $N=20$
at
 $\unicode[STIX]{x1D719}=0.1$
), leading to similar results.
In the following we compare first our viscoelastic suspension model with that presented in Yang et al. (Reference Yang, Krishnan and Shaqfeh2016) with a single sphere at
 $\unicode[STIX]{x1D719}=0.05$
. In order to compare the numerical rheology with the experimental results, the data of Dai et al. (Reference Dai, Qi and Tanner2014) will also be shown as a reference. In terms of matrix rheology, the Boger liquid studied by Dai was a Newtonian mixture of corn syrup (79.42 %), glycerin (19.8 %) and water (0.75 %), with a small amount of polyacrylamide (0.03 %,
 $M_{v}\approx 10^{7}$
). An ideal Boger fluid separates shear-thinning and viscoelastic effects by having a constant viscosity: in the material used by Dai et al. (Reference Dai, Qi and Tanner2014) the viscosity changed by less than 0.5 % as the shear rate increased from 3 to
 $100~\text{s}^{-1}$
. Hence we believe that our assumption of a constant-viscosity Oldroyd-B model is a good match to the experimental data. Total viscosity was
 $\unicode[STIX]{x1D702}_{t}=2.08~\text{Pa}~\text{s}$
. In Yang et al. (Reference Yang, Krishnan and Shaqfeh2016) a fit of the viscometric functions under shear (
 $\unicode[STIX]{x1D702}_{t}$
and
 $N_{1}$
) of the Boger matrix fluid used by Dai with the proposed Giesekus model was considered. The Giesekus-fluid properties were found to match accurately experimental data with
 $\unicode[STIX]{x1D702}_{p}/\unicode[STIX]{x1D702}_{t}=0.32$
,
 $\unicode[STIX]{x1D6FC}=0.0039$
and
 $\unicode[STIX]{x1D706}=0.09~\text{s}$
, the latter being used to define the experimental Deborah number. In the constant-viscosity Oldroyd-B SPH model considered here, the same value
 $\unicode[STIX]{x1D702}_{p}/\unicode[STIX]{x1D702}_{t}=0.32$
was used, which gives a fit of
 $\unicode[STIX]{x1D706}=0.084~\text{s}$
, very close to that of Yang et al. (Reference Yang, Krishnan and Shaqfeh2016). Regarding the dispersed phase, in the experiments of Dai et al. (Reference Dai, Qi and Tanner2014),
 $42.3~\unicode[STIX]{x03BC}\text{m}$
mean-diameter poly(methyl methacrylate) spheres were used, with standard deviation of the sizes
 $0.63~\unicode[STIX]{x03BC}\text{m}$
and average roughness approximately 190 nm.
In the simulation with a single sphere, the radius of the particle is taken as
 $a=1$
. The length of the simulation box is
 $L_{x}\times L_{y}\times L_{z}=4.8a\times 3.6a\times 4.8a$
, where
 $L_{z}$
is the gap of the channel. When using a ‘single-sphere’ calculation, this simulation box size gives a solid volume fraction
 $\unicode[STIX]{x1D719}=0.05$
. The flow direction is
 $x$
. Fluid density is chosen as
 $\unicode[STIX]{x1D70C}=1$
. The value of
 $\unicode[STIX]{x1D702}_{s}=5.75$
and
 $\unicode[STIX]{x1D702}_{t}=8.46$
. The macroscopic shear rate is taken as
 $\dot{\unicode[STIX]{x1D6FE}}=0.051$
. Finally, the artificial speed of sound is taken as
 $c=42.3$
, which is much larger than the speed of the walls
 $V_{w}=0.122$
to avoid liquid compressibility effects.
(a) Rheology of the viscoelastic suspension with volume fraction
 $\unicode[STIX]{x1D719}=0.05$
:
 $\unicode[STIX]{x2B20}$
, experiment Dai et al. (Reference Dai, Qi and Tanner2014); ○, simulation Yang et al. (Reference Yang, Krishnan and Shaqfeh2016); ●, ▵, present SPH simulation (single-particle);
 $\blacklozenge$
, present SPH simulation (multiple particles). (b,c) Steady-state snapshots of particle configuration at macroscopic Deborah numbers
 $\mathit{De}=0.5$
(b) and
 $\mathit{De}=2.0$
(c). The grey scale represents the magnitude of
 $\text{Tr}(\boldsymbol{c})$
.

Figure 1(a) shows the suspension relative viscosities obtained, compared to experiments. The red line with open circles refers to the single-sphere simulation data of Yang et al. (Reference Yang, Krishnan and Shaqfeh2016) where shear-thinning behaviour is observed at high shear. This is consistent with the fact that the Giesekus matrix does actually show mild shear thinning. A quantitative discrepancy (of the order of 10–15 %) is also observed between simulation and experiment (blue pentagons) at low
 $\mathit{De}$
. Filled circles represent the results of the SPH simulation single-sphere model proposed here. Resolution effects have been ruled out by running simulations at 10 and 15 SPH particles per radius (corresponding to roughly 3298 and 8546 computational particles per solid sphere). The low-
 $\mathit{De}$
plateau of
 $\unicode[STIX]{x1D702}_{r}$
is recovered, in good agreement with the results of Yang et al. (Reference Yang, Krishnan and Shaqfeh2016). However, in the present constant-viscosity Oldroyd-B model, by contrast, shear thickening is observed for
 $De>1$
, which is in qualitative agreement with experimental data.
Despite this, the improvement here remains qualitative in that the experimental values of
 $\unicode[STIX]{x1D702}_{r}$
are still significantly underestimated using the present single-particle simulation approach. Possible reasons for this discrepancy have been discussed by Yang et al. (Reference Yang, Krishnan and Shaqfeh2016) where the lack of proper interparticle interactions using a single-sphere set-up was suggested. In fact, Boger liquids do not show particle chaining under shear, which cannot motivate a posteriori the choice of a single-particle approach where particle alignment is ‘constrained’ by the simulation box periodicity, imposing an artificial lattice structure to the suspension. However, in their more recent work, Yang & Shaqfeh (Reference Yang and Shaqfeh2018b
) have reported, using 10 particles at
 $\unicode[STIX]{x1D719}=0.05$
, essentially the same low-shear-rate suspension viscosity as the single-sphere computation in figure 1(a).
In order to explore this effect, we consider next multiple-particle simulations at the same solid volume fraction
 $\unicode[STIX]{x1D719}=0.05$
. The same parameters are considered as above, whereas the box of size
 $L_{x}\times L_{y}\times L_{z}=16a\times 8a\times 32a$
is now changed to accommodate
 $N=49$
solid suspended spheres. The wall velocity has been changed to
 $V_{w}=0.846$
to preserve the same macroscopic shear rate. Note that the ratio
 $L_{z}/a=32$
is comparable with the value 45 (1 mm plates gap for
 ${\approx}43~\unicode[STIX]{x03BC}\text{m}$
latex particle diameters) considered in experiments using parallel-plate rheometers (Dai et al.
Reference Dai, Qi and Tanner2014). We have checked that rheological results do not depend on the present choice of the simulation box. Resolution of
 $10$
SPH particles per radius is considered, which showed numerical convergence in the single-sphere set-up. In figure 1 simulations results of the multiple-particle simulations (black diamonds) are in excellent agreement with the experimental data, with both mild suspension shear thickening and the exact value of
 $\unicode[STIX]{x1D702}_{r}$
correctly reproduced.
Note that, unlike the hydrodynamic shear thickening at large concentrations reported in Brady & Bossis (Reference Brady and Bossis1988), Bian & Ellero (Reference Bian and Ellero2014) and Vázquez-Quesada & Ellero (Reference Vázquez-Quesada and Ellero2016) for a suspension with Newtonian matrix, which is determined by the balance of shearing and repulsive forces and controlled by the effective shear-rate parameter
 $\dot{\unicode[STIX]{x1D6FE}}^{\ast }=6\unicode[STIX]{x1D702}_{0}a\dot{\unicode[STIX]{x1D6FE}}/F_{0}$
, here we keep repulsive forces
 $F_{0}$
fixed (in our case
 $F_{0}=2.115$
) leading to a constant
 $\dot{\unicode[STIX]{x1D6FE}}^{\ast }$
. Therefore the classical mechanism of mild hydrodynamic shear thickening is ruled out. Shear thickening here is uniquely determined by the properties of the viscoelastic matrix.
The microstructural configurations corresponding to
 $\unicode[STIX]{x1D719}=0.05$
at two representative Deborah numbers in the viscosity plateau and shear-thickened state (
 $\mathit{De}=0.5$
and
 $\mathit{De}=2.0$
) are shown in figure 1(b,c). The grey scale represents the magnitude of the
 $\text{Tr}(\boldsymbol{c})$
quantifying polymer stretching as well as their directional behaviour. It can be seen how, even at such a low solid volume fraction
 $\unicode[STIX]{x1D719}=0.05$
, regions of large polymer stress connect several particles along the expansion axis in the shearing plane. These high elongational flows mediate significant viscoelastic interparticle interactions. At larger
 $\mathit{De}=2.0$
high-stress regions become thinner, extending significantly and connecting particles far apart, which leads to increased local dissipation and the observed macroscopic viscoelastic thickening. Very recently, Yang & Shaqfeh (Reference Yang and Shaqfeh2018a
) have reported shear thickening in a viscoelastic suspension under ultra-dilute conditions (
 $\unicode[STIX]{x1D719}=0.0005$
). Although mild thickening was obtained only in the particle-induced fluid stress component (the overall suspension viscosity effectively shear thins), a physical mechanism was proposed to explain the observed behaviour. It was shown that the mild thickening under ultra-dilute conditions is related to extra stress generated in regions of closed streamlines near the particle surfaces. In those strain-dominated regions, polymers periodically stretch and relax, leading to an increased value of polymeric stresses. The same explanation (i.e. based on near-particle field modification) was provided also in the non-dilute case (Yang & Shaqfeh Reference Yang and Shaqfeh2018b
), i.e. for
 $\unicode[STIX]{x1D719}\geqslant 0.05$
, ruling out the effect of polymer stretching on flow thickening in regions far from the particle surfaces. We return to this issue by analysing in detail the suspension microstructure in § 3.6.
3.3 Suspension rheology: semi-dilute case
In this section we explore the semi-dilute case, i.e. solid volume fraction
 $\unicode[STIX]{x1D719}=0.1$
, using
 $N=98$
solid spheres distributed in the same domain as in the previous section. Figure 2(a) shows the suspension relative viscosities obtained compared to experiments. The previous converged numerical resolution (i.e. 10 SPH particles per radius) is used. Numerical data are compared with experiments of Dai et al. (Reference Dai, Qi and Tanner2014) at the given solid volume fraction as well as with the data of Scirocco et al. (Reference Scirocco, Vermant and Mewis2005) at slightly larger but comparable
 $\unicode[STIX]{x1D719}=0.113$
. In the latter experiment a high-molecular-weight polyisobutylene (0.1 %,
 $M_{v}\approx 1.3\times 10^{-6}$
) in low-molecular-weight polybutene was considered as a Boger matrix. Relative viscosity data in figure 2 have been made dimensionless with their specific Boger fluid viscosity (see BF1 specification in Scirocco et al. (Reference Scirocco, Vermant and Mewis2005)) where
 $\unicode[STIX]{x1D702}_{t}=49~\text{Pa}~\text{s}$
and a different relaxation time
 $\unicode[STIX]{x1D706}=0.547~\text{s}$
has been estimated from
 $N_{1}$
data using the same calibration protocol as discussed in the previous section.
(a) Rheology of the viscoelastic suspension with volume fraction
 $\unicode[STIX]{x1D719}=0.1$
:
 $\unicode[STIX]{x2B20}$
, Dai et al. (Reference Dai, Qi and Tanner2014), experimental results;
 $\ast$
, Scirocco et al. (Reference Scirocco, Vermant and Mewis2005), experimental results (11.3 %);
 $\blacklozenge$
, present SPH simulation (multiple particles). (b,c) Steady-state snapshots of the particle configuration at macroscopic Deborah numbers
 $\mathit{De}=0.5$
(b) and
 $\mathit{De}=2.0$
(c). Grey scale represents the magnitude of
 $\text{Tr}(\boldsymbol{c})$
.

It can be seen that the present simulation data for
 $\unicode[STIX]{x1D702}_{r}$
underestimates the results of Dai et al. (Reference Dai, Qi and Tanner2014) but are in reasonably good agreement with the experimental data reported by Scirocco et al. (Reference Scirocco, Vermant and Mewis2005) at slightly larger solid volume fraction, at least for
 $De<1$
. On the other hand, the shear-thickening trend seems to be more in line with the data of Dai et al. (Reference Dai, Qi and Tanner2014) rather than Scirocco et al. (Reference Scirocco, Vermant and Mewis2005), where a milder viscosity increase is reported.
(a) Rheology of the viscoelastic suspension with volume fraction
 $\unicode[STIX]{x1D719}=0.3$
:
 $\unicode[STIX]{x2B20}$
, Dai et al. (Reference Dai, Qi and Tanner2014), experimental results;
 $\ast$
, Scirocco et al. (Reference Scirocco, Vermant and Mewis2005), experimental results (26.6 %);
 $\Box$
, Zarraga et al. (Reference Zarraga, Hill and Leighton2001), experimental results;
 $\blacklozenge$
, present SPH simulation (multiple particles). (b,c) steady-state snapshots of particle configuration at macroscopic Deborah numbers
 $\mathit{De}=0.5$
(b) and
 $\mathit{De}=2.0$
(c). The grey scale represents the magnitude of
 $\text{Tr}(\boldsymbol{c})$
.

It should be remarked that in Scirocco et al. (Reference Scirocco, Vermant and Mewis2005)
 $2.7~\unicode[STIX]{x03BC}\text{m}$
polystyrene beads were used as dispersed phase, leading to an effective Péclet number considerably smaller than the one considered by Dai et al. (Reference Dai, Qi and Tanner2014). It is important to keep this in mind, as ‘colloidal’ effects could start to play a role. In both cases, the critical Deborah number for the onset of the shear thickening (
 $\mathit{De}_{c}\approx 0.7$
) is reasonably well reproduced. Similarly to the previous case, microstructure related to the shear thickening is reported in figure 2(b,c), where regions of structural change are intensified at larger
 $De$
, also compared to
 $\unicode[STIX]{x1D719}=0.05$
.
3.4 Suspension rheology: concentrated case
In this section we explore the moderately concentrated case
 $\unicode[STIX]{x1D719}=0.3$
, using
 $N=294$
solid spheres distributed in the same domain as in the previous sections. In figure 3(a) the simulation results for
 $\unicode[STIX]{x1D702}_{r}$
are compared with experiments by Scirocco et al. (Reference Scirocco, Vermant and Mewis2005) (slightly smaller
 $\unicode[STIX]{x1D719}=0.266$
) and Dai et al. (Reference Dai, Qi and Tanner2014). We have added here also the results of Zarraga et al. (Reference Zarraga, Hill and Leighton2001), where experimental data were presented only in the concentrated regime (
 $\unicode[STIX]{x1D719}\geqslant 0.3$
) using a Boger liquid similar to Dai et al. (Reference Dai, Qi and Tanner2014) and a suspension of
 $43.0\pm 5.7~\unicode[STIX]{x03BC}\text{m}$
diameter glass spheres, significantly more polydisperse than Dai (
 $43.0\pm 0.63~\unicode[STIX]{x03BC}\text{m}$
). As in the previous cases, the polymer relaxation time of the Boger matrix of Zarraga et al. (Reference Zarraga, Hill and Leighton2001) has been estimated from the reported viscometric functions by assuming the same
 $\unicode[STIX]{x1D702}_{p}/\unicode[STIX]{x1D702}_{t}=0.32$
ratio, leading in this case to a fitted
 $\unicode[STIX]{x1D706}=0.156~\text{s}$
. Corresponding microstructural changes related to the shear-thickening behaviour at
 $\unicode[STIX]{x1D719}=0.3$
are shown in Figure 3(b,c).
Despite the qualitative agreement for shear thickening, the quantitative comparison with Dai et al. (Reference Dai, Qi and Tanner2014) becomes poorer, in line with the trend already shown in the semi-dilute case. An excellent agreement, however, is obtained with the results of Zarraga et al. (Reference Zarraga, Hill and Leighton2001), where a significantly smaller
 $\unicode[STIX]{x1D702}_{r}$
(
 ${\approx}30$
–40 % with respect to Dai) over the entire range of Deborah number is observed. For the sake of completeness we have reported also the data of Scirocco et al. (Reference Scirocco, Vermant and Mewis2005) (corresponding to their Boger fluid BF1) properly non-dimensionalized. Although the latter corresponds to a smaller concentration (26.6 %), the disagreement in
 $\unicode[STIX]{x1D702}_{r}$
value seems too large to be justified based on 11.3 % relative decrease in concentration. The reason for this discrepancy among experiments is currently not known. In order to shed some light on this issue, variability in the numerical results will be analysed in § 3.5.
The previous data show that the present simulation method gives results that capture very well the trend in the experimental data, despite the large variability in the latter.
3.5 Suspension rheology: variability analysis
As mentioned above, large variability is present among different experiments dealing with apparently similar systems (same Boger matrix and dispersed phase). It is therefore interesting to explore variability in the simulation data too. In this section we analyse in detail the dependence of the rheology results on the initial conditions used for the suspended particles and compare them with available experimental data. As discussed in Vázquez-Quesada & Ellero (Reference Vázquez-Quesada and Ellero2016) and Vázquez-Quesada, Bian & Ellero (Reference Vázquez-Quesada, Bian and Ellero2016a ), initial positions are calculated by using a preprocessing Monte Carlo algorithm which assigns an appropriate potential to every solid particle and therefore drives them to non-overlapping positions. This protocol generates a pseudo-random particle distribution consistent with the specified solid volume fraction.
(a) Low-
 $\mathit{De}$
plateau values of the suspension relative viscosity
 $\unicode[STIX]{x1D702}_{r}$
versus concentration
 $\unicode[STIX]{x1D719}$
. Experiments of Zarraga et al. (Reference Zarraga, Hill and Leighton2001), Scirocco et al. (Reference Scirocco, Vermant and Mewis2005), Pasquino et al. (Reference Pasquino, Grizzuti, Maffettone and Greco2008) and Dai et al. (Reference Dai, Qi and Tanner2014) shown as reference. (b) Zoom of dilute regime. Computations corresponding to single-sphere and many-particle set-ups with initial lattice configuration as well as five initial random configurations are shown.

In figure 4(a), the relative viscosity in the low-
 $\mathit{De}$
plateau as a function of the solid volume fraction
 $\unicode[STIX]{x1D719}$
has been drawn for the simulations and experiments previously mentioned. Four sets of experimental data have been reported: (1) the results of Dai et al. (Reference Dai, Qi and Tanner2014); (2) the results of Zarraga et al. (Reference Zarraga, Hill and Leighton2001) in the concentrated regime (
 $\unicode[STIX]{x1D719}\geqslant 0.3$
); (3) the results of Scirocco et al. (Reference Scirocco, Vermant and Mewis2005); and (4) the results of Pasquino et al. (Reference Pasquino, Grizzuti, Maffettone and Greco2008) in the dilute regime (
 $\unicode[STIX]{x1D719}\leqslant 0.1$
). In the latter experiment a nearly constant-viscosity silicone fluid (60 000 cSt from Dow Corning) was used for the matrix. The solid line represents the corresponding best fit proposed by the authors:
 $\unicode[STIX]{x1D702}_{r}=1+2.5\unicode[STIX]{x1D719}+20.9\unicode[STIX]{x1D719}^{2}$
. Batchelor theory (Batchelor & Green Reference Batchelor and Green1972) for the semi-dilute case
 $\unicode[STIX]{x1D702}_{r}=1+2.5\unicode[STIX]{x1D719}+7.6\unicode[STIX]{x1D719}^{2}$
is also drawn. Good agreement is obtained in the dilute/semi-dilute case where most of the experimental data agree. As discussed in the previous section, for
 $\unicode[STIX]{x1D719}\geqslant 0.3$
visible deviations arise between simulation and experiment and among experiments too (note the logarithmic scale used). In D’Avino et al. (Reference D’Avino, Greco, Hulsen and Maffettone2013) it was shown that a variability in the measured viscosity of a viscoelastic suspension could result from different initial conditions, leading to values that can significantly exceed the Batchelor prediction even in the dilute regime. For the sake of completeness, here we perform a similar variability analysis at solid volume fraction
 $\unicode[STIX]{x1D719}=0.05$
. From figure 1(a), it is clear that in the low-
 $De$
plateau, the SPH results of many-particle simulation lead to significantly larger values of
 $\unicode[STIX]{x1D702}_{r}$
with respect to the value
 ${\approx}1.14$
predicted by using a single-sphere approach. In figure 4(b) different extracted viscosities are reported for specific initial conditions. Results are compared with Batchelor’s theory (green line), the experimental results of Pasquino et al. (Reference Pasquino, Grizzuti, Maffettone and Greco2008) under dilute conditions (red symbols; red line best fit) and the results of Dai et al. (Reference Dai, Qi and Tanner2014) (blue pentagons). We have run an additional simulation with many particles (
 $N_{c}=49$
for
 $\unicode[STIX]{x1D719}=0.05$
) initially located on a regular cubic lattice. The resulting measured
 $\unicode[STIX]{x1D702}_{r}\approx 1.14$
(black circles) is in excellent agreement with that estimated via the single-sphere SPH approach, Batchelor’s theory and previous results of Yang et al. (Reference Yang, Krishnan and Shaqfeh2016). In this case, particle layers slide parallel to each other, preventing two particles from getting very close. This case is analogous to the single-sphere set-up, where, however, due to the imposition of periodic boundary conditions, the interparticle distance was fixed by default. The good matching between the two suggests that, provided that no close interparticle interactions occur, Batchelor’s theory is satisfied and in full agreement with single-sphere calculations. Nevertheless, as can be seen in figure 1(b,c), even at this dilute concentration
 $\unicode[STIX]{x1D719}=0.05$
, interparticle ‘collisions’ are likely to occur, which can alter the measured suspension viscosity. We have reported five different averaged steady-state values of
 $\unicode[STIX]{x1D702}_{r}$
(simulations were run up to a total strain
 $\dot{\unicode[STIX]{x1D6FE}}t\approx 35$
) corresponding to five different random configurations (points a–e in figure 4
b). In the most general case, collisions dominated by large short-range hydrodynamic interactions occur frequently, leading to values of
 $\unicode[STIX]{x1D702}_{r}$
significantly larger than for the cubic lattice (and single-sphere) case, and even larger than the experimental data of Pasquino et al. (Reference Pasquino, Grizzuti, Maffettone and Greco2008) (red line). This increased viscosity in the results (up to
 ${\approx}5\,\%$
) is sensitive to the initial conditions chosen, in line with earlier 2-D numerical studies (Hwang et al.
Reference Hwang, Hulsen and Meijer2004b
) and, more recently, with the 3-D small amplitude oscillatory shear simulations of D’Avino et al. (Reference D’Avino, Greco, Hulsen and Maffettone2013). Figure 4(b) shows that variability in
 $\unicode[STIX]{x1D702}_{r}$
(spanned range of averaged values) is also of the order of 4 %–5 %. In the dilute case, the fact that a small number of simulated spheres is considered makes the choice of their initial conditions (i.e. on the same streamline for close interparticle interactions or on different streamlines for far-field hydrodynamic interactions) relevant. In the semi-dilute/dense case this effect is less likely to occur as multiple particle interactions quickly homogenize the initial configuration. This points also to a possible issue in experiments which is related to the specific sample preparation.
In a very recent work of Yang & Shaqfeh (Reference Yang and Shaqfeh2018b
), no viscosity increase was observed with respect to the single-sphere set-up (Yang et al.
Reference Yang, Krishnan and Shaqfeh2016). Although this can be related to the specific random initial configuration chosen (only one realization was reported), it can also be due to the lack of incorporation of interparticle repulsive forces in the bulk shear stress calculations. In fact, the authors reported deviations of the order of
 $4\,\%$
between bulk shear stress calculations and those based on wall shear stress (which include stress transmission due to collisions), which can explain the increased values observed here. Note also that no short-range interparticle lubrication forces are used in Yang & Shaqfeh (Reference Yang and Shaqfeh2018b
).
We conclude this section by highlighting the fact originally suggested by Yang et al. (Reference Yang, Krishnan and Shaqfeh2016) that viscoelastic suspensions, even under dilute conditions as low as
 $\unicode[STIX]{x1D719}=0.05$
, require accurate description of the viscoelastic interparticle interaction together with its realistic microstructure under shear (i.e. not artificially prescribed a priori as in the single simulation approach) for quantitative agreement with experiments.
3.6 Microstructural analysis
In this section we provide information about microstructural quantities in the suspension under flow, namely inhomogeneous behaviour of the conformation tensor, local dissipation as well as statistics associated with suspended particles. The goal is to link the observed shear-thickening behaviour of the suspension to critical microstructural changes.
3.6.1 Particle positions
Probability distribution function of the solid particle positions. Solid volume fraction
 $\unicode[STIX]{x1D719}=0.3$
,
 $De=0.5$
(a) in the viscosity plateau regime and
 $\unicode[STIX]{x1D719}=0.3$
,
 $De=2$
(b) in the viscosity thickening regime. Here
 $L_{z}$
is the direction of confinement under shear.

In figure 5 the probability distribution function (p.d.f.) of the solid particle positions as a function of the position along the confining direction
 $L_{z}$
is shown. Statistics have been extracted at
 $\unicode[STIX]{x1D719}=0.3$
once the system has achieved the steady state for two different Deborah numbers:
 $De=0.5$
(a) in the viscous plateau regime and
 $De=2$
(b) in the viscous thickening regime. As can be seen, at the specified confinement length
 $L_{z}=32a$
, no inhomogeneous distribution (e.g. layering or migration) is observed and the particles remain well dispersed. Similar results are observed at other concentrations.
3.6.2 Particle angular velocities
The statistics of the angular velocities of the solid particles for different Deborah numbers are analysed and shown in figure 6. In figure 6(a) the p.d.f.s of the angular velocities are reported for
 $\unicode[STIX]{x1D719}=0.05$
. In order to remove near-wall effects on particle rotations, both panels are calculated only with the particles in the bulk domain (i.e. located at distance
 ${\geqslant}6R$
from the walls), where results do not change.
The distributions are characterized by a lower average value and larger widths as
 $De$
increases. The decrease of the mean angular velocity with increasing liquid elasticity is a well-known behaviour which has already been reported in a single-sphere set-up under shear in theory using second-order models (Housiadas & Tanner Reference Housiadas and Tanner2011), in simulations (D’Avino et al.
Reference D’Avino, Hulsen, Snijkers, Vermant, Greco and Maffettone2008; Snijkers et al.
Reference Snijkers, D’Avino, Maffettone, Greco, Hulsen and Vermant2011) as well as in experiments with Boger liquids (Snijkers et al.
Reference Snijkers, D’Avino, Maffettone, Greco, Hulsen and Vermant2009). Figure 6(b) shows the mean angular velocity
 $\langle \unicode[STIX]{x1D714}\rangle /\dot{\unicode[STIX]{x1D6FE}}$
versus
 $De$
for
 $\unicode[STIX]{x1D719}=0.05{-}0.3$
. The solid particles rotate in the shearing plane with a rate
 $\unicode[STIX]{x1D714}$
dependent on the applied shear rate, delivering the classical result
 $\unicode[STIX]{x1D714}=\dot{\unicode[STIX]{x1D6FE}}/2$
in the Newtonian limit (
 $De\rightarrow 0$
) and a reduction of the rotation rate with increasing elasticity. The black line corresponds to the result of Snijkers et al. (Reference Snijkers, D’Avino, Maffettone, Greco, Hulsen and Vermant2011) under dilute conditions and is shown as reference.
From figure 6 it can be evinced also that an increase of the solid volume fraction
 $\unicode[STIX]{x1D719}$
reduces the rate of decrease of
 $\langle \unicode[STIX]{x1D714}\rangle /\dot{\unicode[STIX]{x1D6FE}}$
(
 $De$
) (
 $\unicode[STIX]{x1D719}=0.3$
, pink line) which is probably due to the increased interparticle hydroelastic interactions interfering destructively in relation to this trend. From figure 6(a) note also that the widths of the angular p.d.f.s increase with increasing
 $De$
, suggesting that significant elastic interparticle interactions tend to ‘randomize’ the particle’s spins.
(a) P.d.f. of the angular velocity for the dilute case
 $\unicode[STIX]{x1D719}=0.05$
at different Deborah numbers. (b) Average angular velocity
 $\langle \unicode[STIX]{x1D714}\rangle$
versus
 $De$
for
 $\unicode[STIX]{x1D719}=0.05{-}0.3$
. The standard result (solid line, Snijkers et al. (Reference Snijkers, D’Avino, Maffettone, Greco, Hulsen and Vermant2011)) is re-obtained in the dilute limit.

3.6.3 Local polymer stretching
In this section we report statistics on the distribution of the local polymer extension field
 $\text{Tr}[\boldsymbol{c}]$
for different Deborah numbers and solid volume fractions. Figure 7(a–c) shows 2-D projections of
 $\text{Tr}[\boldsymbol{c}]$
along the shearing plane for
 $\unicode[STIX]{x1D719}=0.05,0.1,0.3$
and fixed
 $De=0.5$
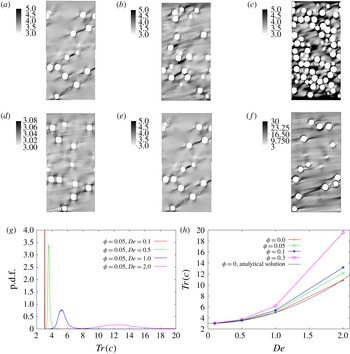
. As can be seen, the distribution is highly inhomogeneous, showing distinct peaks of the polymer extension localized in the regions between departing particles. The situation becomes much more complex in the concentrated case where highly irregular polymer stretching filaments connect multiple particles. Note also the regions of high polymer extension connecting two (or more) particles; these must mediate significant elastic interactions already at low solid volume fractions, therefore even the case
 $\unicode[STIX]{x1D719}=0.05$
– traditionally accepted as a dilute regime in term of Einstein’s theory for Newtonian suspending liquids – can no longer be assumed as such and a significantly larger suspension viscosity is expected. This is consistent with the results reported in § 3.2.
(a–f) Two-dimensional projections of the polymer extension field
 $\text{Tr}[\boldsymbol{c}]$
along the shearing plane for different configurations. (a–c) Different concentrations:
 $\unicode[STIX]{x1D719}=0.05$
(a),
 $\unicode[STIX]{x1D719}=0.1$
(b) and
 $\unicode[STIX]{x1D719}=0.3$
(c); plots correspond to fixed
 $De=0.5$
(plateau) in all cases. (d–f) Different Deborah numbers:
 $\mathit{De}=0.1$
(d),
 $\mathit{De}=0.5$
(e) and
 $\mathit{De}=2.0$
(f); plots correspond to fixed
 $\unicode[STIX]{x1D719}=0.05$
(plateau) in all cases. (g) The p.d.f. of
 $\text{Tr}[\boldsymbol{c}]$
for the case
 $\unicode[STIX]{x1D719}=0.05$
. (h) Plot of
 $\langle \text{Tr}[\boldsymbol{c}]\rangle$
versus
 $De$
.

In figure 7(g,h) we analyse the statistics of polymer conformation. In particular, figure 7(g) shows the p.d.f. (
 $\text{Tr}[\boldsymbol{c}]$
) in the dilute case
 $\unicode[STIX]{x1D719}=0.05$
. At low
 $De$
, the distribution is highly peaked showing little dispersion. The mean values
 $\langle \text{Tr}[\boldsymbol{c}]\rangle$
as well as the p.d.f. widths increase with
 $De$
. Figure 7(h) shows the
 $\langle \text{Tr}[\boldsymbol{c}]\rangle$
versus
 $De$
for
 $\unicode[STIX]{x1D719}=0.05{-}0.3$
. The case corresponding to the pure elastic liquid (
 $\unicode[STIX]{x1D719}=0$
) is also shown and compared to the analytical result for the Oldroyd-B model. It is clear that an increase of the solid volume fraction
 $\unicode[STIX]{x1D719}$
induces a steeper increase of the mean polymer extension in response to the larger local flow gradients present in the fluid domain.
For the sake of completeness in figure 7 we report also the typical changes in the local field
 $\text{Tr}[\boldsymbol{c}]$
as a function of
 $De$
. Figure 7(d–f) shows the effect of
 $De=0.1,0.5,2$
keeping fixed
 $\unicode[STIX]{x1D719}=0.05$
. As suggested in the analysis of the average
 $\langle \text{Tr}[\boldsymbol{c}]\rangle$
, both
 $\unicode[STIX]{x1D719}$
and
 $De$
contribute to increase the local Deborah number and therefore the local polymer stretching. The plots resemble those reported in the 2-D calculations of Hwang et al. (Reference Hwang, Hulsen and Meijer2004b
), where highly oriented and non-uniform microstructures corresponding to large polymer extensions were observed and generally connected to the corresponding shear thickening. However, no quantitative analysis of the microstructure and its influence on the suspension thickening was carried out. Moreover,
 $\text{Tr}[\boldsymbol{c}]$
is not necessarily the most appropriate quantity to monitor local dissipation specifically linked to suspension thickening. In fact, as can be seen in figure 7(h), in a pure Oldroyd-B model (
 $\unicode[STIX]{x1D719}=0$
)
 $\text{Tr}[\boldsymbol{c}]$
increases as an effect of a simple shear flow too but no enhanced dissipation (i.e. thickening) can take place. In fact, the Oldroyd-B matrix has a constant viscosity
 $\unicode[STIX]{x1D702}_{s}+\unicode[STIX]{x1D702}_{p}$
under simple shear which is independent of
 $De$
. The role played by the extensional flow component (rather than the polymer stretching itself) is therefore crucial, with an enhanced local shear flow and related enhanced stretching being unable to explain the increased dissipation. In the next section we focus on a different microstructural quantity, i.e. the local viscoelastic dissipation occurring in the fluid, and link it to the overall suspension thickening.
3.6.4 Local viscoelastic dissipation
In this section we analyse in detail the statistical properties of the local dissipation for a viscoelastic Oldroyd-B fluid model. The general viscoelastic dissipation function
 $\unicode[STIX]{x1D703}_{i}$
associated with each Lagrangian element of fluid
 $i$
(i.e. SPH fluid particle) can be straightforwardly calculated in the generic framework. The general non-isothermal model (Vázquez-Quesada et al.
Reference Vázquez-Quesada, Ellero and Español2009) predicts an evolution for the entropy function (i.e.
 $T{\dot{S}}_{i}=\unicode[STIX]{x1D703}_{i}/d_{i}$
) which satisfies the second law of thermodynamics (monotonic temporal increase) at the discrete level and therefore the entropy production is positive definite by construction. Thus
 $\unicode[STIX]{x1D703}_{i}=\unicode[STIX]{x1D703}_{i}^{visc}+\unicode[STIX]{x1D703}_{i}^{elast}$
, where
 $\unicode[STIX]{x1D703}_{i}^{visc}$
is the standard irreversible viscous heating defined as
 $$\begin{eqnarray}\displaystyle \unicode[STIX]{x1D703}_{i}^{visc}=(D+2)\unicode[STIX]{x1D702}_{s}\mathop{\sum }_{j}{\displaystyle \frac{-W_{ij}^{\prime }}{d_{j}}}(\boldsymbol{v}_{ij}\boldsymbol{\cdot }\boldsymbol{e}_{ij})^{2}\geqslant 0. & & \displaystyle\end{eqnarray}$$
This is an SPH representation of
 $\unicode[STIX]{x1D702}_{s}\unicode[STIX]{x1D735}\boldsymbol{v}\boldsymbol{ : }\unicode[STIX]{x1D735}\boldsymbol{v}$
, which is positive definite in the discrete setting due to the property of the kernel function
 $W_{ij}^{\prime }\leqslant 0$
.
Calculation provided in appendix A gives an expression for
 $\unicode[STIX]{x1D703}_{i}^{elast}$
– the viscoelastic dissipation function, expressing the dissipation generated by the polymers through their flow response (orientation/stretching) – in terms of the conformation tensor
 $\boldsymbol{c}_{i}$
as
 $$\begin{eqnarray}\displaystyle \unicode[STIX]{x1D703}_{i}^{elast}={\displaystyle \frac{\unicode[STIX]{x1D702}_{p}}{2\unicode[STIX]{x1D706}^{2}}}[\text{Tr}[\boldsymbol{c}_{i}]+\text{Tr}[\boldsymbol{c}_{i}^{-1}]-6], & & \displaystyle\end{eqnarray}$$
which is positive definite by construction by virtue of the properties of the conformation tensor. Note that this expression is consistent with the mechanical dissipation given by Wapperom & Hulsen (Reference Wapperom and Hulsen1998) for several viscoelastic models and shows that their results comply with the generic framework.
In the following, the statistics associated with the scalar (3.2) are analysed and a quantitative link to the observed global thickening of the suspension is proposed.
3.6.5 Dissipation function statistics and suspension shear thickening
In the case of a suspension under shear we can define the overall suspension viscosity as
 $\unicode[STIX]{x1D702}_{eff}=T\langle {\dot{s}}\rangle /\dot{\unicode[STIX]{x1D6FE}}_{macro}^{2}$
, where
 $\langle {\dot{s}}\rangle$
is the global entropy density (i.e. per unit of volume) production averaged over the entire fluid domain, whereas
 $\dot{\unicode[STIX]{x1D6FE}}_{macro}$
is the macroscopic externally applied shear rate (Einstein Reference Einstein1906, Reference Einstein1911). In the case of a Newtonian suspension
 $\unicode[STIX]{x1D703}_{i}=\unicode[STIX]{x1D703}_{i}^{visc}$
and therefore we obtain a corresponding relative suspension viscosity
 $$\begin{eqnarray}\unicode[STIX]{x1D702}_{rel}=\frac{\unicode[STIX]{x1D702}_{eff}}{\unicode[STIX]{x1D702}_{s}}=\frac{\langle \unicode[STIX]{x1D703}_{i}^{visc}\rangle }{\unicode[STIX]{x1D702}_{s}\dot{\unicode[STIX]{x1D6FE}}_{macro}^{2}}={\displaystyle \frac{\langle \dot{\unicode[STIX]{x1D6FE}}_{i}^{2}\rangle }{\dot{\unicode[STIX]{x1D6FE}}_{macro}^{2}}}.\end{eqnarray}$$
Since in an inertia-less Stokes fluid the local flow field (and related gradients) is topologically invariant under different applied shear rates, it must result that, for the same microstructure,
 $\dot{\unicode[STIX]{x1D6FE}}_{i}=\dot{\unicode[STIX]{x1D6FE}}_{0}(\boldsymbol{r}_{i})\dot{\unicode[STIX]{x1D6FE}}_{macro}/\dot{\unicode[STIX]{x1D6FE}}_{macro,0}$
, where
 $\dot{\unicode[STIX]{x1D6FE}}_{0}(\boldsymbol{r}_{i})$
is a given shear rate field corresponding to a reference macroscopic shear rate
 $\dot{\unicode[STIX]{x1D6FE}}_{macro,0}$
. As a result,
 $\langle \dot{\unicode[STIX]{x1D6FE}}_{i}^{2}\rangle \propto \dot{\unicode[STIX]{x1D6FE}}_{macro}^{2}$
and the relative suspension viscosity cannot depend on
 $\dot{\unicode[STIX]{x1D6FE}}_{macro}$
, which is a well-known result for Newtonian suspensions at low/moderate solid volume fractions. Note that at large solid volume fractions (not considered here), thickening due to short-range lubrication/contact interparticle interactions can occur also in a Newtonian suspension.
Opposite to the Newtonian case, the viscoelastic dissipation is associated with an extra elastic contribution
 $\unicode[STIX]{x1D703}_{i}^{elast}$
. In this case we have that
 $$\begin{eqnarray}\unicode[STIX]{x1D702}_{rel}^{elast}={\displaystyle \frac{\unicode[STIX]{x1D702}_{p}}{\unicode[STIX]{x1D702}_{t}}}{\displaystyle \frac{\langle \text{Tr}[\boldsymbol{c}]+\text{Tr}[\boldsymbol{c}^{-1}]-6\rangle }{2\unicode[STIX]{x1D706}^{2}\dot{\unicode[STIX]{x1D6FE}}_{macro}^{2}}}.\end{eqnarray}$$
Note that, when compared to the polymer extension, this quantity contains an additional contribution proportional to
 $\text{Tr}[\boldsymbol{c}^{-1}]$
, which causes viscoelastic dissipation too. By focusing on this quantity, we observed that for a pure Oldroyd-B fluid (
 $\unicode[STIX]{x1D719}=0$
) under simple shear
 $\dot{\unicode[STIX]{x1D6FE}}_{macro}$
, this leads to
 $\langle \text{Tr}[\boldsymbol{c}]+\text{Tr}[\boldsymbol{c}^{-1}]-6\rangle =2\unicode[STIX]{x1D706}^{2}\dot{\unicode[STIX]{x1D6FE}}_{macro}^{2}=2De^{2}$
and, therefore, as in the previous case, the viscosity cannot depend on
 $\dot{\unicode[STIX]{x1D6FE}}_{macro}$
, i.e. there is no shear thickening of the suspending matrix, which is consistent with the rheology of an Oldroyd-B fluid. In order to obtain shear thickening of the suspension (
 $\unicode[STIX]{x1D719}\neq 0$
), it is necessary to have local complex flows with extensional components such that
 $\langle \text{Tr}[\boldsymbol{c}]+\text{Tr}[\boldsymbol{c}^{-1}]-6\rangle \sim (\unicode[STIX]{x1D706}\dot{\unicode[STIX]{x1D6FE}}_{macro})^{\unicode[STIX]{x1D6FC}}$
with
 $\unicode[STIX]{x1D6FC}>2$
. In figure 8 the scaling of the purely elastic contribution to the mean dissipation
 $\langle \text{Tr}[\boldsymbol{c}]+\text{Tr}[\boldsymbol{c}^{-1}]-6\rangle /De^{2}$
is plotted against the Deborah number
 $De=\unicode[STIX]{x1D706}\dot{\unicode[STIX]{x1D6FE}}_{macro}$
for
 $\unicode[STIX]{x1D719}=0.05,0.1,0.3$
. As can be seen, in the dilute case (
 $\unicode[STIX]{x1D719}=0.05$
) the scaling exponent is nearly everywhere 2, with a very slight deviation occurring only for
 $De>1$
. This is consistent with the fact that only mild shear thickening is observed under dilute conditions in the range of
 $De$
investigated (see figure 1). On the other hand, a clear upward deviation with scaling exponent
 ${>}2$
is observed at larger
 $\unicode[STIX]{x1D719}$
, which is linked to the significant suspension thickening observed in figures 2 and 3.
Scaling of the purely elastic contribution to the mean dissipation
 $\langle \text{Tr}[\boldsymbol{c}]+\text{Tr}[\boldsymbol{c}^{-1}]-6\rangle /De^{2}$
versus the Deborah number
 $De=\unicode[STIX]{x1D706}\dot{\unicode[STIX]{x1D6FE}}_{macro}$
for
 $\unicode[STIX]{x1D719}=0.05,0.1,0.3$
. Scaling exponents
 $\unicode[STIX]{x1D6FC}\geqslant 2$
are observed at large
 $De$
and
 $\unicode[STIX]{x1D719}$
.

Since we have now linked the overall suspension shear thickening to a microstructural property of the suspending phase (3.2), we proceed next to explore visually its distribution under different flow conditions and identify the regions responsible for thickening.
To this goal, it is convenient to define a frame-invariant rate-independent parameter that discriminates different flow regions (e.g. shear, extensional, etc.). Following Hemingway et al. (Reference Hemingway, Clarke, Pearson and Fielding2018) we define the dimensionless parameter
 $Q$
as
 $$\begin{eqnarray}\displaystyle Q={\displaystyle \frac{\unicode[STIX]{x1D706}_{D}^{2}-\unicode[STIX]{x1D706}_{\unicode[STIX]{x1D6FA}}^{2}}{\unicode[STIX]{x1D706}_{D}^{2}+\unicode[STIX]{x1D706}_{\unicode[STIX]{x1D6FA}}^{2}}}, & & \displaystyle\end{eqnarray}$$
where
 $\unicode[STIX]{x1D706}_{D}=\sqrt{\frac{1}{2}\boldsymbol{D}\boldsymbol{ : }\boldsymbol{D}}$
measures the local rate of deformation in the flow (
 $\unicode[STIX]{x1D63F}$
is the symmetric velocity-gradient tensor), whereas
 $\unicode[STIX]{x1D706}_{\unicode[STIX]{x1D6FA}}=\sqrt{{\textstyle \frac{1}{2}}\unicode[STIX]{x1D734}\boldsymbol{ : }\unicode[STIX]{x1D734}}$
measures the rate of rotation (
 $\unicode[STIX]{x1D734}$
is the antisymmetric velocity-gradient tensor). For
 $Q=+1$
the flow is extensional; for
 $Q=0$
it is pure shear; whereas for
 $Q=-1$
we have a pure rotation.
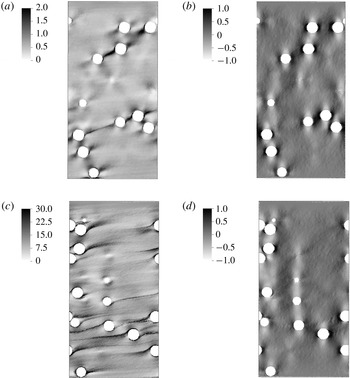
Two-dimensional projections of the dimensionless viscoelastic dissipation function
 $\unicode[STIX]{x1D703}^{elast}$
(a,c) and the dimensionless flow parameter
 $Q$
(b,d) along the shearing plane for different configurations: (a,b)
 $De=0.5$
; (c,d)
 $De=2.0$
; solid volume fraction
 $\unicode[STIX]{x1D719}=0.05$
in both cases.

Figure 9(a,c) shows the local dissipation function for two different
 $De=0.5$
(a) and
 $De=2$
(c). From these plots it can be evinced that areas of local large dissipation (black) are distributed near the particle surfaces but also in the regions between departing particles and can be significantly spatially extended. On the contrary, when looking at the
 $Q$
field (figure 9
b,d), it can be seen that regions of purely elongational flow (black areas,
 $Q=+1$
) are mostly located near the particle surface, whereas far from them simple shear or rotational flow components are dominating. The latter ones, although being associated with significant polymer stretching, contribute to the polymeric viscosity
 $\unicode[STIX]{x1D702}_{p}$
but cannot be linked to thickening. In fact, as discussed above, polymer stretching in simple shear (or rotation) cannot produce any viscosity increase in an Oldroyd-B model.
In conclusion, although areas of large dissipation can be distributed everywhere in the domain (depending on the specific particle configuration), the specific thickening in the flow at different
 $De$
can be associated only with those extensional areas (see figure 9
b,
 $De=0.5$
and figure 9
d,
 $De=2$
), which are mostly located near the particle surfaces and, depending on the solid volume fraction, in regions between close departing particles. This is in line with the suggestion of Yang & Shaqfeh (Reference Yang and Shaqfeh2018a
) in a suspension under ultra-dilute conditions, where, however, elastic thickening was associated with periodic polymer stretching occurring in the near-particle regions of closed streamlines only. Figure 9 shows that at finite concentrations extensional regions potentially occur also between closely separating particles and can contribute to the overall flow thickening of the suspension.
Single-sphere set-up at different
 $De=0.1$
, 0.5, 1.0, 2.0 (
 $\unicode[STIX]{x1D719}=0.05$
): (a)
 $Q$
field and (b)
 $\unicode[STIX]{x1D703}^{elast}/\mathit{De}_{loc}^{2}$
. The relative increasing trend in this quantity is connected to elastic thickening. Spatial correlation with extensional areas is clear.

In order to better clarify this point, we go back to the single-sphere setting, which, although underpredicting the absolute value of the relative suspension viscosity, was able to capture the correct thickening trend of the viscosity increase as a function of
 $De$
(figure 1). Unlike the many-particle simulation, the advantage of studying this single-sphere configuration is due to the flow field remaining essentially unchanged for different
 $De$
and therefore local relative thickening can be assessed in a clearer way under the same flow conditions.
Figure 10(a) shows the
 $Q$
field: as mentioned above, extensional areas are located near the front and rear of the particle (consistently with the many-particle configurations shown in figure 9) and remain approximately the same for different
 $De$
. Figure 10(b) shows the corresponding value of the function
 $\unicode[STIX]{x1D703}^{elast}/\mathit{De}_{loc}^{2}$
, where the local Deborah number is defined as
 $\mathit{De}_{loc}=\unicode[STIX]{x1D706}\sqrt{{\textstyle \frac{1}{2}}\boldsymbol{D}\boldsymbol{ : }\boldsymbol{D}}$
. As shown in figure 8, a relative increase of this function is associated with global elastic thickening. From figure 10(b) it can be seen that
 $\unicode[STIX]{x1D703}^{elast}/\mathit{De}_{loc}^{2}$
for different
 $De$
is almost constant everywhere (no increasing trend) except for the horizontal areas located between the particles (periodic boundary conditions are applied) where its absolute value increases with
 $De$
, especially for
 $De\geqslant 1$
. The correlation with areas of large extensional flow (left) is clear; however, for complex interparticle flows under non-dilute conditions, no closed trajectories around the particles are necessary to trigger the thickening response.
4 Conclusions
The present paper explores the viscosity in shear flow of dilute to semi-concentrated suspensions of non-Brownian spheres in viscoelastic matrices described by a single-mode Oldroyd-B model. There are two major components of this work: (i) the accuracy of the simulation method and (ii) the microstructural insight into the phenomenon of elastic thickening under non-dilute conditions. With regard to the simulation method, we note that the SPH system considers both long- and short-range forces; we have done semi-dilute (single-sphere) computations at a volume fraction of 0.05, plus multibody computations at the same concentration. At very low Deborah numbers (
 $\mathit{De}<0.1$
) the behaviour of the Oldroyd-B model is close to Newtonian. In figure 1 we see that the relative viscosity of the suspension is, from the SPH data using a single-sphere method, approximately 1.146; Yang et al. (Reference Yang, Krishnan and Shaqfeh2016), also using a single-sphere method, found 1.124. This is very close to the Einstein result. The Batchelor & Green (Reference Batchelor and Green1972) result (order
 $\unicode[STIX]{x1D719}^{2}$
) is 1.141, close to our single-sphere result. Figure 1 also shows that at
 $\unicode[STIX]{x1D719}=0.05$
there is a substantial effect of multibody interactions, and it is unlikely that single-sphere computations are adequate at this concentration. Pasquino et al. (Reference Pasquino, Grizzuti, Maffettone and Greco2008) suggested that truly dilute behaviour does not occur above
 $\unicode[STIX]{x1D719}=0.02.$
This is supported by the Yang et al. (Reference Yang, Krishnan and Shaqfeh2016) analysis at
 $\unicode[STIX]{x1D719}=0.01$
, where they found the relative viscosity was 1.025, the Einstein value. Our conclusion is that, for any suspension with
 $\unicode[STIX]{x1D719}\geqslant 0.02$
, multibody computations are necessary. Hence we consider the computations presented here to be accurate. It should be noted that some variability in the measured viscosity is present and depends on the initial conditions (in agreement with D’Avino et al. (Reference D’Avino, Greco, Hulsen and Maffettone2013)). This points also to a possible issue in experiments which is related to the specific sample preparation.
Figure 1 also shows the onset of shear thickening at a Deborah number of approximately 1, in agreement with experimental data. From figure 1(a) one can see the regions of structural change are intensified as the concentration increases at both
 $De=0.5$
and 2.0. There are clearly large interparticle interactions at all concentrations. The 2-D computations of Hwang et al. (Reference Hwang, Hulsen and Meijer2004b
) showed similar effects. Turning to figure 2 (
 $\unicode[STIX]{x1D719}=0.1$
) one sees an upturn in viscosity for
 $De>0.7$
and there are considerable differences between the various experiments with Boger fluid matrices, in regard to both the relative viscosities and the shear thickening. For the case of
 $\unicode[STIX]{x1D719}=0.3$
(figures 3 and 4) one sees that all the experimental deviations are intensified. Whilst the general behaviour can be computed, a quantitative comparison between computation and experiments is difficult to perform. It should be noted that for
 $\unicode[STIX]{x1D719}\geqslant 0.3$
the effects of particle friction begin to be important (Gallier et al.
Reference Gallier, Lemaire, Peters and Laurent2014), which could also lead to increased viscosity values.
With regard to the specific mechanism of elastic thickening in these complex suspensions, a microstructural analysis shows that elastic thickening correlates well with the averaged viscoelastic dissipation function, requiring a scaling of
 $\langle \unicode[STIX]{x1D703}^{elast}\rangle \sim \mathit{De}^{\unicode[STIX]{x1D6FC}}$
with
 $\unicode[STIX]{x1D6FC}\geqslant 2$
to take place. Locally, despite the fact that regions of large polymer stretching (and viscoelastic dissipation) can occur everywhere in the domain, flow regions uniquely responsible for the elastic thickening are well correlated to areas with significant extensional component. These occur in the vicinity of the particle surfaces, as pointed out recently by Yang & Shaqfeh (Reference Yang and Shaqfeh2018a
) under ultra-dilute conditions, but also in the extensional regions occurring between closely interacting particles at larger solid volume fractions.
Acknowledgements
This research is supported by the Basque Government through the BERC 2018-2021 programme and by the Spanish State Research Agency through BCAM Severo Ochoa excellence accreditation SEV-2017-0718 and through project RTI2018-094595-B-I00 funded by (AEI/FEDER, UE) and acronym ‘VIRHACOST’. Financial support from grant FIS2017-86007-C3-3-P from MINECO is also acknowledged. Computing resources offered by HPC Wales via the Project No. SCW1410 (‘Multiscale Modelling and Simulation of Complex Fluids’) is also gratefully acknowledged.
Appendix A. Entropy production in the fluid particle model for an Oldroyd-B fluid
The entropy production in generic is
 $$\begin{eqnarray}{\dot{S}}={\displaystyle \frac{\text{d}S}{\text{d}t}}(x)={\displaystyle \frac{\unicode[STIX]{x2202}S}{\unicode[STIX]{x2202}x}}\left.{\displaystyle \frac{\text{d}x}{\text{d}t}}\right|_{irr}\end{eqnarray}$$
because the reversible part does not contribute to the entropy production. In this equation,
 $x$
characterizes the full state of the system, given by its relevant variables (in the discrete Oldroyd-B model: positions, velocities, conformation tensors and internal energies of all the computational particles, i.e.
 $x=(\boldsymbol{r}_{1},\ldots ,\boldsymbol{r}_{N},\boldsymbol{v}_{1},\ldots ,\boldsymbol{v}_{N},\boldsymbol{c}_{1},\ldots ,\boldsymbol{c}_{N},E_{1},\ldots ,E_{N})$
). So we have
 $$\begin{eqnarray}\displaystyle {\dot{S}} & = & \displaystyle \mathop{\sum }_{i}\left[{\displaystyle \frac{\unicode[STIX]{x2202}S}{\unicode[STIX]{x2202}\boldsymbol{r}_{i}^{\unicode[STIX]{x1D707}}}}\left.{\displaystyle \frac{\text{d}\boldsymbol{r}_{i}^{\unicode[STIX]{x1D707}}}{\text{d}t}}\right|_{irr}+{\displaystyle \frac{\unicode[STIX]{x2202}S}{\unicode[STIX]{x2202}\boldsymbol{v}_{i}^{\unicode[STIX]{x1D707}}}}\left.{\displaystyle \frac{\text{d}\boldsymbol{v}_{i}^{\unicode[STIX]{x1D707}}}{\text{d}t}}\right|_{irr}+{\displaystyle \frac{\unicode[STIX]{x2202}S}{\unicode[STIX]{x2202}E_{i}}}\left.{\displaystyle \frac{\text{d}E_{i}}{\text{d}t}}\right|_{irr}+{\displaystyle \frac{\unicode[STIX]{x2202}S}{\unicode[STIX]{x2202}\boldsymbol{c}_{i}^{\unicode[STIX]{x1D707}\unicode[STIX]{x1D708}}}}\left.{\displaystyle \frac{\text{d}\boldsymbol{c}_{i}^{\unicode[STIX]{x1D707}\unicode[STIX]{x1D708}}}{\text{d}t}}\right|_{irr}\right]\nonumber\\ \displaystyle & = & \displaystyle \mathop{\sum }_{i}[{\dot{S}}_{i}^{visc}+{\dot{S}}_{i}^{elast}],\end{eqnarray}$$
where the Greek indices refer to tensorial components and the following contributions have been introduced:
 $$\begin{eqnarray}\left.\begin{array}{@{}c@{}}\displaystyle {\dot{S}}_{i}^{visc}={\displaystyle \frac{1}{T_{i}}}\left.{\displaystyle \frac{\text{d}E_{i}}{\text{d}t}}\right|_{irr},\\ \displaystyle {\dot{S}}_{i}^{elast}={\displaystyle \frac{\unicode[STIX]{x1D748}_{i}^{\unicode[STIX]{x1D707}\unicode[STIX]{x1D708}}}{T_{i}}}\left.{\displaystyle \frac{\text{d}\boldsymbol{c}_{i}^{\unicode[STIX]{x1D707}\unicode[STIX]{x1D708}}}{\text{d}t}}\right|_{irr}.\end{array}\right\}\end{eqnarray}$$
Sums over repeated Greek indices are implied.
By using the irreversible motion given in equation (48) of Vázquez-Quesada et al. (Reference Vázquez-Quesada, Ellero and Español2009) we have
 $$\begin{eqnarray}\displaystyle \left.\begin{array}{@{}c@{}}\displaystyle {\dot{S}}_{i}^{visc}={\displaystyle \frac{1}{T_{i}}}(D+2)\unicode[STIX]{x1D702}_{s}\mathop{\sum }_{j}{\displaystyle \frac{-W_{ij}^{\prime }}{d_{i}d_{j}}}(\boldsymbol{v}_{ij}\boldsymbol{\cdot }\boldsymbol{e}_{ij})^{2},\\ \displaystyle {\dot{S}}_{i}^{elast}={\displaystyle \frac{2}{k_{B}N_{p}T_{i}^{2}\unicode[STIX]{x1D706}}}\unicode[STIX]{x1D748}_{i}^{\unicode[STIX]{x1D707}\unicode[STIX]{x1D708}}\boldsymbol{c}_{i}^{\unicode[STIX]{x1D708}\unicode[STIX]{x1D708}^{\prime }}\unicode[STIX]{x1D748}_{i}^{\unicode[STIX]{x1D708}^{\prime }\unicode[STIX]{x1D707}}.\end{array}\right\} & & \displaystyle\end{eqnarray}$$
The first contribution
 ${\dot{S}}_{i}^{visc}$
describes the dissipation that takes place in the solvent. The second contribution
 ${\dot{S}}_{i}^{elast}$
describes the dissipation due to the relaxation of the polymer conformation. Note that these are local quantities defined per particle.
If colloids are present and an irreversible interaction between colloid and viscoelastic matrix is used, a further contribution enters that will take into account the dissipation due to this interaction.
For the model
 $$\begin{eqnarray}\unicode[STIX]{x1D748}={\displaystyle \frac{N^{p}}{2}}k_{B}T[\boldsymbol{c}^{-1}-\mathbf{1}],\end{eqnarray}$$
the elastic entropy production is given by
 $$\begin{eqnarray}\displaystyle {\dot{S}}_{i}^{elast} & = & \displaystyle {\displaystyle \frac{N^{p}k_{B}}{2\unicode[STIX]{x1D706}}}\text{Tr}([\boldsymbol{c}_{i}^{-1}-\mathbf{1}]\boldsymbol{c}_{i}[\boldsymbol{c}_{i}^{-1}-\mathbf{1}])\nonumber\\ \displaystyle & = & \displaystyle {\displaystyle \frac{N^{p}k_{B}}{2\unicode[STIX]{x1D706}}}[\text{Tr}[\boldsymbol{c}_{i}]+\text{Tr}[\boldsymbol{c}_{i}^{-1}]-6].\end{eqnarray}$$
The viscoelastic dissipation function is defined as
 $$\begin{eqnarray}\displaystyle \unicode[STIX]{x1D703}_{i}^{elast}=d_{i}T_{i}{\dot{S}}_{i}^{elast}={\displaystyle \frac{\unicode[STIX]{x1D702}_{p}}{2\unicode[STIX]{x1D706}^{2}}}[\text{Tr}[\boldsymbol{c}_{i}]+\text{Tr}[\boldsymbol{c}_{i}^{-1}]-6]. & & \displaystyle\end{eqnarray}$$