I. Introduction
Ecolabels are part of a new wave of environmental policy that emphasizes information disclosure as a tool to induce environmentally conscious behavior by both firms and consumers. The goal of ecolabels is to provide easily understood information and thereby elicit increased demand for products perceived as environmentally friendly. An important concern among consumers is that ecolabeled products might entail a trade-off between product quality and environmental impact. In other words, in order to achieve low environmental impact, green products would have to be of lower quality. In this study, we use the case of ecocertification in the wine industry to test the link between environmentally friendly production and product quality.
The growing demand for environmentally sustainable products has created a boom in the field of green products. For instance, sales of organic foods in the U.S. increased from $13.3 billion in 2005 to an estimated $34.8 billion in 2014.Footnote 1 The wine industry is no exception: the number of ecocertified Californian wine operations in our data increased from 10 in 1998 to 57 in 2009. However, little consensus exists as to whether ecocertified wines are actually better than their conventional counterparts, making winemakers hesitant to seek certification. Although the literature shows that ecocertified (though not ecolabeled) wines command a price premium over traditional wines,Footnote 2 no attempt has been made to test whether they are actually of higher quality (Delmas and Grant, Reference Delmas and Grant2014). This study seeks to answer the question, is ecocertification associated with quality? The wine market is especially suited to an investigation of the connection between ecocertification and quality; unlike many products of agriculture, wine is a highly differentiated good for which quality ratings are published monthly. This allows us to control for a broad range of characteristics such as vintage, varietal, and region in order to isolate the effect of ecocertification on quality. We use data from three leading wine-rating publications (the Wine Advocate [WA], Wine Spectator [WS], and Wine Enthusiast [WE]) to assess quality of 74,148 wines produced in California between 1998 and 2009. Scores are important as they can influence the price of wines. For instance, research (e.g., Cardebat, Figuet, and Paroissien, Reference Cardebat, Figuet and Paroissien2014; Masset, Weisskopf, and Cossutta, Reference Masset, Weisskopf and Cossutta2015) has found that higher expert scores have a significant impact on wine prices, and, in a meta-analysis, Oczkowski and Doucouliagos (Reference Oczkowski and Doucouliagos2015) found a positive correlation of 0.30 between score and price. Recent research indicates a moderately high level of consensus among these wine publications (Stuen, Miller, and Stone, Reference Stuen, Miller and Stone2015). In addition, we use data on two types of ecocertification, organic and biodynamic. We obtain ecocertification information from California Certified Organic Farmers and Demeter Association.
Our results indicate that the adoption of wine ecocertification has a statistically significant and positive effect on wine ratings. These results are interesting because they contradict the general sentiment that ecolabeled wines are of lower quality—the reason that two-thirds of California wineries that adopt ecocertification do not put the ecolabel on their bottles (Delmas and Grant, Reference Delmas and Grant2014). This contradiction could indicate a failure of the current ecolabel to effectively convey the quality of ecocertified wines.
The article proceeds as follows: In the next section, we discuss the literature relating to ecocertification and quality in wine and in other goods. After that, we discuss our methodology and data set, and in the following section, we present our results. Finally, we conclude the article with a discussion and proposals for future research.
II. Literature Review
Green products are credence goods; consumers cannot ascertain their environmental qualities during purchase or use. Customers are not present during the production process and therefore cannot observe environmental friendliness of production. The objective of ecolabels is to reduce information asymmetry between the producer of green products and consumers by providing credible information related to the environmental attributes of the product and to signal that the product is superior in this regard to a nonlabeled product (Crespi and Marette, Reference Crespi, Marette, Krarup and Russell2005). The implicit goal of ecolabels is to prompt informed purchasing choices by environmentally responsible consumers (Leire and Thidell, Reference Leire and Thidell2005, p. 1062).
Green products have been described as “impure public goods” because they yield both public and private benefits (Cornes and Sandler, Reference Cornes and Sandler1996; Ferraro, Uchida, and Conrad, Reference Ferraro, Uchida and Conrad2005; Kotchen, Reference Kotchen2006). Altruistic consumers, who care about the environment, may receive a good feeling or “warm glow” from engaging in environmentally friendly activities that contribute to this public good (Andreoni, Reference Andreoni1990). Such warm-glow altruism has been shown to be a significant motivator of ecoconsumption among environmentally minded consumers (Clarke, Kotchen, and Moore, Reference Clarke, Kotchen and Moore2003; Kahn and Vaughn, Reference Kahn and Vaughn2009; Kotchen and Moore, Reference Kotchen and Moore2007), with green consumption acting as a substitute for donations to environmental organization (Kotchen, Reference Kotchen2005). On the private good aspect of the green product, consumers care about the quality of the product. Green products may offer quality advantages over their brown counterparts such as increased health benefits (Loureiro, McCluskey, and Mittelhammer, Reference Loureiro, McCluskey and Mittelhammer2001; Miles and Frewer, Reference Miles and Frewer2001; Yridoe, Bonti-Ankomah, and Martin, Reference Yridoe, Bonti-Ankomah and Martin2005), but they may also suffer from production problems such as archaic production and farming techniques that result in poorer quality (Galarraga Gallastegui, Reference Galarraga Gallastegui2002; Peattie and Crane, Reference Peattie and Crane2005).
The empirical literature on the effectiveness of ecolabels has identified changes in consumer awareness after exposure to the label (Leire and Thidell, Reference Leire and Thidell2005; Loureiro and Lotade, Reference Loureiro and Lotade2005) and consumer inclination to change their purchasing behavior in favor of ecolabeled products (Blamey et al., Reference Blamey, Bennett, Louviere, Morrison and Rolfe2000; Loureiro, Reference Loureiro2003). The literature has examined many different products, such as paper products (Brouhle and Khanna, Reference Brouhle and Khanna2012), dolphin-safe tuna (Teisl, Roe, and Hicks, Reference Teisl, Roe and Hicks2002), wine (Corsi and Strøm, Reference Corsi and Strøm2013), genetically modified food (Roe and Teisl, Reference Roe and Teisl2007), apparel (Nimon and Beghin, Reference Nimon and Beghin1999), and green electricity (Teisl, Roe, and Levy, Reference Teisl, Roe and Levy1999), and has used either observed consumer behavior (e.g., Brouhle and Khanna, Reference Brouhle and Khanna2012) or choice experiments (e.g., Teisl, Roe, and Levy, Reference Teisl, Roe and Levy1999). This literature focuses mostly on consumer responses to ecolabels with little mention of the potential benefits associated with the certification process that are independent from the ecolabel. Such benefits, however, have been highlighted by another strand of literature, rooted in management and policy, which describes potential efficiencies gained from ecocertification or the codified adoption of sustainable practices (Delmas, Reference Delmas2001; Prakash and Potoski, Reference Prakash and Potoski2006). This article brings these two strands of literature together through a better understanding of the effectiveness of ecolabeling strategies and their effect on quality.
A. Ecocertification in the Wine Industry
In the U.S. wine industry, there are several competing ecolabels related to organic certification and biodynamic certification. Organic certification follows the U.S. National Organic Standards, which defines a farming method prohibiting the use of additives or alterations to the natural seed, plant, or animal, including, but not limited to, pesticides, chemicals, or genetic modification.Footnote 3 Additionally, labeling standards were created based on the percentage of organic ingredients in the product: products labeled “organic” must consist of at least 95% organically produced ingredients and may display the U.S. Department of Agriculture's (USDA) organic seal; products labeled “made with organic ingredients” must contain at least 70% organic ingredients. For wine specifically, there are two possible organic labels: “organic” wine and wine “made from organic grapes.” Both types use organic grapes and are overseen by a USDA-accredited certifier. However, only naturally occurring sulfites (less than 10 parts per million) are allowed in organic wine; sulfites can be added, up to 100 parts per million, to wine made from organic grapes.Footnote 4 As sulfites help preserve wine, stabilize the flavor, and remove unusual odors, wines made without adding sulfites may be of lower quality (Waterhouse, Reference Waterhouse2016).
Biodynamic agriculture is a method made popular by Austrian scientist and philosopher Rudolf Steiner in the early 1920s. Often compared to organic agriculture, biodynamic farming is different in a few ways. Biodynamic farming prohibits synthetic pesticides and fertilizers in the same manner as certified organic farming. However, although organic farming methods focus on eliminating pesticides, growth hormones, and other additives for the benefit of human health, biodynamic farming emphasizes creating a self-sufficient and healthy ecosystem. In 1928, the Demeter Association was founded in Europe to support and promote biodynamic agriculture. The U.S. Demeter Association certified its first biodynamic farm in 1982.Footnote 5 In addition to the vineyard agricultural requirements, Demeter provides a separate set of wine-making standards for biodynamic wine. For the purposes of this article, we consider biodynamic wine, organic wine, and wine made from organic grapes to be ecocertified wine.Footnote 6
III. Hypotheses
Although many consumers presume that organic foods taste better and provide greater health benefits than their conventionally grown counterparts (Huang, Reference Huang1991; Huang and Lin, Reference Huang and Lin2007; Jolly and Norris, Reference Jolly and Norris1991), this is not the case with ecocertified wine. Although the health benefits of wine consumption are touted in recent dietary and medical studies, the research has not made the link of added personal benefits due to environmental practices. For example, a recent study by Garaguso and Nardini (Reference Garaguso and Nardini2015) indicate that organic red wines produced without addition of sulfur dioxide/sulfites are comparable to conventional red wines with regard to the total polyphenol and flavonoid content, the phenolic profile, and the antioxidant activity.
Results from a survey showed that perceptions of the quality of organic and biodynamic wines varied greatly according to the familiarity of the respondents with those wines. Among the respondents who had tasted organic wine, 55% had a positive to very positive opinion of the quality of the wine. Among the respondents who had not tasted organic wine, only 31% had a positive opinion of the quality of organic wine (Delmas and Lessem, Reference Delmas and Lessem2015). In a discrete choice experiment, Loose and Remaud (Reference Loose and Remaud2013) found that consumers were willing to pay an average premium of 1.24 euros for organic wines. They found that consumers valued the organic claim more than the other social responsibility and environmental claims; however, they did not examine whether it was due to the perception of organic wine quality. In another discrete choice experiment, Delmas and Lessem (Reference Delmas and Lessem2015) found that consumers preferred ecolabeled wines over identical conventional counterparts when the price was lower, which might mean that consumers interpreted the labeling as a sign of lower quality.
Because of the lack of clarity on the value added by wine ecolabels, some wineries currently follow organic and biodynamic practices without being certified. Others become certified but do not provide the information on their bottle label (Delmas and Grant, Reference Delmas and Grant2014; Rauber, Reference Rauber2006). One reason is that growers want to have the flexibility to change their inputs if it becomes necessary to save a crop during bad weather conditions or pests (Veldstra, Alexander, and Marshall, Reference Veldstra, Alexander and Marshall2014). The other reason is that most of these wineries think that there is a negative image associated with organic wine.
For example, a 2006 article by Paul Gleason in the Environmental Magazine includes an interview with winemaker Tony Coturri of Coturri Winery. Although his vineyards are certified organic, meaning no chemicals are used in the wine-making process, he does not include the word organic on his winery's labels. He states, “In all honesty, wine consumers have not embraced quality and organic in the same line yet. They still have the attitude that organic wine is a lower quality than what you can get in a conventional wine. It's a stigma.”Footnote 7
If ecocertification has an unclear value for consumers, why would wineries pursue it? Both organic and biodynamic agriculture are more labor intensive than conventional farming methods because they require more attention to details. Cost studies suggest that switching from a conventional to an organic-certified winery can add 10% to 15% in cost for the first 3 to 4 years (Weber, Klonsky, and De Moura, Reference Weber, Klonsky and De Moura2005). Can wineries still obtain a price premium if customers do not value ecocertification? What would be the mechanism that could lead to a price premium related to certification independently from the ecolabel? We hypothesize that ecocertification is associated with an increase in the quality of the wine.
This is consistent with winemakers' claims that the adoption of green practices is a way to increase the quality of their wines. For example, winemaker John Williams, owner of Frog's Leap Winery in Napa Valley, was interviewed in a recent article by Jeff Cox in Rodale's Organic Life. Williams says he pursues certification to produce better wines. He elaborates, “Organic growing is the only path of grape growing that leads to optimum quality and expression of the land. That's for the same reasons that a healthy diet and lifestyle make for healthy people. When the soil is healthy, the vines are healthy.”Footnote 8
One possible reason is that conventional practices reduce soil microbes. Recent research found the same species of microbes in the soil and the grapevine, suggesting that the soil serves as a reservoir for the microbes in the grapevine, and that these microbes might play a role in the terroir of the wine (Zarraonaindia et al., Reference Zarraonaindia, Owens, Weisenhorn, West, Hampton-Marcell, Lax and Bokulich2015). A second possible reason, found with biodynamic practices, is that biodynamic preparations may affect the wine grape canopy and chemistry (Reeve et al., Reference Reeve, Carpenter-Boggs, Reganold, York, McGourty and McCloskey2005). A third possible reason is that organic and biodynamic practices are associated with a reduction in yield through pruning and thinning, which could explain a rise in quality. This is because an individual vine can better ripen a smaller volume of fruit (Jackson and Lombard, Reference Jackson and Lombard1993).
A survey conducted at the University of California, Los Angeles confirmed this anecdotal evidence (Delmas and Gergaud, Reference Delmas and Gergaud2014). In this survey, owners and managers of California wineries were asked to provide their top motivation for adopting sustainable certification practices. The list included the following motivations: provide a clean environment for future generations, improved quality of quality of grapes/wines, long-term viability of business, maintain soil quality, growing consumer demand, increased demand from restaurants and retailers, improved community relations, improved relations with regulatory agencies, wide local adoption, diversification of product offerings, increased export potential, and association with top industry performers. As expected, “improved quality of grapes/wines” was chosen as the top motivation for 25% of the 346 respondents. This rationale was more frequent among those who had actually adopted certification, with 28% for certified wineries against 24% for wineries that produce conventional wine. Motivations related to consumer demand for sustainable practices or stakeholder relations were far behind. The only motivation that was chosen first by a higher number of respondents was “provide a clean environment for future generations,” which represents the ultimate goal of certification. This motivation represents the public good objective of the certification rather than the business objective of certification.
In conclusion, because of the potential increase in wine quality associated with certification, we hypothesize the following:
H1: Ecocertified wines are of higher quality than conventional wines.
IV. Method
To determine the quality effect of ecocertified wines, we study 74,148 wines from California that have vintages ranging from 1998 to 2009, from 3,842 wineries. California accounts for an estimated nine-tenths of U.S. wine production, making more than 276 million cases annually.Footnote 9
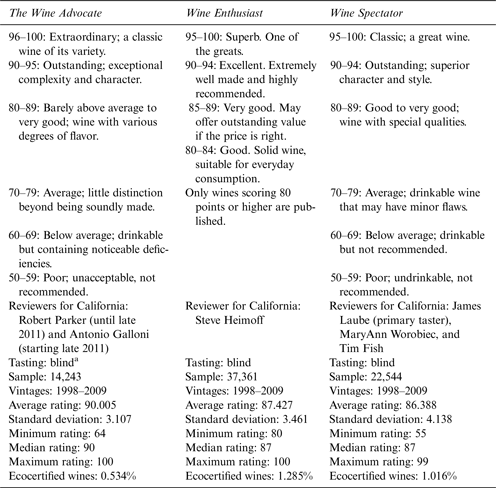
To avoid relying too heavily on any one expert's taste, we gather data from three influential publications by wine experts: WA, WE, and WS. WA is a bimonthly wine publication featuring the advice of wine critic Robert M. Parker, Jr. WE is a lifestyle publication that was founded in 1988 by Adam and Sybil Strum and covers wine, food, spirits, travel, and entertaining. WS is a lifestyle magazine that focuses on wine and wine culture. During our period of study, the main tasters for California wines for WA, WE, and WS were Robert Parker, Steve Heimoff, and James Laube, respectively. Information on each publication rating system is provided in Table 1. All the publications claim blind review.
Rating Systems and Sample Characteristics

Note: a There are exceptions to this policy with respect to (1) all barrel tastings, (2) all specific appellation tastings where at least 25 of the best estates will not submit samples for group tastings, and (3) for all wines under $25.
Source: Wine.com (http://www.wine.com/v6/aboutwine/wineratings.aspx?state=CA).
Each wine review provides information regarding the wine's winery, vintage, appellation, and varietal, and most also provide information on the price of the wine and the number of cases produced. Each review also contains a score, a short description of the wine, and the review date.
A. Dependent Variables
Our dependent variable is wine quality, as measured by the score the reviewer assigned the wine. All three publications perform blind tastings, and ratings are based on a 100-point scale. Table 1 provides more details regarding the ranges and their meanings. Generally, wines scoring 90 or above are considered some of the best, described as “extraordinary,” “outstanding,” “superb,” “excellent,” or “classic.” Wines between 80 and 89 tend to range between above average and very good. WE does not publish reviews of wines that score below 80. For the other two publications, wines with scores of 70 to 79 are generally considered average, those with scores between 60 and 69 are considered below average, and those with scores between 50 and 59 are considered poor. The mean rating for each publication is between 86 and 90 points, and the standard deviation is between 3 and 4 points.
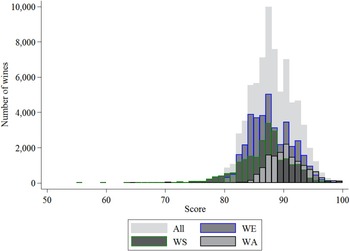
Figure 1 shows the distribution of the scores. Interestingly, there seems to be a “rounding up” effect in which scores of 89 (which are in the very good category) are rounded up to 90 (the excellent category). There are fewer wines scored at 89 points (5,153 wines) than there are at 88 (7,584 wines) and at 90 (6,989 wines). This seems to be largely a result of WE's scoring and, to a lesser extent, WS's scoring.Footnote 10
Histogram of Scores

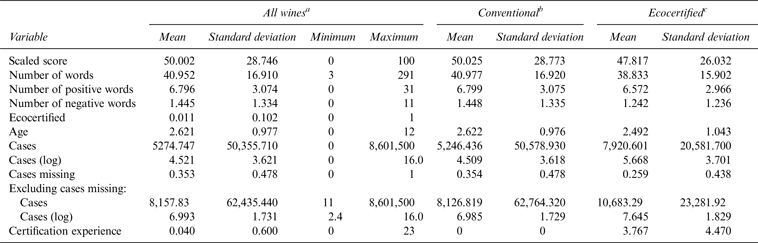
Although there are similarities in the scores, the differences are stark. For instance, the publications have different mean, median, minimum, and maximum scores as shown in Table 2. Thus, we scale the scores using a method adapted from Cardebat and Paroissien (Reference Cardebat and Paroissien2015). We convert the raw scores to a percentile value for each of the publications.Footnote 11 The summary statistics for these scaled scores are show in Table 2. As the table shows, the mean scaled score for all three publications is 50.0 and the standard deviation is approximately 28.7. The correlation between the raw score and scaled score is 0.912. Table 3 shows some summary statistics: the average scaled score for conventional wines is 50.0, and the average score for ecocertified wines is 47.8.
Summary Statistics of Scaled Scores

Note: WA, Wine Advocate; WE, Wine Enthusiast; WS, Wine Spectator.
Summary Statistics

Notes: a N = 74,148 (61,115 for words variables). b N = 73,363 (60,407 for words variables). c N = 785 (708 for words variables).
We also examine the impact of ecocertification on the number of words in the wine notes that reviewers write. For this, we drop all wines with no notes, leaving us with 61,115 observations, as shown in Table 3. The average number of words in a wine note is 41.0. As an additional check on whether ecocertification provides better quality, we also count the number of words that describe the wines positively and negatively in each wine note.Footnote 12 On average, there are 6.8 positive words and 1.4 negative words in each wine note.
B. Independent Variable
The ecocertified variable, which indicates whether the wine is ecocertified, is of primary interest to our research. There are two main ways we code an observation as ecocertified. First, the winery has certified organic vines. We match our wine list to data of organically certified vineyards and year of certification as provided by the certifier California Certified Organic Farmers. Second, the winery follows biodynamic practices certified by and listed with Demeter Certification Services. Finally, a winery purchases grapes from one of the two preceding sources. Thus, we consider both biodynamic wines and wines made from organic grapes as ecocertified.Footnote 13
We merge the ecocertification data with the wine review data based on the name of the wine operation. We code ecocertification as a dummy variable that equals 1 if the operation is ecocertified and 0 otherwise. On average, 1.1% of the wines in the sample are ecocertified. This small percentage is consistent with California organic wine grape production, which accounts for less than 2% of California's 550,000 total wine grape–growing acres.Footnote 14 As Table 1 shows, WE has the highest percentage of ecocertified wines.
Endogeneity is a possible problem. The most likely issue is that wineries do not get ecocertified at random. Better wineries that produce higher scoring wines might be more likely to become ecocertified, and our coefficient might reflect the differences in wineries and produce biased estimates. In order to mitigate this issue, our main model uses winery fixed effects and therefore compares differences within the winery over time, not across wineries.
C. Controls
In order to assess the impact of size on quality, we control for the quantity produced. Unfortunately, information on how many cases were produced was missing for 35.3% of our observations. To preserve the number of observations, we created a dummy variable for observations that had missing information on number of cases and replaced missing case values with 0. This is equivalent to having a separate intercept for the observations that have missing values for number of cases. We explore a different way of dealing with missing values later in the article. Whether the number of cases is reported depends on the publication: WA has the highest proportion of missing cases (0.88), followed by WE (0.35) and then WS (0.02).
For the full sample (including those with missing case information), the mean number of cases is 5,275, as shown in Table 3. The maximum is more than 8.6 million, and the standard deviation is approximately 50,000, indicating a skewed distribution. To account for that, we use the natural log of cases; if the number of cases is missing we enter that value as 0. The mean of that value is 4.5, with a standard deviation of 3.6. Excluding those with missing values for cases, the mean of the log value is approximately 7.0, and the standard deviation is 1.7.
Finally, to control for the vineyard's experience with ecocertification practices, we include a variable representing the length of certification experience, calculated as the vintage minus the first year the operation was certified. The mean of this is 0.040, a very low number as very few operations are certified.
We include information about varietals.Footnote 15 Pinot Noir is the most common varietal, accounting for 16.82% of our sample. This is followed by Cabernet Sauvignon (16.50%) and Chardonnay (15.18%). The average scaled scores across varietals are quite different, with a high of 69.69 for sparkling wine and a low of 33.46 for Pinot Gris/Grigio.
We also control for the impact of soil specificities and weather using region-vintage dummy variables. To get regions, we use the American Viticultural Areas from which the wine originates.Footnote 16 Wine from Napa Valley is the most common (accounting for 28.62% of our sample) and also the highest rated (with a mean scaled score of 58.12). Wine from the central coast of California is the second most common (accounting for 27.81% of the sample) and is the third highest rated (with a mean scaled score of 47.10). Wine from Sonoma is the second-highest rated (with a mean scaled score of 53.63) and the third most common (accounting for 26.61% of our sample).
Our region-vintage dummy variables control for quality differences that would arise from varying weather conditions. As shown by Ashenfelter (Reference Ashenfelter2008), Ashenfelter and Storchmann (Reference Ashenfelter and Storchmann2010), and Ashenfelter, Ashmore, and Lalande (Reference Ashenfelter, Ashmore and Lalonde1995), weather is an important determinant of wine quality. This is true even for wines from grapes grown in California, which is reputed to have stable weather over time (Ramirez, Reference Ramirez2008), especially when compared with other regions like Bordeaux in which weather conditions can vary substantially from year to year (Ashenfelter, Reference Ashenfelter2008; Lecocq and Visser, Reference Lecocq and Visser2006). Region-vintage dummy variables better control for weather than region and vintage as separate sets of variables because they are more flexible as they allow a region's weather to vary across time. These region-vintage dummy variables also control for general trends in the wine industry over time, such as improvements in knowledge or technology.
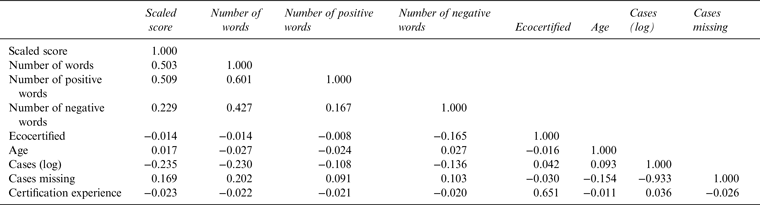
We also control for the age of the wine at the time it is reviewed, calculated as the vintage subtracted from the year the wine was reviewed. As shown in Table 3, the mean age is 2.6 years. The correlation matrix of the main variables is shown in Table 4.
Correlation Matrix

V. Model and Estimation Strategy
We estimate our regression equation using the fixed-effects model:
 $$Quality_{iwrt} = \beta \times Ecocertified_{wt} + \alpha _w + \gamma X_{iwrt} + \delta _{rt} + \varepsilon _{iwrt}\comma$$
where Quality iwrt is the score of wine i from winery w in region r of vintage t. As an additional measure of quality, we study the wine notes and measure the number of words, including the number of positive and number of negative words, the reviewer used in the wine note. We also examine the probability that the reviewer used a specific word in the wine note using a linear probability model.Footnote 17 Ecocertified wt is a dummy variable for whether winery w was ecocertified during vintage year t. Winery fixed effects are captured by α w , which accounts for time-invariant winery characteristics such as winery management structure. X iwrt captures other controls of the wine: the age of the wine, the number of cases produced, the varietal, publication dummy variables, and certification experience. The term δ rt consists of region-vintage dummy variables to control for regional time-varying differences such as soil quality and weather.
VI. Results
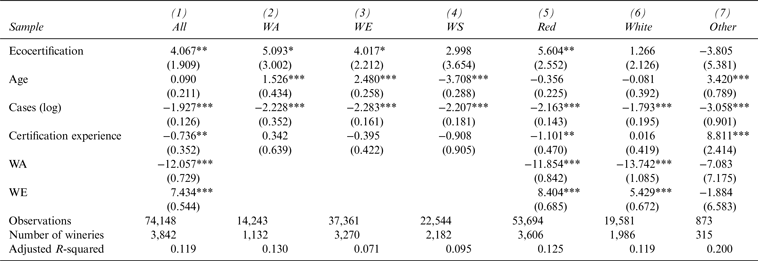
Table 5 shows the regression results. As shown in regression (1), ecocertification has a statistically significant impact on score. Being ecocertified increases the scaled score of the wine by 4.1 points on average. The number of cases produced has a small, negative, and statistically significant impact on score: a 1% increase in the number of cases will decrease the scaled score by 0.019 point.
Fixed Effects Regressions of Scaled Score on Ecocertification

Notes: ***, P < 0.01; **, P < 0.05; *, P < 0.1. Standard errors, robust and clustered by winery, shown in parentheses; varietal, region-vintage, and cases missing dummy variables included but not shown. WA, Wine Advocate; WE, Wine Enthusiast; WS, Wine Spectator.
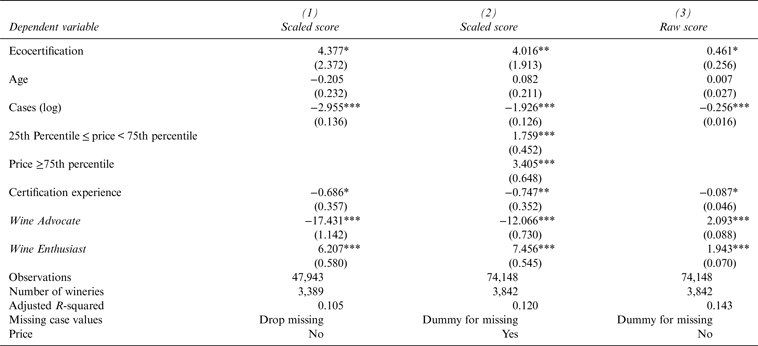
Interestingly, certification experience (which is equal to the vintage minus the first year the winery was certified) has a negative and statistically significant impact on scaled score. This is perhaps because the early adopters of ecocertification were wineries of poorer quality. An increase in the number of years of certification experience by one decreases the scaled score by 0.74 point. On average, WA awards 12.1 fewer points than WS (the omitted group), and WE awards 7.4 points more than WS. This likely indicates that WA is more selective. As a robustness test, we ran a similar regression using the raw scores (instead of scaled scores) and found that ecocertification increased the score (significant at 10%). These results are in column (3) of Table A1 (see Appendix).
It is worth asking whether the preference for ecocertified wine is a quirk of a particular wine publication, or if it is a more uniform recognition of the higher quality of ecocertified wines. Regressions (2), (3), and (4) of Table 5 present results of the regressions when we split the sample by wine-rating publication. As the coefficients show, organic certification increases the scaled score by between 3.0 and 5.1, although the WS coefficient is not statistically significant. This is possibly due to the small number of ecocertified wines. Overall, the positive coefficients suggest agreement among experts that ecocertified wines are of better quality (the difference would range between a minimum of 3 to a maximum of 5 points).
Next, in order to understand whether ecocertification practices have a different impact depending on the type of wine, we divided the observations based on type of wine: red, white, and other (dessert, sparkling, and rosé). Regressions (5), (6), and (7) of Table 5 show the results. The ecocertification coefficient is positive and statistically significant only for the red wines.
In addition, we conducted several robustness tests. First, to mitigate possible endogeneity not controlled for by our fixed-effects model, we used an instrumental variable approach, using the proportion ecocertified 3 years ago and previous-year certification as in instrument for ecocertification. This method yielded similar results as our main model. Results are available from the authors upon request. Second, we followed an alternative approach to deal with missing values for cases by using only observations that have information on number of cases. Doing so reduces our observations by more than a third; the coefficient of ecocertification is still positive and of approximately the same magnitude but is only significant at 10%. These results are shown in column (1) of Table A1 in the Appendix. We also ran the regression without controlling for the number of cases. The results are robust. Third, cost can be an important factor. Although we do not have information on price, we use cost as a proxy for it. More precisely, we calculated the average price of all wines of a specific vintage produced by a winery. In the regression, we included dummy variables to indicate to which quartile of prices wines of the previous year's vintage belonged. The results did not change; these are shown in column (2) of Table A1.
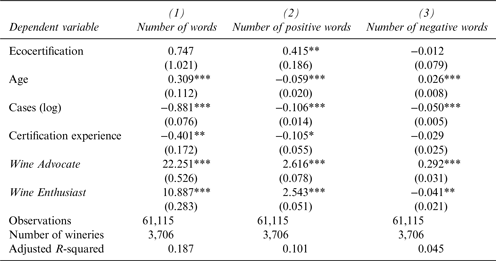
Next, we examine the impact that ecocertification has on the number of words used in wine notes. As shown in regression (1) of Table 6, wine notes of ecocertified wines are not significantly longer than those of conventional wines. However, as shown in regressions (2) and (3), ecocertification increases the average number of positive words by 0.4 but has no statistically significant impact on the number of negative words. Additionally, to account for the nonnegative nature of word and character count, we ran Poisson and negative binomial regressions and found similar results. Results are available from the authors upon request.
Fixed Effects Regressions of Score on the Number of Words in Wine Notes

Notes: ***, P < 0.01; **, P < 0.05; *, P < 0.1. Standard errors, robust and clustered by winery, shown in parentheses; varietal, region-vintage, and cases missing dummy variables included but not shown.
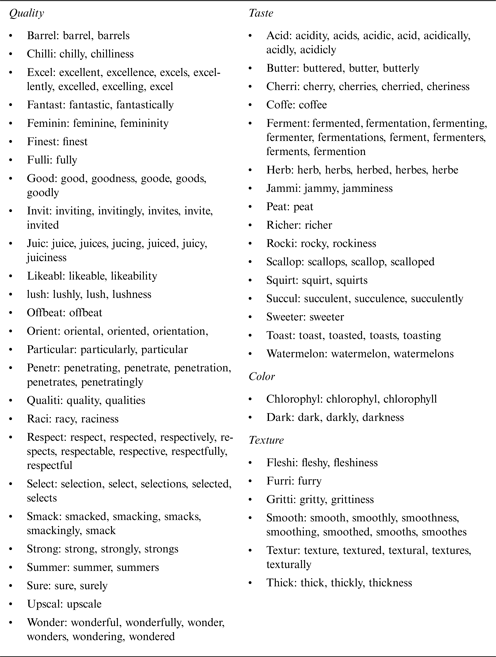
Finally, we examine the qualitative differences between ecocertified and conventional wines by examining the words used in the wine notes. In order to do that, we reduce each word in the wine notes to its root word using a stemming algorithm provided by Snowball.Footnote 18 Next, for each unique root word, we ran a linear probability model for whether the word was used in the wine notes. Our results are presented in Table 7.
Summary of Words with Significant, Positive Coefficients for Ecocertification on Word Use

In Table 7, we show the root words on which ecocertification has a statistically significant and positive impact, dividing them into several categories. For instance, looking at the first few lines in the first column, “barrel,” “chilli,” and “excel” are all root words that describe the quality of wine; ecocertification had a positive and statistically significant impact on the probability that those words were used in the wine notes. Looking at the second line, two words (“chilly” and “chilliness”) reduce to the root word “chilli.” We divide the words into four categories: the quality, taste, color, and texture of the wine.
Interestingly, under taste, we find “acid,” “butter”, “peat,” “ferment,” “richer,” “herb,” and “rocky.” These qualities might resonate with winemakers who say that wines without chemicals can better express the flavors of the terroir. For example, in a 2008 article in Organic Wine Journal, Ron Laughton from Jasper Hill Vineyards, said:
Flavors are created in the vine. The building blocks are the minerals in the soil. If you keep applying synthetic chemicals, you are upsetting the minerals in the soil. So if you wish to express true terroir, you should be trying to keep the soil healthy. Let the minerals that are already there express themselves in the flavor in the vine.
Herbicides upset the balance of the vineyard simply because dead grasses are an essential part of the vineyard floor. Those dying grasses act as food for another species, and they act as food for another species. You go right down the food chain to the organisms that create the minerals for your plant to suck up and create the building blocks for the flavors. Its [sic] not rocket science.Footnote 19
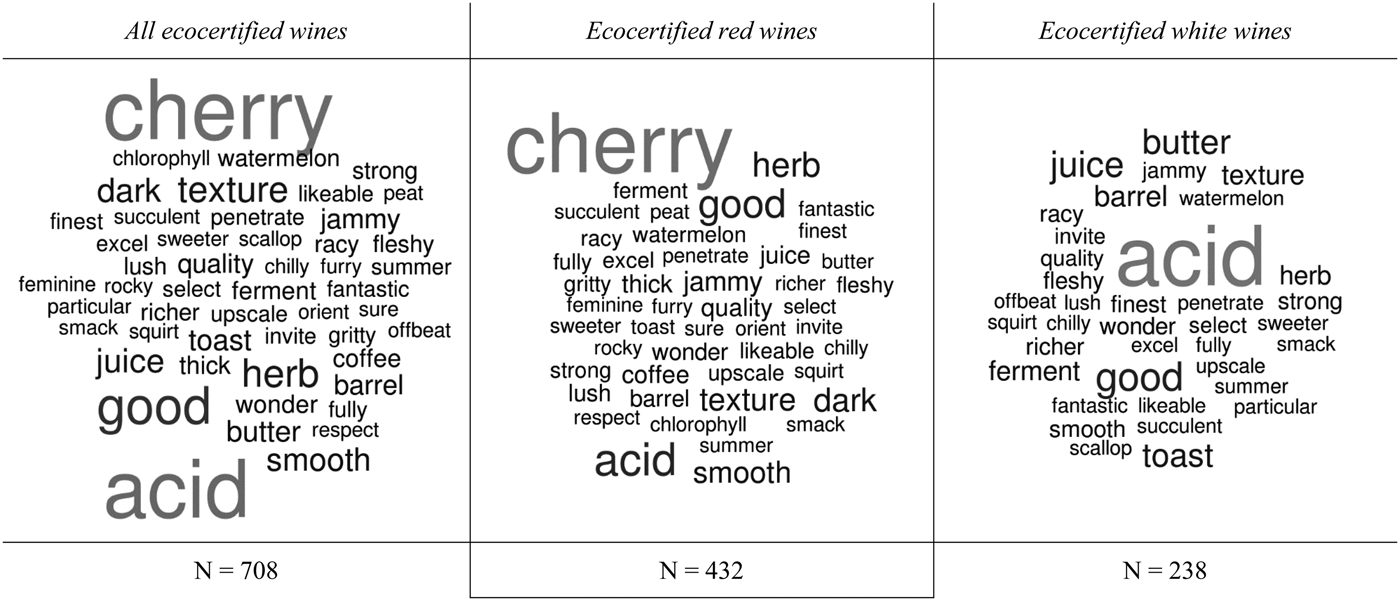
Although Table 7 shows which words are used more frequently in ecocertified wines than conventional wines, it does not show how frequently the words are used. In Figure 2, we show a graphical representation of the frequencies of the word shown in Table 7, by using word clouds, in which the size of the word represents the relative frequency of the word. Looking at the words from reviews of all ecocertified wines, “cherry” and “acid” are the most common word stems. As shown in the figure, “cherry” is the most common among red wines, and “acid” is the most common for white wines. The relative frequency of the words is somewhat different between red and white wines. However, “good” and “herb” are relatively frequent for both types of wine.
Word Clouds Showing the Frequency of Word Use in Reviews of Ecocertified Wines

VII. Discussion and Conclusion
Little consensus exists as to whether ecocertified wines are associated with worse, similar, or better quality than their traditional counterparts. Although some winemakers argue that ecocertification improves wine quality, consumers are uncertain about this association (Delmas and Lessem, Reference Delmas and Lessem2015), and research showed a price increase associated with ecocertification but a discount with wine ecolabeling (Delmas and Grant, Reference Delmas and Grant2014).
In this study, we test the association between wine ecocertification and wine quality as evaluated by wine experts. We use data from three leading wine-rating publications (WA, WE, and WS) to assess quality for 74,148 wines produced in California between 1998 and 2009. Our results indicate that the adoption of wine ecocertification has a significant and positive effect on wine ratings. Note that wine operations might use similar practices as ecocertified operations but choose not to obtain ecocertification. If so, our estimates would understate the impact of such practices.
If ecocertified wine is associated with higher-quality wines, then it is surprising not to see a premium associated with wine ecolabeling. We argue that several reasons could explain this phenomenon.
First, wine experts might not represent accurately wine consumers. Wine experts have much better knowledge about wine processes than most consumers and might even be familiar with the wine practices of specific wineries. If indeed organic certified wineries use superior wine practices and produce higher-quality wine, this should be something known by wine experts. Second, as a related point, wine experts have a better knowledge about wine ecocertification and are able to differentiate between different types of ecolabels, namely organic wine and wine made with organically grown grapes, which represent different wine production processes with different impacts on quality. Indeed within the U.S. wine industry, there are several competing ecolabels related to environmental certification that are still not well recognized and understood by consumers. For example, there are two USDA standards. The first of the USDA standards, “wine made from organically grown grapes,” applies only to the production of the grapes, whereas the second, “organic wine,” has prescriptions for the wine production process too. In particular, organic winemakers are prohibited from using sulfites in the wine-making process. Because sulfites help to preserve the wine, stabilize the flavor, and eliminate unusual odors, wine produced without added sulfites may be of lower quality (Waterhouse, Reference Waterhouse2016). Such quality concerns are most pertinent for red wines, which are usually kept for longer periods before consumption than white wines. This potential quality check does not apply to wine made with organic grapes, to which winemakers may add sulfites in the production process. Third, it is also possible that wine experts have a more favorable view of innovative wine practices and are trendsetters.
Our research is not without limitations. First, we focused on the California wine industry, and it is possible that perceptions about ecocertification vary according to the institutional context in which they are implemented and the specific standards of ecocertification. Further research could expand the analysis to other countries, such as France for example, where less confusion exists around the definition of ecocertified wines. Second, although we were able to gather a comprehensive database of wine ratings from the major wine experts, there is still some uncertainty about the evaluation process and how much the wine experts actually know about the wine before tasting it. Further research could conduct blind wine tasting to better isolate the effect of organic certification. Third, due to the limited number of ecocertified wines, we classified all types of ecocertified wines together. There might be quality differences among the three different types that we do not account for, and future research could investigate such differences.
Our research has important policy implications. An ecocertification premium is essential for an ecoindustry to continue. Thus, any ecocertification initiative needs to ensure that it will deliver such premiums. Focusing purely on information asymmetries will not necessarily create ecolabels that align ecoproducts with the needs of consumers. Instead, certification organizations need to work with producers and marketers to ensure that ecocertified products provide information that clearly communicates their value proposition to consumers, without creating further confusion or additional unintended product signals.
Other industries may be adopting mechanisms that relate ecocertification to an increase in quality. We hypothesize that similar patterns could be at work for other agricultural products such as coffee, because the conditions may be similar to those identified for grape growing. Evidence from Costa Rica suggests that this might be the case (Muschler, Reference Muschler2001). Such patterns could also be present in the construction sector. Studies show that buildings that are constructed according to the Leadership in Energy and Environmental Design green building standard might have higher performance than conventional buildings: they are more durable and more energy efficient (Von Paumgartten, Reference Von Paumgartten2003). The manufacturing sector may also elicit a similar pattern if socially responsible investors use environmental management practices as a proxy for good management (Delmas, Etzion, and Nairn-Birch, Reference Delmas, Etzion and Nairn-Birch2013).
Appendix
Alternative Specifications of Regressions of Scaled Score on Ecocertification