Introduction
The spread of diabetes has been regularly rising over the past few decades [1]. Diabetes is a chronic, metabolic illness characterized by increased levels of blood glucose (or blood sugar). Daily measurements of blood glucose levels are required for diabetic individuals. Usually, checking of blood glucose for diabetic patients consists of several measurements per day [Reference Topsakal, Karacolak and Moreland2], and each time the patient gets pricked with a lancet. The reason for this is that most glucose meters operate based on electrochemical methods, by which a drop of blood must be applied to a test strip [Reference Topsakal, Karacolak and Moreland2]. Repeated invasive blood glucose monitoring causes different health risks to diabetics as a result of possible contamination of measuring equipment. A non-invasive test method would mitigate the daily health risks, burdens, and pains of invasive testing. Several non-invasive methods for blood glucose testing have been studied for more than four decades [Reference Wang3]. The challenges of designing a non-invasive blood glucose sensor include accuracy, ease of use, cost, compactness, and sensitivity to the temperature and variations of physiological parameters [Reference Gonzales, Mobashsher and Abbosh4].
Hofmann et al. [Reference Hofmann, Fersch, Weigel, Fischer and Kissinger5] proposed a glucose-measuring device operating between 5 and 12 GHz based on radio wave transmission [Reference Hofmann, Fersch, Weigel, Fischer and Kissinger5]. High frequencies were used to provide strong radiation in compact aperture size. Also, the dielectric properties of the skin are shown to have a negligible variation with respect to frequency between 1 and 10 GHz [Reference Gabriel, Lau and Gabriel6]. In addition, it was mentioned that the dielectric properties of the skin decrease with higher frequencies [Reference Gabriel, Lau and Gabriel6], which will lead to the main element being the variation in the glucose concentration. However, the sensitivity of the antenna was poor, additionally, sometimes it shows no correlation between the readings.
Another method for glucose measurement depends on the photoplethysmography mechanism, which uses the principle of infrared absorption measurement. A limitation of this sensor type is the need for an additional sensor to detect the pulse rate of the heart [Reference Paul, Manuel and Alex7]. Furthermore, detection of glucose levels can be obtained by measuring changes in conductivity and permittivity of the blood using electrode sensors. However, the design of the interdigital electrode sensor is complicated and very expensive [Reference Abdalla, Al-ameer and Al-Magaishi8]. Another study investigated using a dielectric resonator operating at 1.68 GHz, to detect glucose changes, based on its resonant frequency changes. For this type of sensor, the detection resolution was much lower than that required for human measurements, which is around 5 mg/ml [Reference Kim, Babajanyan, Hovsepyan, Lee and Friedman9]. Resonant cavity setups have been previously developed [Reference Dobson, Wu and Callaghan10, Reference Fan, Deng, Wang and Wang11], and were designed to operate from 2 to 3 GHz. Other studies used antenna sensors with a different range of frequencies, between 1 and 2.5 GHz [Reference Wiwatwithaya, Phasukkit, Tungjitkusolmun and Wongtrairat12], and 5 and 8.5 GHz [Reference Hofmann, Fersch, Weigel, Fischer and Kissinger5]. Additionally, open waveguide structures were used to study the effect of varying glucose levels on the waveguide's scattering parameters (S-parameters) up to 20 GHz [Reference Hofmann, Bloss, Weigel, Fischer and Kissinger13]. Hasan et al. developed a non-invasive cylindrical dielectric resonator to measure the blood glucose level [Reference Hasan, Tamanna, Singh, Nadeem and Rudramuni14]. Nevertheless, the sensitivity of this sensor was relatively low. Another study utilized an implanted SiC antenna into the body [Reference Hasan, Tamanna, Singh, Nadeem and Rudramuni14]. However, an antenna that operates in the X-band was used, which is forbidden for health purposes [Reference Afroz, Thomas, Mumcu and Saddow15].
Several non-invasive techniques were developed for blood glucose measurement, which are based on transmission measurements using microstrip patch antennas at millimeter waves [Reference Saha, Cano-Garcia, Sotiriou, Lipscombe, Gouzouasis, Koutsoupidou, Palikaras, Mackenzie, Reeve, Kosmas and Kallos16]. Two microstrip patch antennas operating at 60 GHz were proposed, the sensitivity reported in this study was low, but that method is promising for realizing glucose monitoring non-invasively in real time.
In this paper, a non-invasive method for glucose level estimation using a defected ground structure (DGS) resonator will be developed both theoretically and experimentally. The microwave sensor is formed by microstrip technology with a defected ground plane and designed as a band-stop filter (BSF). The sensor operation exploits the fact that the power transmission levels between the filter ports depend on the complex permittivity of the material placed between the two ports. The presented sensor is a good candidate for monitoring blood glucose concentration non-invasively for diabetes patients. The paper is organized as follows: in section “Theoretical background,” a detailed discussion about the Cole–Cole model as well as the DGS is presented. Section “Methodology” illustrates the methods used for sensor design and fabrication, in addition to the electromagnetic (EM) simulation model of the blood layer with various glucose concentrations based on the Cole–Cole model. Section “Results and discussion” presents the results of the simulation for various blood glucose concentrations, followed by the two different experimental measurements of the proposed sensor. A conclusion is given for this study in section “Conclusion.”
Theoretical background
In this section, details about the Cole–Cole model that was used to model the change in complex permittivity of the blood with the variation of glucose concentration will be discussed. Besides, the theory about the DGS will be presented.
Cole–Cole model
Several models exist for the EM properties of the human tissue structure, which includes skin, fat, and blood, which were discussed in [Reference Debye17] and [Reference Gabriel, Lau and Gabriel6]. A simplified theoretical analysis, which is valid for an isotropic and homogenous material, is used in the current design [Reference Debye17]. Unlike homogenous dielectric materials, tissues are a mixture of an inhomogenous bio-organic material with different EM properties. The concept is based on the transmitted power through a dielectric and a lossy material, taking into consideration the variations in the glucose level. Hence, complex permittivity must be taken into account. According to Clausius–Mossotti, Debye, and Cole, the complex permittivity (ɛ) of any material can be calculated with respect to molecular parameters. Subsequently, one can denote the permittivity $\hat{\varepsilon }$ in (1) as a function of the angular frequency ω for a concentration χ of the glucose [Reference Gabriel, Lau and Gabriel6]:

where ${\varepsilon }^{\prime}_c( \omega )$ is the frequency-dependent dielectric constant and ${\varepsilon }^{\prime \prime}_c( \omega )$
 is the frequency-dependent dielectric loss. The Cole–Cole model can represent the biological tissues accurately and efficiently, which can reduce the complexity of the experimental data obtained for various human tissues over very wide frequencies [Reference Karacolak, Moreland and Topsakal18]. The complex permittivity $\hat{\varepsilon }( \omega )$
 of the blood is defined as a function of the angular frequency, which is expressed as below [Reference Gabriel, Lau and Gabriel6]:

The value of permittivity which depends on the high frequency is ɛ ∞, while the order of the Cole–Cole model is defined as n. Furthermore, Δɛ n is defined as the dispersion magnitude, τ n is defined as the time constant of relaxation, α n is a parameter for the dispersion broadening, ɛ 0 is the permittivity of the free space, and σ i is defined as the ionic static conductivity.
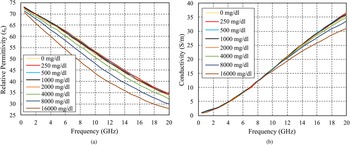
A study conducted at the University of Alabama Birmingham Children's Hospital used a dielectric probe kit with a network analyzer operating from 500 MHz to 20 GHz. The readings were collected from 10 adults, and it was demonstrated a strong correlation between the electrical properties, and the blood glucose concentration which is manipulated in vitro [Reference Karacolak, Moreland and Topsakal18]. The relative permittivity and conductivity were measured in [Reference Karacolak, Moreland and Topsakal18], and it is clearly observed that as the glucose concentrations increase, the dielectric constant and the conductivity decrease, as illustrated in Fig. 1.
Measured (a) dielectric constant and (b) conductivity from 500 MHz to 20 GHz for various glucose levels [Reference Karacolak, Moreland and Topsakal18].

Defected ground structure
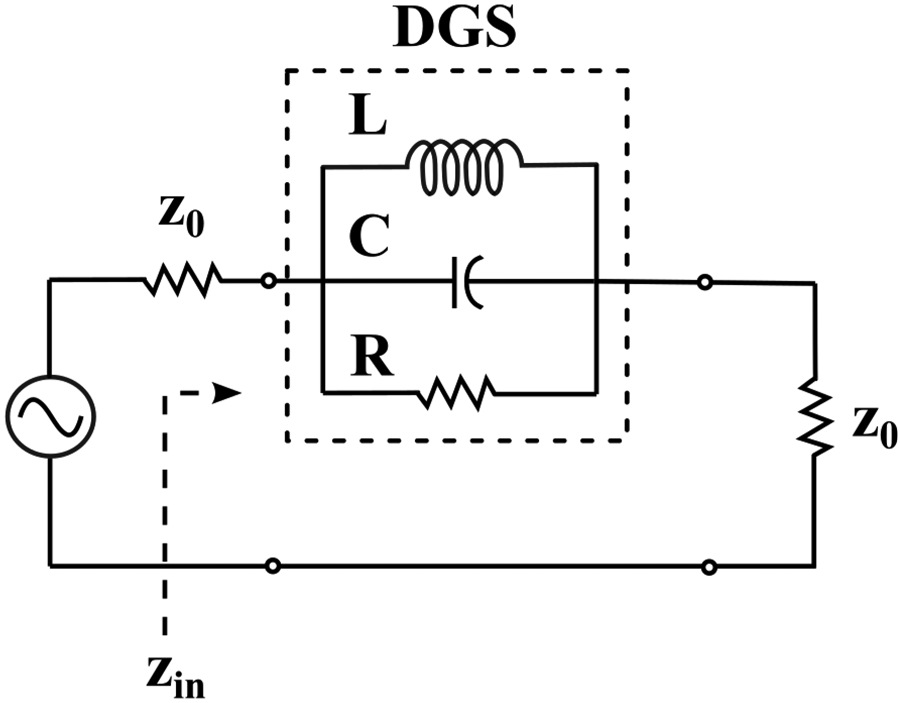
A low-cost non-invasive blood glucose meter is presented by using a compact DGS. Recently, interest has been growing in new concepts which can be applied to quasi-lumped microwave elements that meet the harsh requirements of modern microwave communication devices [Reference Weng, Guo, Shi and Chen19]. A DGS is one of these techniques, where the metal ground plane of a microstrip circuit is modified intentionally to improve the performance [Reference Breed20]. A resonant gap or slot, with different shapes, in the ground plane would affect DGSs, when positioned below a feedline directly, therefore, disturbing the current distribution. These changes in current distribution affect the parameters of the transmission line, for example, the line capacitance and the inductance. A defect that is etched in the ground plane can be designed to increase the effective inductance and capacitance [Reference Weng, Guo, Shi and Chen19]. Several microwave applications have utilized DGSs as quasi-lumped elements to design low-profile filters such as band-pass and BSF for specific applications [Reference Abdel-Rahman, Verma, Boutejdar and Omar21]. The size of these compact structures is significantly small which makes them suitable for applications such as portable electronic appliances and biomedical implants [Reference Hekal, Allam, Abdel-Rahman and Pokharel22]. Several resonant structures were proposed, that differ in area, and their electrical equivalent parameters such as L–C ratio, and coefficient of coupling [Reference Breed20]. The equivalent circuit of a DGS is composed of a parallel-tuned circuit with the transmission line connected in series whereas the values of L, C, and R can be determined by the dimensions of the DGS structure and its location relative to the transmission line as it is demonstrated in Fig. 2.
Equivalent circuit of the DGS.

Methodology
In this section, details about the method used in the design and fabrication of the DGS sensor will be presented. Furthermore, details about the EM modeling and simulation of the sensor and the human tissue using the full-wave EM solver CST Microwave Studio will be discussed.
DGS sensor design
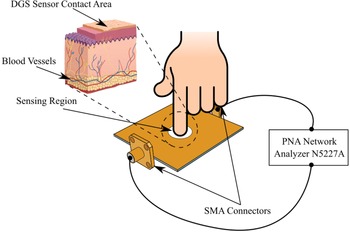
The blood glucose sensor is formed by a microstrip patch with a slot that is etched in the ground plane, which is designed as a BSF. The sensor concept mainly depends on the change in the transmission and reflection coefficients. The BSF is loaded with a lossy dielectric material represented by a finger of the diabetic patient. Blood with a normal glucose level is less conducting than blood with a high glucose concentration. As a result, the magnitude of the filter insertion loss will be affected by the lossy material inserted between the filter ports. This method can then be used as the core of a non-invasive glucometer concept. A clarification for the concept of the DGS sensor for measuring the glucose level non-invasively based on the placement of a fingertip on the sensor is shown in Fig. 3.
Illustration of the general concept of the non-invasive DGS sensor.

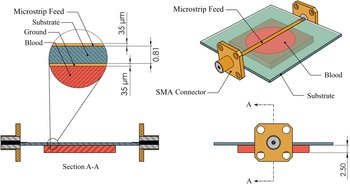
The presented DGS sensor is fed by a 50 Ω microstrip feeding line as shown in Fig. 4. The dimensions of the feeding line were designed using the analytical line impedance calculation tool in CST Microwave Studio. The proposed DGS sensor was designed using a Rogers RO4003C substrate, having a thickness of 0.813 mm, a dielectric constant of 3.38, and a loss tangent of 0.0027. A thickness of copper metal layers, equal to 0.035 mm, is used for both the microstrip line and the ground plane. These dimensions are indicated in the schematic of the DGS sensor shown in Fig. 4.
Schematic diagram and dimensions for the DGS sensors used in the simulation.

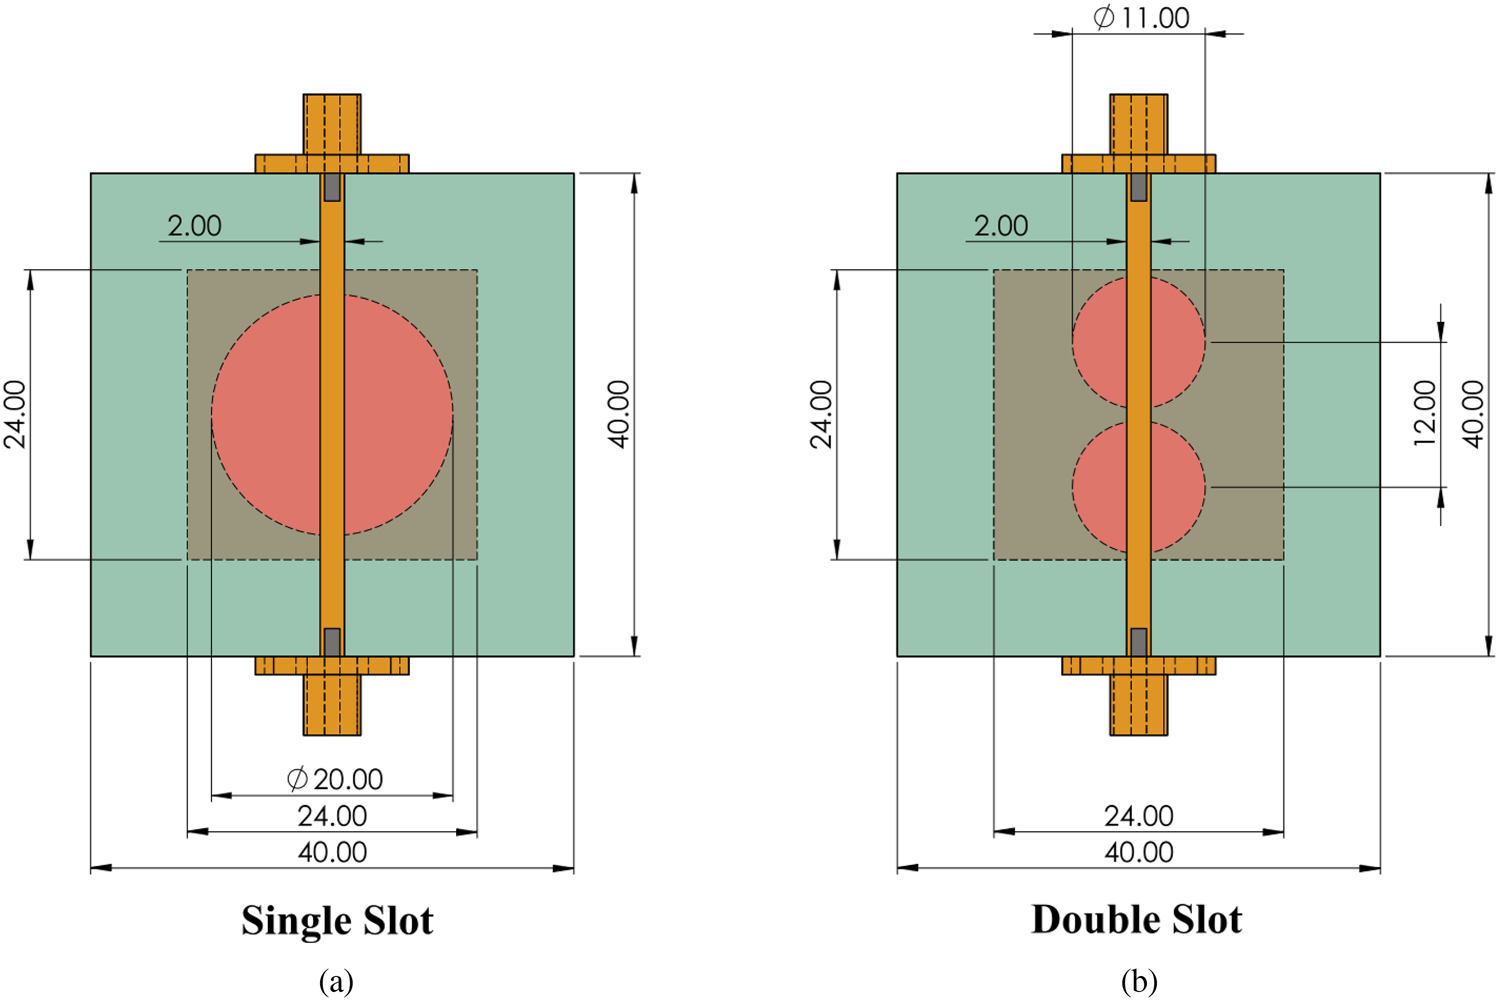
Two different geometries of the DGS are presented to study the effect of changing the complex permittivity of blood as a function of glucose concentration. A comparison is made between the measurement sensitivity of the two structures to the variation of blood glucose levels. The DGS sensor has optimum dimensions of equal width and length of 40 mm. First, a sensor with a single slot on the ground with a diameter of 20 mm is presented as shown in Fig. 5(a). Second, two slots are etched in the ground plane with a diameter of 11 mm and a center distance of 12 mm; the dimensions of this design are illustrated in Fig. 5(b).
Single (a) and double (b) slot design for the DGS layer.

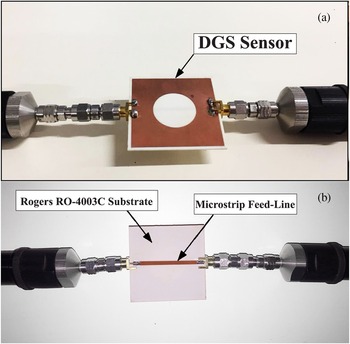
The proposed prototype of the DGS sensor was fabricated using UV lithography. Sub-Miniature Version A (SMA) connectors were soldered to the feeding line and the ground plane. Measurements have been carried out using a Keysight N5227A PNA Microwave Network Analyzer. The fabricated DGS sensor is shown in Fig. 6. The illustrated DGS sensor has a resonance frequency of 2.45 GHz.
DGS sensor prototype: (a) top view of the fabricated prototype, which shows the ground plane with the slot, and (b) microstrip feed-line, used to excite the DGS, shown in the bottom view.

EM modeling of the blood
The Cole–Cole model is used to model the complex permittivity of human blood as a function of glucose concentration and frequency. In order to determine the blood permittivity as a function of glucose concentration, the parameters of the model were initially designed within the range of 0–16 000 mg/dl, which was obtained by collecting blood samples from adults and then manipulating the samples in vitro [Reference Karacolak, Moreland and Topsakal18]. Therefore, the dielectric properties of various glucose concentrations were used to create and validate the model in CST Microwave Studio, and then compare the results of the proposed sensor with another study. The blood sample was set as a single pole (n = 1) “Cole–Cole material” with a dispersion-broadening parameter (α n = 0.1) in CST Microwave Studio for various glucose concentrations ranging from 250 to 16 000 mg/dl [Reference Karacolak, Moreland and Topsakal18].
Results and discussion
Simulation results
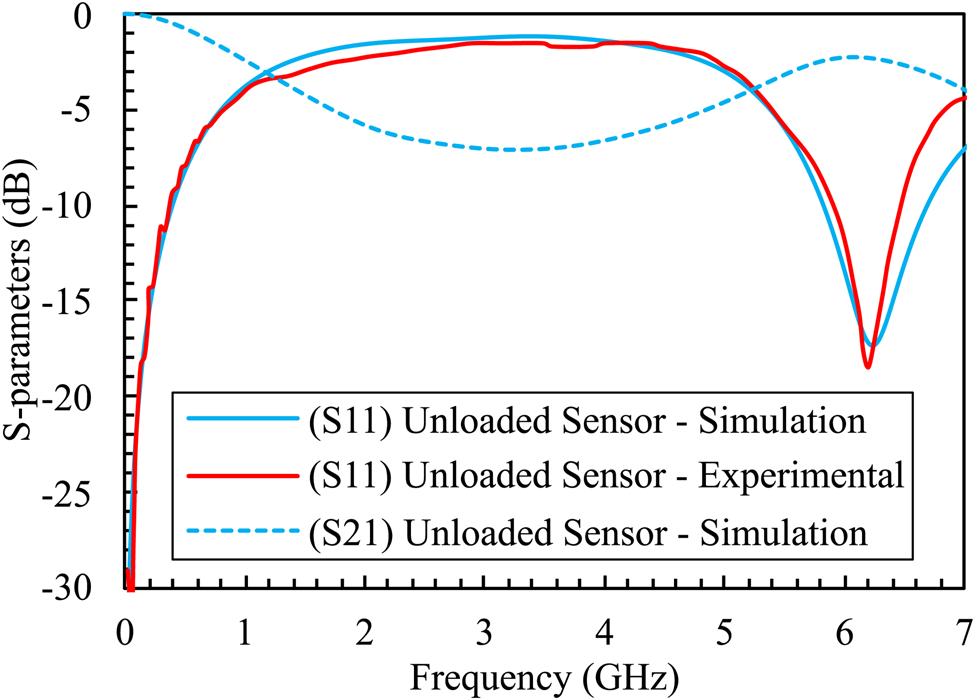
The complex permittivity of blood does not vary significantly with the change in glucose concentration, that is why the changes in the transmission coefficient are not expected to be very notable [Reference Karacolak, Moreland and Topsakal18]. First, to demonstrate the validity of the simulation model, a comparison is made between the obtained results from the fabricated prototype with the results estimated from the simulation. This comparison is conducted using the single-slot structure with a diameter of 20 mm as shown in Fig. 7, for a case without lossy material (unloaded sensor). The difference between experimental and simulated results is negligible.
Experimental versus simulated results of the sensor without a blood sample obtained using the single-slot structure.

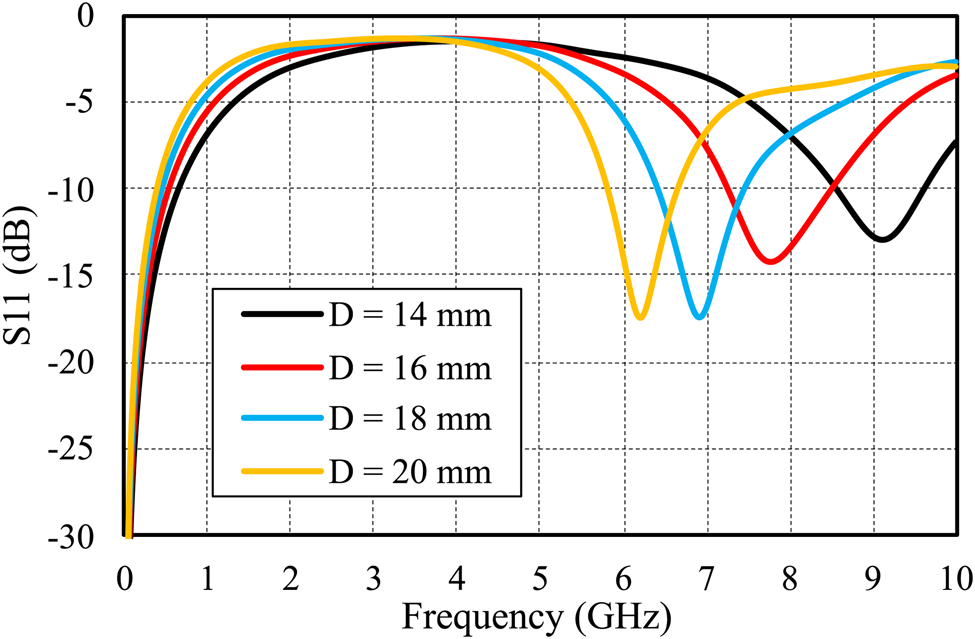
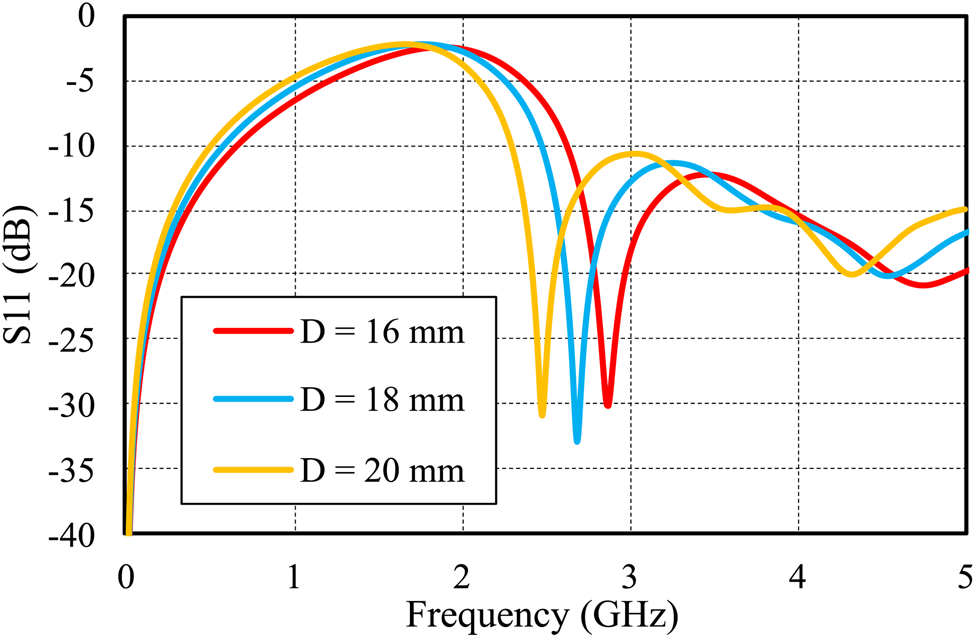
Second, the simulated results of the reflection coefficient (S 11) for different diameters 20, 18, 16, and 14 mm are shown in Fig. 8. As the diameter of the slot decreases, the resonant frequency is shifted toward a higher frequency, the F 0 of the unloaded sensor with D 20 mm is 6.2 GHz, while 18 mm has F 0 of 6.95 GHz. Both 16 and 14 mm D have F 0 of 7.75 and 9 GHz, respectively. Third, our proposed sensor is designed to match the industrial, scientific, and medical (ISM) bands. Therefore, sensors with different diameters were loaded with a glucose concentration of 250 mg/dl. It is clearly observed that for the sensor with D of 20 mm, its operating frequency shifted from 6.2 GHz (unloaded) to 2.45 GHz (loaded) as shown in Fig. 9, which meets the requirements of the ISM bands, unlike the 18 and 16 mm diameters, where their frequencies are 2.7 and 2.9 GHz, respectively.
Reflection coefficients for different diameters of the sensor (unloaded).

Reflection coefficients for different diameters of the loaded sensor with a glucose concentration of 250 mg/dl.

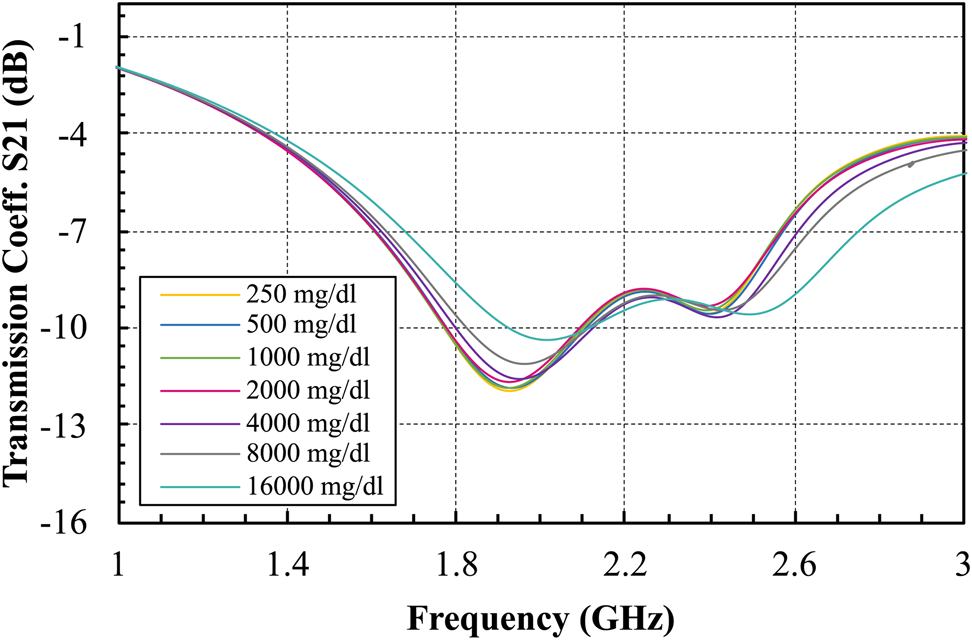
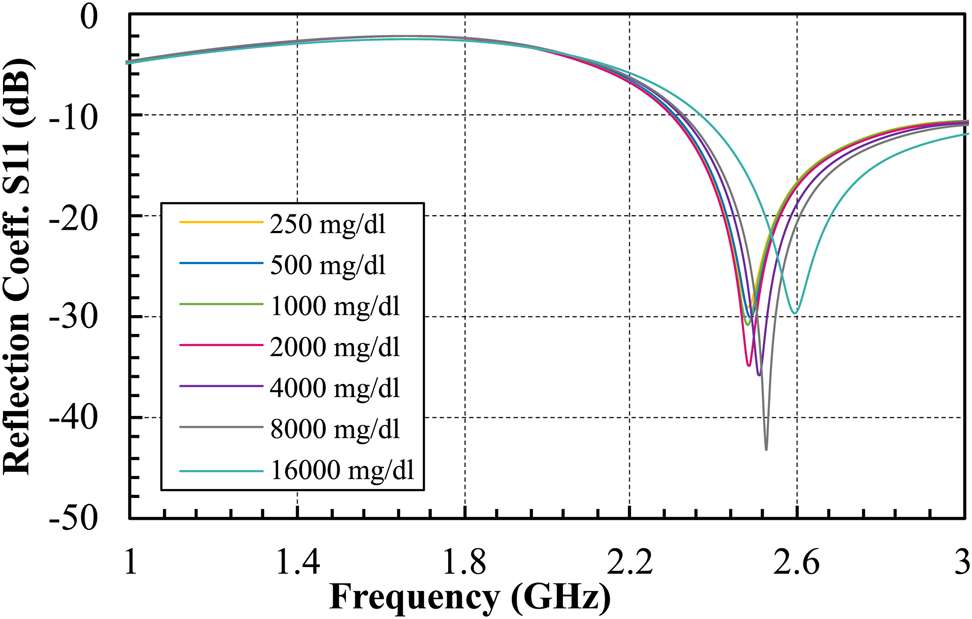
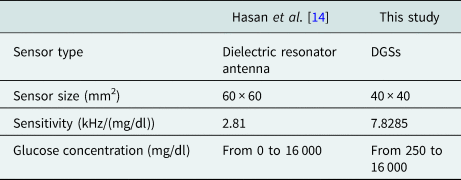
Additionally, different cases with various glucose concentrations from 250 to 16 000 mg/dl were simulated. Results for the transmission and reflection coefficients for the single slot with D of 20 mm are shown in Figs 10 and 11, respectively. For the reflection coefficient, as the glucose concentration increases, the resonant frequency of the sensor tends to shift to higher frequencies which results in high sensitivity. Moreover, values for the reflection coefficient (amplitude) increase with increasing glucose levels. The reflection coefficient of the proposed sensor changes from −43.5 to −28 dB when the glucose concentration changes from 250 to 16 000 mg/dl. This is a wider range in the reflection coefficient compared to a previous study [Reference Hasan, Tamanna, Singh, Nadeem and Rudramuni14], which results in higher sensitivity as shown in Table 1. However, there was not much change in the transmission coefficient.
Transmission coefficient simulation results of the single-slot DGS sensor with D of 20 mm for different glucose concentrations.

Reflection coefficient simulation results of the single-slot DGS sensor with D of 20 mm for different glucose concentrations.

Comparison of this study with another resonator

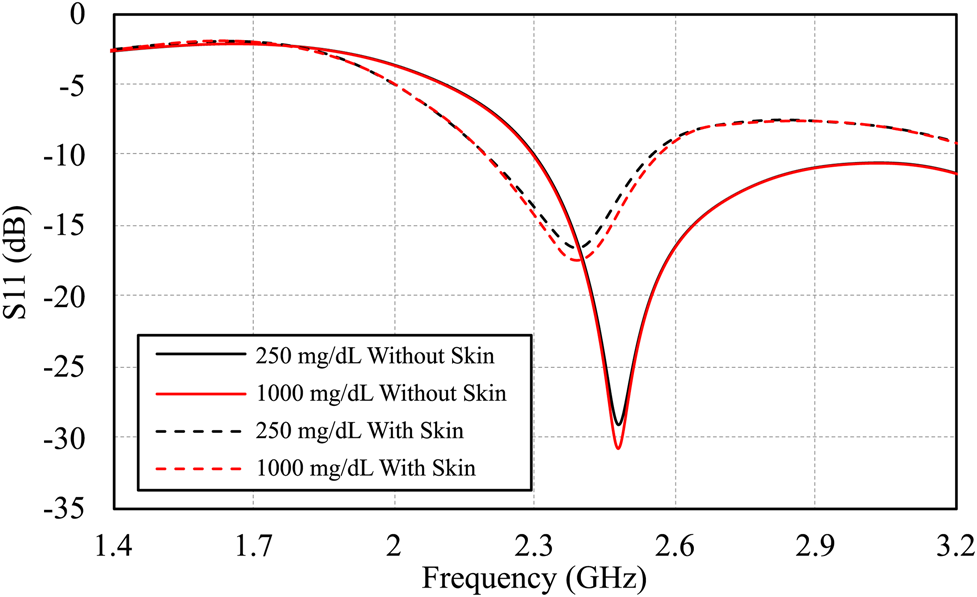
Our objective is to distinguish between different levels of glucose concentration as a function of the permittivity of human blood. Therefore, the Cole–Cole model is used accurately in this study. However, there are various inhomogenous layers found in the human tissue such as the skin. For a realistic scenario, the skin effect is taken into consideration in another simulation which is done using a skin tissue with an ɛ of 30 and thickness of 1 mm [Reference Turgul and Kale23–Reference Omer, Shaker, Safavi-Naeini, Kokabi, Alquié, Deshours and Shubair25]. This is done to mimic the practical dimensions of a human finger placed on the biosensor. The reflection response is illustrated in Fig. 12 where two different glucose concentrations are simulated two times, the first using only a blood layer on the DGS sensing area, and the second using both blood and skin layers. It is observed that when a glucose sample of 250 mg/dl is used without a skin layer, the reflection response is −28 dB, while for the skin layer, it attenuated the EM wave reflection to −17 dB. However, both cases provided approximately the same amount of deviation between the reflection responses when the glucose concentration in the blood is varied from 250 to 1000 mg/dl. This illustrates that the skin layer has a slight influence on weakening the signal. But, the main factor that contributes to change the response is the glucose level in the blood. Therefore, the skin layer can safely be neglected for the simplicity of the simulation. As declared earlier, this paper highlights the functionality of the permittivity of blood with different glucose levels.
Reflection responses of two glucose samples with and without a skin layer.

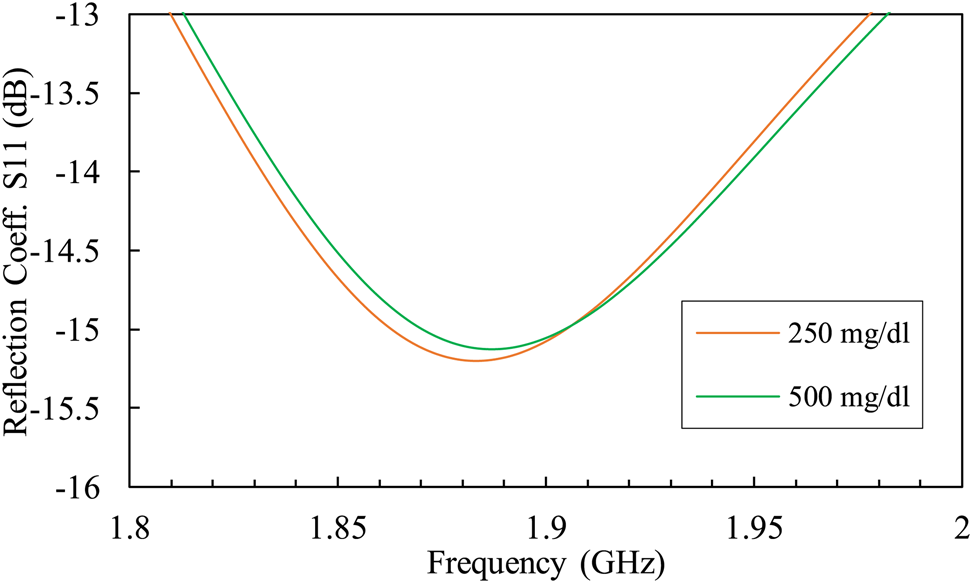
The two slot structure shows a negligible change in the reflection coefficient as shown in Fig. 13. As the glucose concentration changes from 250 to 500 mg/dl, the reflection coefficient difference was only 0.06 dB. This clearly proved that the proposed DGS sensor with a single slot of D 20 mm has better sensitivity to various glucose levels of human blood.
Reflection coefficient plot of the proposed two-slot DGS sensor for different glucose concentrations.

Experimental results
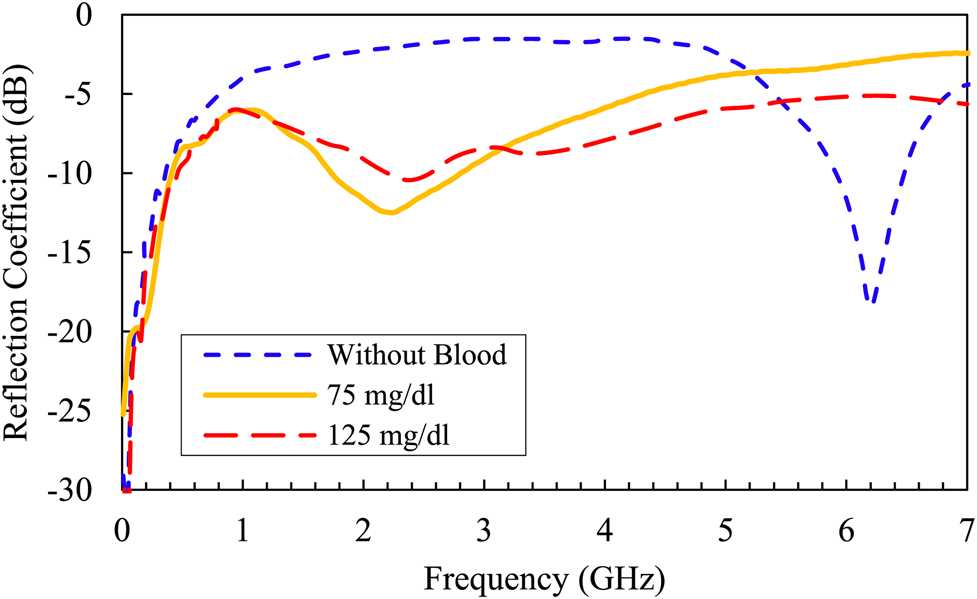
The experimental results were conducted using two different measurements setups. First, the Keysight PNA Network Analyzer was used to measure the reflection coefficients for two different blood glucose concentrations, 75 and 125 mg/dl. The measured glucose concentrations were calculated using the FreeStyle Freedom Lite Blood Glucose Meter (https://www.ubuy.com.eg/en/search/index/view/product/B002G3EJ1K/s/freestyle-freedom-lite-blood-glucose-meter/store/store).
The results are shown in Fig. 14, there is a slight difference in the amplitude of the reflection response, besides a very small shifting in the frequency response. When the glucose concentration is 75 mg/dl, the corresponding S 11 is −12.5 dB at 2.31 GHz. While using 125 mg/dl, the S 11 response is −10 dB at 2.4 GHz. As a result, the sensor can differentiate between various glucose concentration levels within a relatively good sensitivity range, which validates the concept of our proposed DGS sensor. The relation between the reflection coefficient and the input impedance can be expressed as [Reference Pozar26]:

where |S 11| is the reflection coefficient, Z in is the input impedance, and Z 0 is the characteristic impedance, which is usually equal to 50 Ω.
Experimental measurements for two different blood glucose concentrations compared to a case without a blood sample.

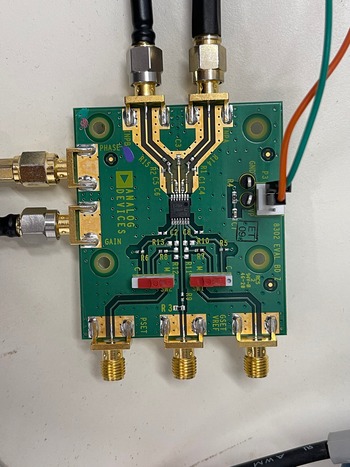
Second, the AD8302 evaluation board which is illustrated in Fig. 15, is used. This board is an integrated system that measures the gain and phases up to 2.7 GHz. It operates from supply voltages of 2.7–5.5 V. The AC-coupled input signals can range from −60 to 0 dBm in a 50 Ω system. Additionally, a multi-meter is used to record the gain value in the millivolt scale.
AD8302 gain/phase detector evaluation board.

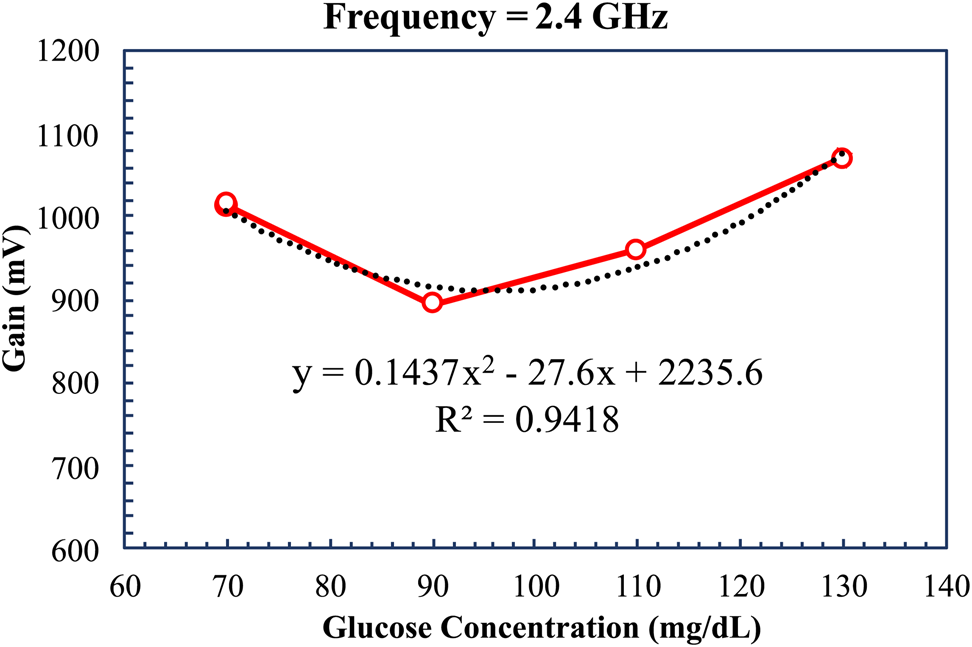
Three men and one woman volunteered to measure their blood glucose levels. The measured glucose concentrations were between 70 and 130 mg/dl. Then, the proposed sensor was connected to the AD8302 board, signal generator, and a multimeter to measure the gain. The sensor response was measured, and the relation between the glucose concentration and the gain in millivolt was calculated at a frequency of 2.4 GHz, as shown in Fig. 16, where the y is the output gain l (mV) which is a polynomial function from the second degree, and χ is the glucose concentration (mg/dl). The reference signal at 2.4 GHz is 1186 mV, R 2 is an indicator of how well the measured data fit the model of regression. The squared value of the correlation coefficient is 0.9925, which indicates a strong relationship between the sensor output voltages and the glucose concentrations. The minimum amplitude is 895 mV at 90 mg/dl, while the maximum value is 1070 mV at 130 mg/dl. The correlation between the amplitude difference and the glucose concentrations is shown in Fig. 16.
Sensor amplitude difference as a function of different glucose concentrations.

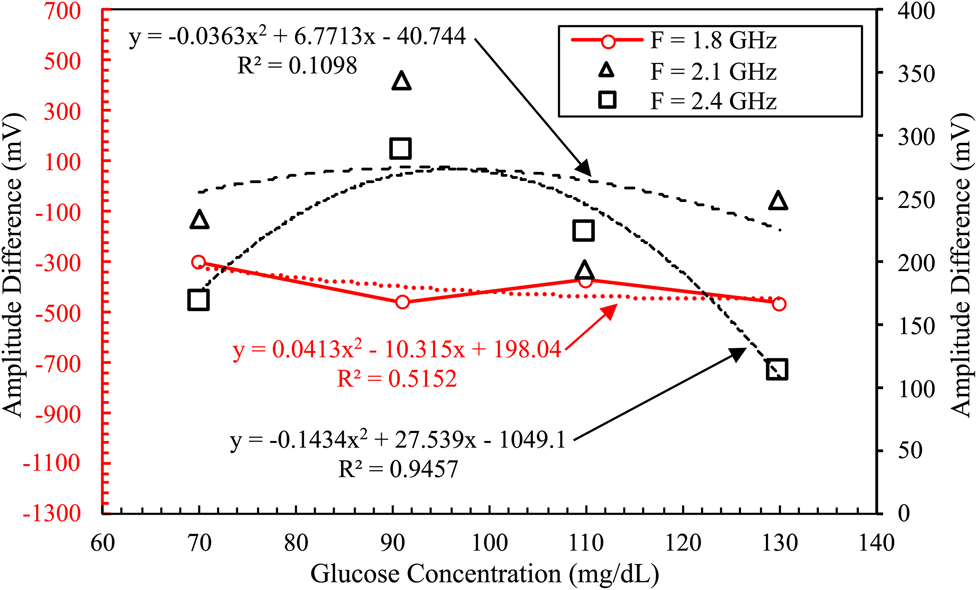
Finally, an Agilnet X signal generator is used to sweep the input signal from 1.8 to 2.4 GHz. The reference signal was 950, 475, and 1186 mV for 1.8, 2.1, and 2.4 GHz, respectively. The amplitude values depend on the gain value for each glucose concentration as illustrated in Fig. 17. For example, at 2.4 GHz, when the glucose concentration is 130 mg/dl, the gain value is 1070 mV, the amplitude difference is about 116 mV, and the correlation value is the highest. While at 2.1 GHz, for the same glucose concentration, the reference signal is 475 mV, the output gain is 225 mV, and the amplitude difference is about 250 mV, but the correlation value is the lowest. The correlation coefficient is 0.1098 at 2.1 GHz, and 0.9457 at 2.4 GHz, which is the resonant frequency of the proposed sensor. The gain is dependent on the resonant frequency, for example, at a frequency of 1.8 GHz, there are very small changes in the gain. However, at the resonant frequency of 2.4 GHz, there is an adequate difference in the gain which is an indication by the regression model. It is worth noting that the sensitivity of the sensor in terms of gain is equal to 5 mV/(mg/dl) at 2.4 GHz, which can be measured with acceptable accuracy using modern multimeters.
Amplitude readings as a function of different glucose concentrations over different frequencies.

Conclusion
A novel compact non-invasive glucose concentration sensor based on a DGS with a single slot is presented. The operating frequency of the microwave sensor is about 2.45 GHz. The sensor is designed and simulated using the software package CST Microwave Studio. The sensor is also tested experimentally using the Keysight PNA Network Analyzer and AD8302 gain/phase detector evaluation board. The results of this study indicated that the proposed sensor has a sensitivity of 7.8285 kHz/mg/dl. Additionally, the sensor offers a chance to be used in the juice, pharmaceutical industries, and chemical-sensing applications at high glucose concentrations (up to 16 000 mg/dl). The future research will include a higher sensitivity sensor that can detect small changes in the glucose level in the human blood for different glucose concentrations in the physiological range of 70–500 mg/dl, which can be a promising candidate for measuring glucose levels non-invasively in real time.
Acknowledgements
This study is supported by the Ministry of Higher Education of Egypt (MoHE) as well as the Egypt-Japan University of Science and Technology (E-JUST). The authors are grateful for this support.
 Esraa Mansour is a teaching assistant in Electronics and Communications Engineering. She received her B.Sc. in Electronics and Communications Engineering from Zagazig University, Egypt. She received her M.Sc. degree in 2021 from Egypt-Japan University of Science and Technology, Alexandria, Egypt. Currently, She is pursuing a Ph.D. degree, and her current research interests include antenna designs and microwave sensors to measure blood glucose levels non-invasively.
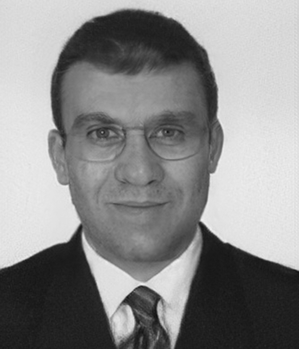 Ahmed Allam is currently an Associate Professor at the Department of Electronics and Communications Engineering, Egypt-Japan University of Science and Technology, Alexandria, Egypt. He received his B.Sc. in Electrical Engineering from Alexandria University, Egypt, and his M.Eng. and Ph.D. from the University of Alberta, Canada. From April 1994 to January 1998, he worked as an instrument engineer with Schlumberger. From May 2000 to September 2001, he was with Murandi Communications Ltd., Calgary, Alberta, where he worked on RF transceivers design. From April 2007 to April 2008, he worked on RF CMOS transceivers design at Scanimetrics Inc., Edmonton, Alberta. His research interests include the design of RF circuits and systems.
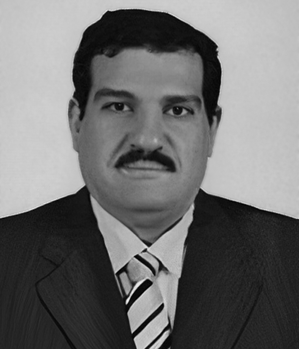 Adel B. Abdel-Rahman is currently a Professor at the Department of Electronics and Communications Engineering, Egypt-Japan University of Science and Technology, Alexandria, Egypt. He received his B.S. and M.S. in Electrical Engineering, Communication, and Electronics from Assiut University, Egypt, and his Dr.-Ing. degree in Communication Engineering from Otto von Guericke University, Germany in 2005. Since October 2006, he has been an Assistant Professor at the Electrical Engineering Department, South Valley University, Qena, Egypt. He has published more than 120 refereed journal and conference papers and has two patents. He was the Executive Director for Information and Communication Technology, South Valley University, from 2010 to 2012. Since October 2012, he joined the School of Electronics, Communications and Computer Engineering, Egypt-Japan University of Science and Technology (E-JUST), Alexandria, Egypt, and has been the Dean of the Faculty of Computers and Information, South Valley University from 2016 to 2018. His research interests include the design and analysis of antennas, filters, millimeter-wave devices, WPT, and metamaterials and their applications in wireless communication, as well as optimization techniques with applications to microwave devices and antenna arrays.