1. Introduction
Parallel manipulators (PMs) have presented great commercial value in high-speed processing and sorting due to their high stiffness, excellent dynamic performance, and reconfigurability [Reference Miller1]. The successful commercial parallel robots include the Delta robot [Reference Clavel2], Tricept robot [Reference Siciliano3], Z3 robot [Reference Chen, Liu and Xie4], and Exechon robot [Reference Nagao, Fujiki and Tanaka5].
The dynamic index is crucial for the performance evaluation of PMs, and excellent dynamic performance ensures stability and accuracy under the high-speed operation of PMs. An analytical elastodynamic model can identify regions in the workspace with poor dynamics, which vibrates the structure extremely. Research on the dynamic modeling of PMs has undergone a transition from rigid-body dynamics to elastic dynamics modeling. Initially, the model is established under the assumption that all components are rigid bodies [Reference Wu, Xiong and Kong6]. Typical rigid-body dynamic models include Kane’s method [Reference Yang and Han7], Lagrangian formulation [Reference Vongvit and Zhu8], and recursive Newton–Euler formulation [Reference Chen, Yu and Li9]. The flexibility of components is considered in dynamic models to evaluate the natural frequency that represents the mechanism’s ability to resist vibration. The most common elastodynamic models mainly include the finite-element method (FEM), Lagrangian formula, and substructure synthesis. Zhu et al. [Reference Zhu, Wang and Chen10] established the 3-TPT PM’s elastodynamic model using the FEM. Palmieri et al. [Reference Palmieri, Martarelli and Palpacelli11] analyzed the natural frequencies of a PM through the FEM. The FEM, which can achieve higher calculation accuracy, is usually used for components with irregular sectional shapes. However, the grid needs to be remeshed for each configuration, which causes a high computational cost. Therefore, the FEM is often used to verify the theoretical model at the prototype stage.
Mathieu et al. [Reference Rognant, Courteille and Maurine12] used the Lagrangian formulation to establish the elastodynamic model of the delta PM to analyze its natural frequency. Coralie et al. [Reference Germain, Briot and Caro13] analyzed the first 90-order natural frequencies of the planar manipulator by establishing its elastic dynamic model with the Lagrangian formulation. However, the aforementioned Lagrangian formulation requires additional Lagrangian multipliers and constraint equations, which increases the number of unknown variables and computational cost [Reference Shabana14].
Substructure synthesis technology establishes the dynamic equation of each open-loop substructure and then assembles it into a complete dynamic model through the kinematic constraint equation. Zhang et al. [Reference Zhang, Zhao and Ceccarelli15] analyzed the natural frequency distribution in the workspace by developing an elastodynamic model of the 3-DOF 3PRS PM with substructure synthesis. Liu et al. [Reference Zhao, Gao and Dong16] predicted the natural frequency distribution in the workspace by developing the elastodynamic model of the 8-PSS PM. Wu et al. [Reference Wu, Wang and Liu17] established the elastodynamic model of hybrid robots based on the substructure synthesis technology. Lian et al. [Reference Lian, Wang and Wang18–Reference Lian, Wang and Wang19] investigated the natural frequency distribution in the workspace by elastodynamic modeling in terms of the FEM and substructure synthesis technology. Shankar et al. [Reference Ganesh and Rao20] studied the first natural frequency of a 2-DOF translational parallel robot. Furthermore, Hoevenaars et al. [Reference Hoevenaars, Krut and Herder21] analyzed the natural frequency of a planar parallel robot combined with the Jacobian analysis and constraint equations. Wu et al. [Reference Wu, Yu and Gao22–Reference Wu, Li and Wang23] proposed bond graph modeling to investigate the natural frequency of PMs.
The above mentioned method requires additional Lagrange multipliers or simultaneous kinematic constraint equations to avoid violating the kinematic constraint of the mechanism. The main contribution of the work is that the elastodynamic model is established based on the independent displacement coordinates and substructure synthesis technology. It consists of all the kinematic constraints of the manipulator and has achieved high computational efficiency without kinematic constraint equations or Lagrangian multipliers.
The remainder of the work is organized as follows. The 3-RPS PM’s structure and kinematic analysis are described in Section 2. Section 3 presents the elastodynamic modeling of the 3-RPS PM based on the substructure synthesis technology. Section 4 shows the conclusions.
2. Structure description and kinematic analysis of the 3-RPS PM
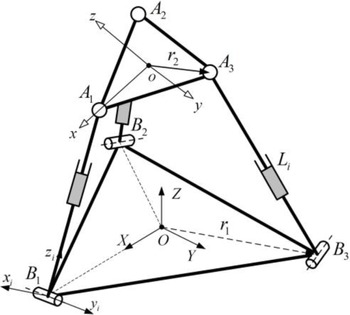
Figure 1 shows a 3-DOF 3RPS PM [Reference Desai and Muthuswamy24] that links the moving platform via the R-joint at point B
i
to the base through the spherical joint at point A
i
. Each chain consists of upper and lower links with three translational actuators. ΔA
1
A
2
A
3 and ΔB
1
B
2
B
3 are equilateral triangles (oA
1 = oA
2 = oA
3 = r
2, and OB
1 = OB
2 = OB
3 = r
1). The revolute joint’s axis is perpendicular to vector OB
i
and in the plane B
1
B
2
B
3. The physical and geometric parameters of the manipulator are as follows: material density
 $\rho$
= 7820 kg/m3; shear modulus G = 77 GPa; moving platform’s thickness h = 20 mm; elastic modulus E = 200 GPa; link diameter d
i
= 100 mm; r
1 and r
2 are 0.3 and 0.2 m, respectively.
Schematic diagram of the 3-RPS PM.

The global coordinate system, moving coordinate system, and limb coordinate system are respectively attached at the base, moving platform, and limb, for kinematic analysis (see Fig. 1). Inverse kinematics analysis of the mechanism is required to obtain the length of the connecting rod under a given end position and posture of the mechanism, which is necessary for the dynamic performance evaluation of the mechanism in the workspace.
According to the T&T angle [Reference Bonev25], the rotation matrix from the moving system to the fixed system is defined by:
 \begin{equation} \boldsymbol{R}=\left[\begin{array}{l@{\quad}l@{\quad}l} c^{2}\varphi c\theta +s^{2}\varphi & \mathit{c}\mathit{\varphi }c\theta s\varphi -s\varphi c\varphi & c\varphi s\theta \\[4pt] \mathit{c}\mathit{\varphi }c\theta s\varphi -s\varphi c\varphi & s^{2}\varphi c\theta +c^{2}\varphi & s\varphi s\theta \\[4pt] -c\varphi s\theta & -s\varphi s\theta & c\theta \end{array}\right] \end{equation}
where θ and φ are the orientation angles of the mechanism about the x- and y-axes, respectively.
Equation (2) shows the relation between the orientation and position coordinates of the mechanism end point:
 \begin{equation} \left\{\begin{array}{l} x=\dfrac{r_{2}\left(c\theta -1\right)c\left(2\varphi \right)}{2}\\[9pt] y=\dfrac{r_{2}\left(1-c\theta \right)s\left(2\varphi \right)}{2} \end{array}\right. \end{equation}
where x and y are the position coordinates of the point of the mechanism along the x- and y-axes, respectively.
Closed-loop vectors are used to determine the inverse kinematics of the manipulator:
 \begin{equation} \boldsymbol{B}_{i}\boldsymbol{A}_{i}=\boldsymbol{Oo}+\boldsymbol{Ro}\boldsymbol{A}_{i}-\boldsymbol{O}\boldsymbol{B}_{i} \end{equation}
Thus, the actuator length of the link can be obtained as
 $L_{i}=| \boldsymbol{B}_{i}\boldsymbol{A}_{i}|$
.
3. Elastodynamic model
Natural frequency, especially the fundamental frequency, is the main dynamic performance index of PMs. The higher fundamental frequency leads to higher control bandwidth and better dynamic performance. An accurate elastodynamic model should be established before exploring the 3-RPS PM’s dynamic behaviors. Substructure synthesis technology is used to split the PM of a multi-closed-loop system into multiple independent open-loop substructures to establish the dynamic equations of each substructure separately. Finally, the substructures are assembled into a multi-closed-loop system through the motion constraint equation to form a complete dynamic equation of the mechanism. The substructure synthesis is adopted as the dynamic modeling method in the work. The basic analysis process can be found in ref. [Reference Zhang, Zhao and Ceccarelli15]. The assumptions are considered as follows for the dynamic modeling: the moving platform is considered as a rigid body, and other components are elastic bodies; joints are ideal constraints and perfect rigid; the system satisfies the small deformation hypothesis and instantaneous structure assumption; frictions are ignored. The work focuses on the natural frequency analysis instead of the rigid motion of the mechanism (i.e., inertial force). However, a combination with the kinematic constraint equation or the Lagrangian multiplier is required for the traditional dynamic modeling of PMs, which hinders solving the dynamic model.
The identification of independent displacement coordinates for multi-body systems has always been one of the challenges in the dynamic modeling of the PM. An identification method for independent coordinates of the multi-body PM is established based on the multipoint constraint theory, linear algebra, and singularity analysis. After that, the elastodynamic model of the PM is established by substructure synthesis technology. It has high computational efficiency because simultaneous kinematic constraint equations or increased Lagrange multipliers are not required.
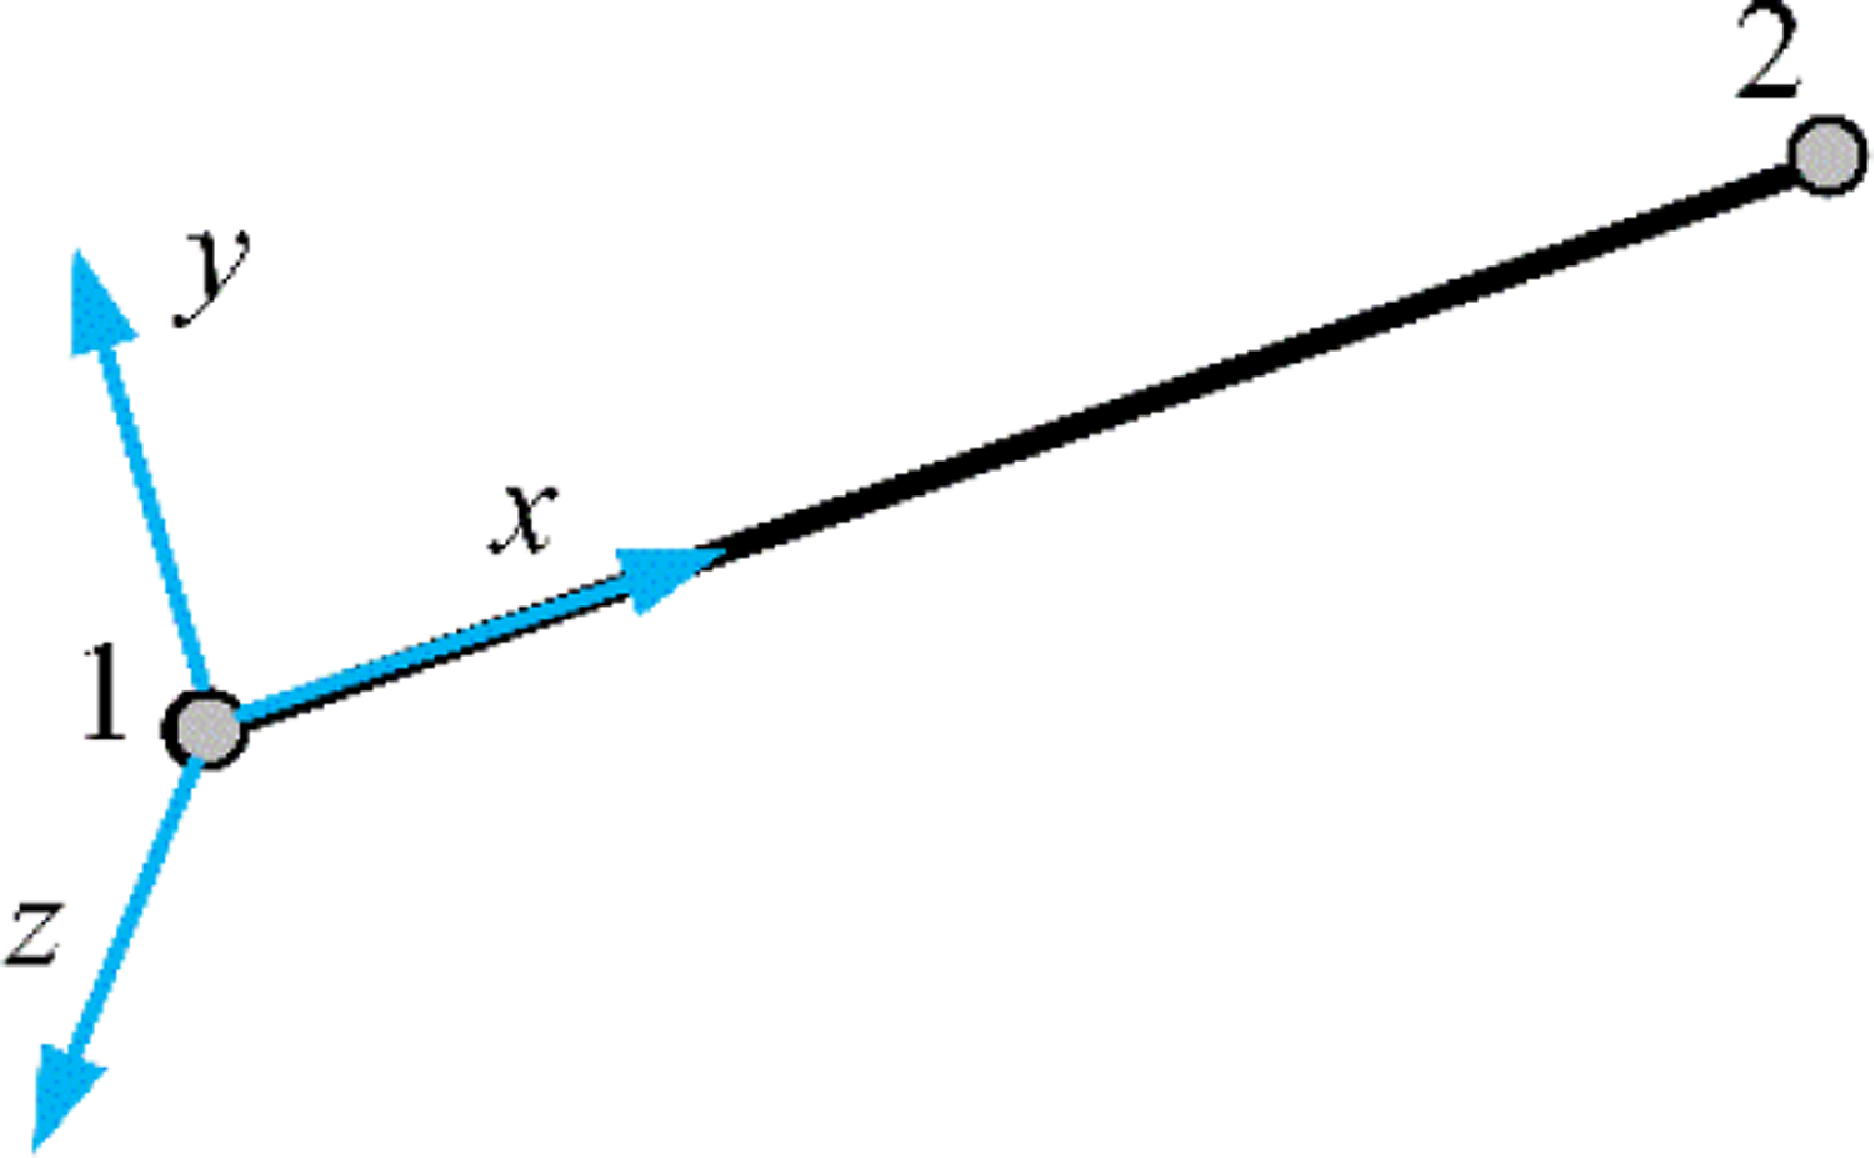
Spatial element beam.

3.1. Elastodynamic equation of the unconstrained substructure
Ref. [Reference Yang, Li and Chen26] showed that replacing the Euler–Bernoulli beam element with the Timoshenko beam element will not significantly affect the stiffness performance of the PM. The work focuses on a dynamic modeling method that combines global-independent generalized coordinates and substructure synthesis techniques. Besides, the Euler–Bernoulli beam element is adopted to model the rod. For slender members, the Euler–Bernoulli beam can be replaced by the Timoshenko beam element. Figure 2 shows the Euler–Bernoulli beam element. When the rod is discretized into s elements, the elastodynamic equation [Reference Wu, Wang and Liu17] of the rod is expressed as:
 \begin{equation} \boldsymbol{M}_{e}\ddot{\boldsymbol{u}}_{i}+\boldsymbol{K}_{e}\boldsymbol{u}_{i}=\boldsymbol{f}_{i} \end{equation}
where
u
i
= [
i
Δ
Bi
,
i
Φ
Bi
,
i
u
in, i
,
i
Δ
Ai
,
i
Φ
Ai
]T and
 $\boldsymbol{f}_{i}=[{}^{i}{\boldsymbol{f}}{_{Bi}^{T}},{}^{i}{\boldsymbol{m}}{_{Bi}^{T}},{}^{i}{\boldsymbol{f}}{_{in,i}^{T}},{}^{i}{\boldsymbol{m}}{_{in,i}^{T}},{}^{i}{\boldsymbol{f}}{_{Ai}^{T}},{}^{i}{\boldsymbol{m}}{_{Ai}^{T}}]^{\mathrm{T}}$
are the element node coordinate vector and the external load vector of the ith rod in the coordinate system B
i
-x
i
y
i
z
i
, respectively;
i
Δ
Ai
(
i
Φ
Ai
) and
i
Δ
Bi
(
i
Φ
Bi
) are the linear (angular) displacement coordinates of nodes A
i
and B
i
in the coordinate system B
i
-x
i
y
i
z
i
, respectively;
i
u
in, i
is the inner nodes of the ith rod;
f
Bi
(
m
Bi
) and
f
Ai
(
m
Ai
) are the force (couple) acting on points B
i
and A
i
in coordinate system B
i
-x
i
y
i
z
i
, respectively;
f
in, i
and
m
in, i
are force and moment corresponding to the inner nodes, respectively.
The expressions of the elastodynamic equation of the rod in the global coordinate system are given as follows:
 \begin{equation} \boldsymbol{M}_{i}\ddot{\boldsymbol{U}}_{i}+\boldsymbol{K}_{i}\boldsymbol{U}_{i}=\boldsymbol{F}_{i} \end{equation}
where
 $\boldsymbol{M}_{i}=\boldsymbol{T}_{i}\boldsymbol{M}_{e}\boldsymbol{T}_{i}^{\mathrm{T}} ;\, \boldsymbol{K}_{i}=\boldsymbol{T}_{i}\boldsymbol{K}_{e}\boldsymbol{T}_{i}^{\mathrm{T}} ;\, \boldsymbol{F}_{i}=\boldsymbol{T}_{i}\boldsymbol{f}_{i} ;\, \boldsymbol{U}_{i}=\boldsymbol{T}_{i}\boldsymbol{u}_{i}$
;
T
i
is the transformation matrix:
 \begin{equation} \boldsymbol{T}_{i}=\text{diag}\left[\underset{2\left(s+1\right)\boldsymbol{R}_{i}}{\underbrace{\boldsymbol{R}_{i},\ldots,\boldsymbol{R}_{i}}}\right] \end{equation}
where R i is the rotation matrix from limb (substructure) coordinate system B i -x i y i z i to global coordinate system O-XYZ.
The elastodynamic equation for the substructure of the rigid moving platform in the global coordinate system is expressed as follows:
 \begin{equation} \boldsymbol{M}_{p}\ddot{\boldsymbol{U}}_{p}=\boldsymbol{F}_{p} \end{equation}
where
 $\boldsymbol{M}_{p}=\boldsymbol{T}_{p}{}^{o}{\boldsymbol{M}}{_{p}^{}}\boldsymbol{T}_{p}^{\mathrm{T}}$
,
T
p
is the transforming matrix,
o
M
p
is the moving platform’s mass matrix in system o-xyz,
 $\boldsymbol{U}_{p}=[\boldsymbol{\Delta }_{p}^{\mathrm{T}},\boldsymbol{\Phi}_{p}^{\mathrm{T}}]^{\mathrm{T}}, \boldsymbol{\Phi}_p$
and
Δ
p
are the global angular and linear displacement coordinates of point o, respectively,
 $\boldsymbol{F}_{p}=[\boldsymbol{f}_{p}^{\mathrm{T}},\boldsymbol{m}_{p}^{\mathrm{T}}]^{\mathrm{T}}$
is external load at point o, and f
p
and m
p
represent force and moment, respectively:
 \begin{equation} {}^{o}{\boldsymbol{M}}{_{p}^{}}=\left[\begin{array}{l@{\quad}l@{\quad}l@{\quad}l@{\quad}l@{\quad}l} m_{p} & & & & & \\[3pt] & m_{p} & & & & \\[3pt] & & m_{p} & & 0 & \\[3pt] & & & \dfrac{m_{p}r_{2}^{2}}{4} & & \\[3pt] & & 0 & & \dfrac{m_{p}r_{2}^{2}}{4} & \\[3pt] & & & & & \dfrac{m_{p}r_{2}^{2}}{2} \end{array}\right] \end{equation}
 \begin{equation} \boldsymbol{T}_{p}=\left[\begin{array}{l@{\quad}l} \boldsymbol{R} & 0_{3}\\[4pt] 0_{3} & \boldsymbol{R} \end{array}\right] \end{equation}
where m p is the mass of the moving platform and R is the rotation matrix from the moving system to the global coordinate system.
3.2. Complete dynamic governing equation
According to the multipoint constraint element theory, Eq. (10) shows the compatibility equation between the elastic deformation of point o of the moving platform and the linear displacement elastic deformation of point A i at the limb ends:
 \begin{equation} \boldsymbol{\Delta }_{Ai}=\left[\begin{array}{l@{\quad}l} \boldsymbol{E}_{3} & \left[\boldsymbol{A}_{\boldsymbol{i}}\boldsymbol{o}\times \right] \end{array}\right]\boldsymbol{U}_{p} \end{equation}
where
Δ
Ai
is the linear displacement coordinates of point A
i
and
 $[\boldsymbol{A}_{\boldsymbol{i}}\boldsymbol{o}\times ]$
is the antisymmetric matrix.
The elastodynamic equation of limbs and the moving platform can be expressed as follows:
 \begin{equation} \left\{\begin{array}{l} \overline{\boldsymbol{M}}_{i}\ddot{\overline{\boldsymbol{U}}}+\overline{\boldsymbol{K}}_{i}\overline{\boldsymbol{U}}=\overline{\boldsymbol{F}}_{i}\\[4pt] \overline{\boldsymbol{M}}_{p}\ddot{\overline{\boldsymbol{U}}}=\overline{\boldsymbol{F}}_{p} \end{array}\right. \end{equation}
where
 $\overline{\boldsymbol{U}}=\left[\begin{array}{l@{\quad}l@{\quad}l@{\quad}l@{\quad}l@{\quad}l@{\quad}l@{\quad}l@{\quad}l@{\quad}l@{\quad}l} \boldsymbol{\Delta }_{B1}^{\mathrm{T}} & \boldsymbol{\Phi }_{B1}^{\mathrm{T}} & \boldsymbol{u}_{in,1}^{\mathrm{T}}\quad \boldsymbol{\Phi }_{A1}^{\mathrm{T}} & \boldsymbol{\Delta }_{B2}^{\mathrm{T}} & \boldsymbol{\Phi }_{B2}^{\mathrm{T}} & \boldsymbol{u}_{in,2}^{\mathrm{T}}\quad \boldsymbol{\Phi }_{A2}^{\mathrm{T}} & \boldsymbol{\Delta }_{B3}^{\mathrm{T}} & \boldsymbol{\Phi }_{B3}^{\mathrm{T}} & \boldsymbol{u}_{in,3}^{\mathrm{T}}\quad \boldsymbol{\Phi }_{A3}^{\mathrm{T}} & \boldsymbol{\Delta }_{p}^{\mathrm{T}} & \boldsymbol{\Phi }_{p}^{\mathrm{T}} \end{array}\right]^{\mathrm{T}}$
is the expanded displacement coordinates of the mechanism;
 $\overline{\boldsymbol{K}}_{i}$
and
 $\overline{\boldsymbol{M}}_{i}$
are the expanded stiffness and mass matrices of the ith limb, respectively,
 $\overline{\boldsymbol{M}}_{p}$
is the expanded mass matrix of the moving platform,
 $\overline{\boldsymbol{M}}_{i}=\boldsymbol{H}_{i}^{T}\boldsymbol{M}_{i}\boldsymbol{H}_{i} ;\, \overline{\boldsymbol{K}}_{i}=\boldsymbol{H}_{i}^{T}\boldsymbol{K}_{i}\boldsymbol{H}_{i} ;\, \overline{\boldsymbol{F}}_{i}=\boldsymbol{H}_{i}^{T}\boldsymbol{F}_{i} ;\, \overline{\boldsymbol{M}}_{p}=\boldsymbol{H}_{p}^{\mathrm{T}}\boldsymbol{M}_{p}\boldsymbol{H}_{p} ;\, \overline{\boldsymbol{F}}_{p}=\boldsymbol{H}_{p}^{\mathrm{T}}\boldsymbol{F}_{p}$
, and
H
i
and
H
p
are the transformation matrices defined as follows:
 \begin{equation} \left\{\begin{array}{l} \boldsymbol{H}_{1}=\left[\begin{array}{l@{\quad}l@{\quad}l} \boldsymbol{E}_{6} & 0_{6\times \left(18s+9\right)} & \\[4pt] 0_{\left(6s-6\right)\times 6} & \boldsymbol{E}_{\left(6s-6\right)\times \left(6s-6\right)} & 0_{\left(6s-6\right)\times \left(12s+15\right)}\\[4pt] 0_{3\times \left(18s+9\right)} & \boldsymbol{J}_{1} & \\[4pt] 0_{3\times 6s} & \boldsymbol{E}_{3} & 0_{3\times \left(12s+12\right)} \end{array}\right]\\[35pt] \boldsymbol{H}_{2}=\left[\begin{array}{l@{\quad}l@{\quad}l} 0_{6\times \left(6s+3\right)} & \boldsymbol{E}_{6} & 0_{6\times \left(12s+6\right)}\\[4pt] 0_{\left(6s-6\right)\times \left(6s+9\right)} & \boldsymbol{E}_{\left(6s-6\right)\times \left(6s-6\right)} & 0_{\left(6s-6\right)\times \left(6s+12\right)}\\[4pt] 0_{3\times \left(18s+9\right)} & \boldsymbol{J}_{2} & \\[4pt] 0_{3\times \left(12s+3\right)} & \boldsymbol{E}_{3} & 0_{3\times \left(6s+9\right)} \end{array}\right]\\[35pt] \boldsymbol{H}_{3}=\left[\begin{array}{l@{\quad}l@{\quad}l} 0_{6\times \left(12s+6\right)} & \boldsymbol{E}_{6} & 0_{6\times \left(6s+3\right)}\\[4pt] 0_{\left(6s-6\right)\times \left(12s+12\right)} & \boldsymbol{E}_{\left(6s-6\right)\times \left(6s-6\right)} & 0_{\left(6s-6\right)\times 9}\\[4pt] 0_{3\times \left(18s+9\right)} & \boldsymbol{J}_{3} & \\[4pt] 0_{3\times \left(18s+6\right)} & \boldsymbol{E}_{3} & 0_{3\times 6} \end{array}\right]\\[35pt] \boldsymbol{H}_{p}=\left[\begin{array}{l@{\quad}l} 0_{6\times \left(18s+9\right)} & \boldsymbol{E}_{6} \end{array}\right] \end{array}\right. \end{equation}
where
 $\boldsymbol{J}_{i}=[\begin{array}{l@{\quad}l} \boldsymbol{E}_{3} & [\boldsymbol{A}_{\boldsymbol{i}}\boldsymbol{o}\times ] \end{array}]$
.
Equation (11) is transformed into the elastodynamic equation of the manipulator:
 \begin{equation} \overline{\boldsymbol{M}}\ddot{\overline{\boldsymbol{U}}}+\overline{\boldsymbol{K}}\overline{\boldsymbol{U}}=\overline{\boldsymbol{F}} \end{equation}
where
 $\overline{\boldsymbol{M}}=\sum _{i=1}^{3}\overline{\boldsymbol{M}}_{i}+\overline{\boldsymbol{M}}_{p} ;\, \overline{\boldsymbol{K}}=\sum _{i=1}^{3}\overline{\boldsymbol{K}}_{i} ;\, \overline{\boldsymbol{F}}=\sum _{i=1}^{3}\overline{\boldsymbol{F}}_{i}+\overline{\boldsymbol{F}}_{p}$
.
According to the kinematic constraints of the mechanism, the linear displacement coordinates
Δ
Bi
and angular displacement coordinates
 $\Phi_{Bzi}$
connected to the base are zero. They should be eliminated from the expanded displacement coordinates in Eq. (13), as well as the corresponding rows and columns of
 $\overline{\boldsymbol{M}}$
and
 $\overline{\boldsymbol{K}}$
:
 \begin{equation} \boldsymbol{M}_{r}\ddot{\boldsymbol{U}}_{r}+\boldsymbol{K}_{r}\boldsymbol{U}_{r}=\boldsymbol{F}_{r} \end{equation}
where U r is the generalized displacement coordinate of the manipulator with zero displacements eliminated:
 \begin{equation} \boldsymbol{U}_{r}=\left[\begin{array}{l@{\quad}l@{\quad}l@{\quad}l@{\quad}l@{\quad}l@{\quad}l@{\quad}l@{\quad}l@{\quad}l@{\quad}l} {\unicode{x03D5}} _{Bx1} & {\unicode{x03D5}} _{By1} & \boldsymbol{u}_{in,1}^{\mathrm{T}}\quad \boldsymbol{\Phi }_{A1}^{\mathrm{T}} & {\unicode{x03D5}} _{Bx2} & {\unicode{x03D5}} _{By2} & \boldsymbol{u}_{in,2}^{\mathrm{T}}\quad \boldsymbol{\Phi }_{A2}^{\mathrm{T}} & {\unicode{x03D5}} _{Bx3} & {\unicode{x03D5}} _{By3} & \boldsymbol{u}_{in,3}^{\mathrm{T}}\quad \boldsymbol{\Phi }_{A3}^{\mathrm{T}} & \boldsymbol{\Delta }_{p}^{\mathrm{T}} & \boldsymbol{\Phi }_{p}^{\mathrm{T}} \end{array}\right]^{\mathrm{T}} \end{equation}
According to the kinematic constraint characteristic of the revolute joint, only one independent angular displacement coordinate exists. Based on the boundary conditions and multipoint constraint theory, the constraint equations of the R-joints connected to the base can be expressed as follows:
 \begin{equation} \left\{\begin{array}{l} {}^{i}{\boldsymbol{\Delta }}{_{Bi}^{}}=0_{3\times 1}\\[4pt] {}^{i}{{\unicode{x03D5}} }{_{Bxi}^{}}={}^{i}{{\unicode{x03D5}} }{_{Bzi}^{}}=0 \end{array}\right.\left(i=1,2,3\right) \end{equation}
Eq. (16) is transformed into the expression in the global coordinate system:
 \begin{equation} \left\{\begin{array}{l} \boldsymbol{\Delta }_{{B_{i}}}=0_{3\times 1}\\[4pt] {\unicode{x03D5}} _{B{z_{i}}}=0\\[4pt] {\unicode{x03D5}} _{B{x_{i}}}=\frac{R_{i}\left(1,2\right)}{R_{i}\left(2,2\right)}{\unicode{x03D5}} _{B{y_{i}}} \end{array}\right.\left(i=1,2,3\right) \end{equation}
where R i (j, k) is the jth row and the kth column of the matrix R i .
If
 $\Phi_{Bxi}$
is extracted as the independent angular displacement coordinates, the third equation of Eq. (17) can be expressed as:
 \begin{equation} {\unicode{x03D5}} _{B{y_{i}}}=\frac{R_{i}\left(2,2\right)}{R_{i}\left(1,2\right)}{\unicode{x03D5}} _{B{x_{i}}}\left(i=1,2,3\right) \end{equation}
The denominator of Eq. (18) is zero in some configurations, and the mapping equation determined by Eq. (18) is singular in this case. Thus,
 $\Phi_{Byi}$
is considered an independent angular displacement coordinate of point B
i
.
Accordingly, the independent generalized displacement coordinates of the mechanism are identified as follows:
 \begin{equation} \boldsymbol{U}=\left[\begin{array}{l@{\quad}l@{\quad}l@{\quad}l@{\quad}l@{\quad}l@{\quad}l@{\quad}l} {\unicode{x03D5}} _{By1} & \boldsymbol{u}_{in,1}^{\mathrm{T}}\quad \boldsymbol{\Phi }_{A1}^{\mathrm{T}} & {\unicode{x03D5}} _{By2} & \boldsymbol{u}_{in,2}^{\mathrm{T}}\quad \boldsymbol{\Phi }_{A2}^{\mathrm{T}} & {\unicode{x03D5}} _{By3} & \boldsymbol{u}_{in,3}^{\mathrm{T}}\quad \boldsymbol{\Phi }_{A3}^{\mathrm{T}} & \boldsymbol{\Delta }_{p}^{\mathrm{T}} & \boldsymbol{\Phi }_{p}^{\mathrm{T}} \end{array}\right]^{\mathrm{T}} \end{equation}
Therefore, the mapping relationship between Ur and U is defined by:
 \begin{equation} \boldsymbol{U}_{r}=\boldsymbol{QU} \end{equation}
 \begin{equation} \boldsymbol{Q}=\left[\begin{array}{l@{\quad}l@{\quad}l} \frac{R_{1}\left(1,2\right)}{R_{1}\left(2,2\right)} & \textbf{0}_{1\times \left(18s-1\right)} & \\[4pt] 1 & \textbf{0}_{1\times \left(18s-1\right)} & \\[4pt] \textbf{0}_{\left(6s-6\right)\times 1} & \boldsymbol{E}_{6s-6} & \textbf{0}_{\left(6s-6\right)\times \left(12s+5\right)}\\[4pt] \textbf{0}_{3\times \left(6s-5\right)} & \boldsymbol{E}_{3} & \textbf{0}_{3\times \left(12s+2\right)}\\[4pt] \textbf{0}_{1\times \left(6s-2\right)} & \frac{R_{2}\left(1,2\right)}{R_{2}\left(2,2\right)} & \textbf{0}_{1\times \left(12s+1\right)}\\[4pt] \textbf{0}_{1\times \left(6s-2\right)} & 1 & \textbf{0}_{1\times \left(12s+1\right)}\\[4pt] \textbf{0}_{\left(6s-6\right)\times \left(6s-1\right)} & \boldsymbol{E}_{6s-6} & \textbf{0}_{\left(6s-6\right)\times \left(6s+7\right)}\\[4pt] \textbf{0}_{3\times \left(12s-7\right)} & \boldsymbol{E}_{3} & \textbf{0}_{3\times \left(6s+4\right)}\\[4pt] \textbf{0}_{1\times \left(12s-4\right)} & \frac{R_{3}\left(1,2\right)}{R_{3}\left(2,2\right)} & \textbf{0}_{1\times \left(6s+3\right)}\\[4pt] \textbf{0}_{1\times \left(12s-4\right)} & 1 & \textbf{0}_{1\times \left(6s+3\right)}\\[4pt] \textbf{0}_{\left(6s-6\right)\times \left(12s-3\right)} & \boldsymbol{E}_{6s-6} & \textbf{0}_{\left(6s-6\right)\times 9}\\[4pt] \textbf{0}_{3\times \left(18s-9\right)} & \boldsymbol{E}_{3} & 6\\[4pt] \textbf{0}_{6\times \left(18s-6\right)} & \boldsymbol{E}_{6} & \end{array}\right] \end{equation}
Finally, the complete dynamic governing equation is obtained as follows:
 \begin{equation} \boldsymbol{M}\ddot{\boldsymbol{U}}+\boldsymbol{KU}=\boldsymbol{F} \end{equation}
where K = Q T K r Q is the overall stiffness matrix and M = Q T M r Q is the overall mass matrix.
Ref. [Reference Zhang, Zhao and Ceccarelli15] only considers the deformation coordination between the moving platform and limbs, and the boundary conditions between limbs and the base are ignored by comparing the dynamic equation. The combination of constraint equations and Lagrangian multipliers is considered in the dynamic equation in ref. [Reference Wu, Wang and Liu17]. The main contribution of the work is to eliminate the constraint equation and Lagrangian multiplier from the dynamic equation, which is the essential difference from refs. [Reference Zhang, Zhao and Ceccarelli15, Reference Wu, Wang and Liu17]. Meanwhile, the obtained dynamic control equation is more concise. It considers all the kinematic constraints of the mechanism, which can better simulate the constraints of the mechanism.
Manipulator’s natural frequency is calculated as follows:
 \begin{equation} \left(\boldsymbol{K}-\omega _{i}^{2}\boldsymbol{M}\right)\boldsymbol{\Phi }_{i}=\textbf{0} \end{equation}
where ω i and Φ i are the ith order circular frequency (rad/s) and corresponding mode of the manipulator, respectively.
Hz is used to express the frequency of the manipulator in engineering [Reference Yang, Ye and Li27]:
 \begin{equation} f_{i}=\frac{\omega _{i}}{2{\pi} } \end{equation}
where f i is the ith order natural frequency (Hz) of the manipulator.
3.3. Natural frequency verification and distribution in the regular workspace
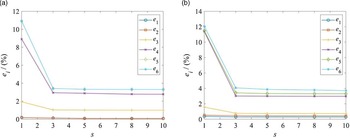
The MPC184 element is used to simulate the perfect rigid S- and R- joints. In this paper, two configurations are used based on whether the mechanism is circular symmetry [Reference Yan, Ong and Nee29] to verify the theoretical model (Case 1: z = 4.9 m, φ = 0°, and θ = 0°; Case 2: z = 4.9 m, φ = 10°, and θ = -12°). Figure 3 shows the line chart between the relative error and the number of elements s, and e i is the relative error of the ith natural frequency between the theoretical method and the FEM. Increasing the number of elements does not significantly improve the calculation accuracy of the first-order natural frequency. Even if the rod is discretized into only one element, an acceptable calculation accuracy of 0.18% for case 1 and 0.36% for case 2 can be obtained. When the number of elements increases to three, the third-order natural frequency achieves an acceptable convergence accuracy of 1.03% for case 1 and 0.77% for case 2, and the fourth- to sixth-order natural frequencies quickly converge to 2.94, 3.41, and 3.41% for the case 1, 3.01, 3.31, and 3.90% for case 2, respectively. Therefore, the number of rod elements is considered as three in the work.
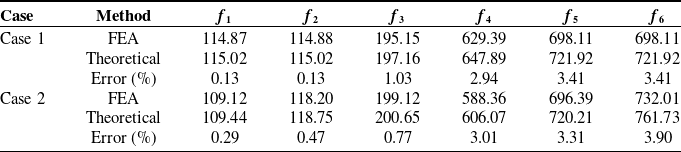
Natural frequencies comparison between the FEA and analytical model of the 3-RPS PM.

Line chart between relative error and the number of elements. (a) case 1 and (b) case 2.

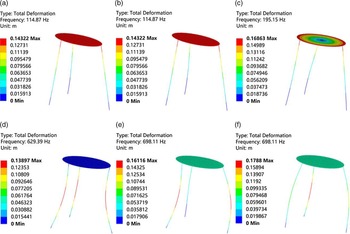
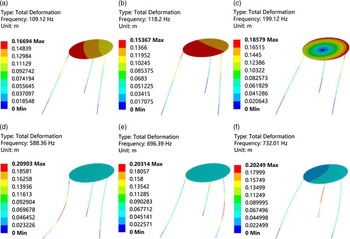
Table I shows that the maximum errors of the fourth-, fifth-, and sixth-order natural frequencies are 3.01, 3.41, and 3.90%, respectively. However, the maximum errors of the first three-order natural frequencies are within 1.03%. Especially, the maximum error of the first-order natural frequency is only 0.29%, which verifies the correctness of the analytical model. Figures 4–5 show the finite-element analysis results for cases 1 and 2, respectively. Compared with the computational cost of the finite-element model in 6.16 s, the theoretical model proposed in the work only takes 0.82 s, which saves 86.69% of the computational cost. Note that the moving platform shown in Figs. 4–5 is considered the elastic body with the elasticity modulus close to the rigid body to ensure the quality of the graphics. The ANSYS Workbench code is uploaded to support the correctness of the proposed theoretical modelFootnote 1.
Finite-element analysis of case 1. (a)–(f): f 1 –f 6..

Finite-element analysis of case 2. (a)–(f): f 1– f 6..

The constraints of the 3-RPS PM are considered as follows to analyze the regular workspace of the mechanism:
 \begin{equation} \left\{\begin{array}{l} L_{\min }\leq L_{i}\leq L_{\max }\\[4pt] \left| \alpha _{i}\right| \leq \alpha _{\max }\\[4pt] \,\left| \beta _{i}\right| \leq \beta _{\max } \end{array}\right. \end{equation}
where L max = 1 m and L min = 0.2 m are the upper and lower limits of the actuator, α i and β i the rotation angles of the spherical and revolute joints, and α max and β max is the maximum rotation angle of spherical and revolute joints.
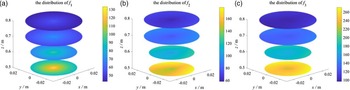
The polar coordinate method [Reference Yang, Li and Chen28] is used to obtain the regular workspace, namely the circular truncated cone composed of the largest inscribed circle in each layer of the reachable workspace. The distribution of natural frequencies are circularly symmetrical (Fig. 6), which is consistent with the structure of the manipulator. Besides, the increased platform height decreases the natural frequency of the mechanism. Therefore, the 3-RPS PM should work at a low height to improve its dynamic performance.
Distribution of the first three natural frequencies of the 3-RPS PM in the regular workspace.

4. Conclusions
A 3-RPS PM was used as an example to propose an elastodynamic modeling and natural frequency analysis method based on the substructure synthesis method in this work. Multipoint constraint theory, linear algebra, and singularity analysis were used to identify the global independent displacement coordinates of the manipulator. After that, the elastodynamic model of the 3-PRS PM was established with substructure synthesis technology. The dynamic model including all kinematic constraints of the manipulator could achieve high solution efficiency because kinematic constraint equations or Lagrangian multipliers were not required. Compared with the FEA results, the maximum errors of the first three-order and first-order natural frequencies were less than 1.03 and 0.29%, respectively. The natural frequencies were circularly symmetric in the regular workspace and decreased with the increased platform height. The dynamic displacement response will be studied to improve the elastodynamics modeling, and some experiments will be conducted to verify the effectiveness of the proposed model in the future work.
Data availability statement
The corresponding author can provide relevant paper data.
Author contributions
GONG Yaping was responsible for the study ideas, and LOU Junbin prepared the draft.
Funding
The work was funded by the Horizontal Topic of Finite Element Analysis and Design Optimization of Key Components of Paper-Plastic Equipment (Grant No. 00520104).
Competing interests
It is confirmed that no conflict of interest exists.