










1. Introduction
Glaciers play a central role in the Earth’s environment, regulating sea-level rise, freshwater availability and regional climate feedbacks. Globally, glaciers are responding to atmospheric warming with high sensitivity, rendering them valuable sentinels of ongoing climate change. The Canadian Arctic Archipelago (CAA) encompasses over  $146\,000\,\mathrm{km}^2$ of glacierized terrain—ranking third in global land-ice area after Greenland and Antarctica—and contributes approximately 20% of the world’s glacier area outside the major ice sheets (Randolph Glacier Inventory Consortium, 2017). Accelerated mass loss in the CAA over recent decades has been driven largely by anomalously warm summer temperatures, positioning this region as the third-largest contributor to contemporary sea-level rise (Box and others, Reference Box2018; Noël and others, Reference Noël, van de Berg, Lhermitte, Wouters, Schaffer and van den Broeke2018; Hock and others, Reference Hock2019; Tepes and others, Reference Tepes, Gourmelen, Nienow, Tsamados, Shepherd and Weissgerber2021).
Surface mass balance, the net difference between annual accumulation and ablation, provides a direct measure of glacier sensitivity to atmospheric forcing (Oerlemans and others, Reference Oerlemans1998; Vincent, Reference Vincent2002). While the CAA hosts one of the earlier networks of long-term glacier mass balance records in the Arctic, these observations are spatially skewed, largely concentrated north of  $74^{\circ}\mathrm{N}$. This spatial bias leaves substantial gaps in our understanding of glacier mass and elevation changes on Baffin and Bylot Islands (BBI), where long-term in situ measurements remain sparse. This data deficiency hampers efforts to constrain regional mass loss estimates and impacts the accuracy of climate model calibrations that rely on glacierized terrain as sensitive climate proxies (Box and others, Reference Box2018).
The environmental changes unfolding across the BBI region have far-reaching consequences, not only for global sea-level budgets, but also for Arctic ecosystems, Indigenous cultural landscapes and national parks infrastructure. In particular, the increasing frequency and magnitude of glacially induced geohazards (e.g. proglacial lake outburst floods, slope instabilities) represent tangible risks for Inuit communities and national park visitors. Consequently, expanding glacier mass balance observations and investigating their spatiotemporal variability on BBI is necessary for refining our understanding of past and present climate fluctuations and projecting future impacts at both regional and global scales (Vallon and others, Reference Vallon, Vincent and Reynaud1998; Vincent, Reference Vincent2004).
While previous research in Auyuittuq National Park and Sirmilik National Park has provided valuable insight at a regional scale, these studies often lack high-resolution, long-term analyses of glacier-specific mass and elevation changes. Such localized analyses are crucial to disentangle the heterogeneous responses of individual glaciers to climate forcing. For example, Schaffer and others (Reference Schaffer, Copland, Zdanowicz and Hock2023) modelled the surface mass balance (SMB) of the Penny Ice Cap, highlighting sensitivity to regional temperature anomalies. Similarly, Noël and others (Reference Noël, van de Berg, Lhermitte, Wouters, Schaffer and van den Broeke2018) examined six decades of glacial mass loss across the CAA using regional climate models, emphasizing the importance of climate forcing at broad spatial scales. Gardner and others (Reference Gardner2011) utilized airborne and satellite altimetry to assess elevation changes across the CAA, revealing considerable variability among individual glaciers. More recently, Hugonnet and others (Reference Hugonnet2021) applied high-resolution remote sensing to document widespread glacier thinning throughout the Arctic over 2000–19. Despite these advances, comprehensive and long-term assessments of mass and elevation change at the individual glacier level within the two parks remain limited, underscoring the need for localized glacier-scale observations to complement regional analyses and modelling efforts.
Historical aerial imagery offers a means to extend the temporal and spatial coverage of glacier change detection through geodetic mass balance analysis. This approach is particularly valuable in Arctic regions where in situ data are often sparse or entirely absent. Numerous studies have demonstrated the utility of historical imagery for quantifying long-term glacier change in the Arctic, typically focusing on individual glaciers with accessible stable terrain to constrain vertical uncertainty estimates (Holmlund, Reference Holmlund2021; Cheung, Reference Cheung2022; Knuth and others, Reference Knuth2023; Medrzycka and others, Reference Medrzycka, Copland and Noël2023). However, the characteristics of both parks pose significant challenges, including frequent cloud cover, rapid landscape evolution and high erosion rates, which can exacerbate uncertainties in photogrammetric analyses (Knuth and others, Reference Knuth2023). Furthermore, archival imagery often suffers from quality issues, such as film degradation, scanning artefacts and limited metadata, which complicate efforts to achieve high geometric fidelity. As noted by Piermattei and others (Reference Piermattei2026), rigorous evaluation and optimization of photogrammetric workflows are essential for deriving reliable elevation change measurements from historical stereo imagery.
To address these knowledge gaps, this study reconstructs a 65 year record of glacier geometry and volume change for selected glaciers within Auyuittuq and Sirmilik National Park using historical aerial imagery and Digital Elevation Model (DEM) differencing. Specifically, the objectives are to:
1. Quantify Long-Term Glacier Change: Estimate glacier-wide changes in mass, areal extent and centreline length from 1958/59 to 2023.
2. Evaluate Spatial Variability: Investigate spatial patterns and regional variability in glacier volume loss across the Baffin and Bylot Island region.
By extending the observational record beyond the satellite era and generating glacier-specific mass change data, this study has the potential to refine surface mass balance models, support geohazard assessments and inform climate adaptation planning for Arctic communities and ecosystems.
2. Study site
This study focuses on a suite of glaciers located within Sirmilik National Park on Bylot Island and Auyuittuq National Park on Baffin Island, Nunavut, Canada, shown in panels b and c, respectively, of Fig. 1 (see also Table 1). Both parks contain extensive valley glaciers and ice caps influenced by a polar maritime climate.
Study area and historical image coverage for glacier fluctuations analysis in Nunavut’s Sirmilik and Auyuittuq National Parks. (a) Overview map showing the number of overlapping historical aerial photographs per hexagon, with glacier outlines in red and park boundaries in green. (b) Detailed view of Sirmilik National Park. (c) Auyuittuq National Park, highlighting the glacier outlines analysed. Background imagery in panels (b) and (c) consists of 2023 Sentinel-2 false-colour composites (bands 8–4–3: near-infrared, red, green), optimized to enhance contrast between glacier ice, snow and surrounding terrain.

Figure 1 Long description
A) The overview map of Nunavut, Canada, displays the number of overlapping historical aerial photographs per hexagon, with glacier outlines in red and park boundaries in green. The map highlights the Arctic Ocean and Baffin Bay regions. B) The detailed map of Sirmilik National Park shows glacier outlines in blue, with a scale indicating distances from 0 to 10 kilometers. C) The map of Auyuittuq National Park also highlights glacier outlines in blue, with a similar scale. Both detailed maps use 2023 Sentinel-2 false-color composites to enhance contrast between glacier ice, snow and surrounding terrain. The legend indicates the number of overlapping images, ranging from 0 to over 600, with a gradient scale. The maps emphasize the study of glaciers within these national parks, marked as study glaciers in blue.
Key glacier characteristics in Auyuittuq (ANP) and Sirmilik (SNP) National Parks derived from RGI v7 (nominal year 2000) outlines.

Table 1 Long description
The table lists glacier name, RGI identifier, area, minimum and maximum elevation, mean slope, and aspect for seven glaciers in Auyuittuq National Park and two in Sirmilik National Park. Areas range from 12.36 to 223.86 square kilometers, with Sermilik Glacier in Sirmilik the largest by a wide margin, followed by Highway Glacier in Auyuittuq at 93.97 square kilometers. The smallest areas are Nakarpog Glacier at 12.36 square kilometers and Caribou Glacier at 12.68 square kilometers, both in Auyuittuq. Elevation minima range from 11 meters at Sermilik Glacier to 663 meters at Nerutusoq Glacier, while elevation maxima range from 1673 meters at Nerutusoq to 2188 meters at Norman Glacier. Slopes are broadly similar across glaciers, from 9.9 degrees at Rundle Glacier to 16.6 degrees at Caribou Glacier. Aspects vary widely, with examples including near north for Rundle at 10 degrees, near east for Turner at 78 degrees, near south for Sermilik at 178 degrees, and near west for Fountain at 215 degrees. Values are derived from a single inventory snapshot and summarize glacier-wide characteristics, so they do not capture seasonal or recent changes.
Areas are in  $\mathrm{km}^2$; elevations in m a.s.l.; slopes and aspects in degrees.
2.1. Auyuittuq National Park (ANP)
Auyuittuq, meaning ‘the land that never melts’ in Inuktitut, hosts the Penny Ice Cap, the largest ice mass in the southern Canadian Arctic Archipelago, as well as numerous independent glacier catchments distributed around its periphery. This study targets seven glaciers—Caribou, Turner, Norman, Highway, Nakarpog, Nerutusoq and Rundle—aligned west to east along the Akshayuk Pass. This culturally significant travel corridor between Pangnirtung and Qikiqtarjuaq is a popular trekking route which attracts approximately 250 visitors annually and transects the park’s glaciated landscape.
The selected glaciers span surface areas ranging from 12 to  ${94}\,\mathrm{km}^2$ and elevations from 360 to 2190 m a.s.l. (Table 1). Mean surface slopes vary between
 $9.9^{\circ}$ and
 $16.6^{\circ}$, while aspects range from
 $9.6^{\circ}$ to
 $355.4^{\circ}$, modulating differential solar radiation receipt and influencing ablation dynamics.
The regional climate is classified as polar marine, characterized by prolonged, cold winters and brief, cool summers. Data from the Owl River automatic weather station (AWS; 66.88 $^{\circ}$N, 64.70
 $^{\circ}$W) for the 2012–23 period yield a mean annual air temperature of
 $-9.8^{\circ}\mathrm{C}$, with absolute extremes of
 $-41.6^{\circ}\mathrm{C}$ and
 $+16.7^{\circ}\mathrm{C}$. Persistent relative humidity exceeding 70% reflects the maritime influence of Baffin Bay. The melt season in Auyuittuq National Park typically occurs from late May to early September, based on the Sentinel-1 SAR analysis described in Section 4.7.
2.2. Sirmilik National Park (SNP)
Sirmilik, meaning ‘place of glaciers’ in Inuktitut, National Park exists on Bylot Island adjacent to Lancaster Sound. The island’s extensive  ${4500}\,{\mathrm{km}^2}$ icefield sustains numerous outlet and valley glaciers, two of which—Fountain Glacier and Sermilik Glacier—are the focus of this study. These glaciers span elevations from 11.17 to 1810.80 m a.s.l. and surface areas of 33.96 and
 ${223.86}\,{\mathrm{km}^2}$, respectively (Table 1).
Sermilik Glacier, one of the largest and most dynamic glaciers on Bylot Island, flows southward from the central icefield towards Eclipse Sound near Mittimatalik (Pond Inlet). Using a late-season snow-line altitude (SLA) of 1100 m as an equilibrium-line altitude (ELA) proxy, about 58.18% of the surface ( ${132}\,{\mathrm{km}^2}$) lies in the accumulation area. The terminus is low, 5th-percentile elevation 156 m a.s.l. (local minimum is 1 m a.s.l.) and 10.25% of the glacier (
 $23\,{\mathrm{km}^2}$) sits below 300 m a.s.l.. This combination of a broad high-elevation accumulation area and a low-elevation tongue makes Sermilik particularly sensitive to summer melt and rain-on-snow events. Its visual prominence from Mittimatalik has also made it a geographical landmark and source of artistic inspiration; notably, Group of Seven artist Lawren Harris depicted the glacier in his Arctic landscape paintings.
Fountain Glacier is a smaller polythermal glacier, distinguished by a cold-based margin insulating a temperate core (Fountain and Walder, Reference Fountain and Walder1998). This thermal regime facilitates the buildup of subglacial water pressure, which periodically discharges to form extensive proglacial icings, known as ‘aufeis’, a rare but well-documented feature in Arctic glacier systems (Fountain and Walder, Reference Fountain and Walder1998; Wainstein and others, Reference Wainstein, Moorman and Whitehead2014). In 2023, a collaborative initiative with Parks Canada and ICElab at Queen’s University established a glaciological monitoring network on Fountain Glacier. Seven ablation stakes were installed across an elevational range of 50–1400 m, supplemented by an automatic weather station positioned at the highest site ( $73.055^{\circ}\,\mathrm{N}$,
 $78.412^{\circ}\,\mathrm{W}$).
The climate of Sirmilik National Park is marked by extreme seasonality and precipitation, typical of the High Arctic. Long-term meteorological observations from the Qarlikturvik Valley, collected since 1994 by the Centre d’études nordiques (CEN) (2024), indicate a mean annual air temperature of  ${-14.4}^{\circ}\mathrm{C}$. February is the coldest month (
 ${-34.8}^{\circ}\mathrm{C}$), while July is the warmest (
 ${6.4}^{\circ}\mathrm{C}$). Seasonal averages range from
 ${-32.4}^{\circ}\mathrm{C}$ in winter (December–February) to
 ${4.7}^{\circ}\mathrm{C}$ in summer (June–August). Precipitation is modest, with average summer rainfall (June 1 to August 17) of 77.5 mm, peaking in July at 36.9 mm.
3. Data
3.1. Historical aerial images
This study utilized 48 aerial images from the National Air Photo Library (NAPL), covering 2473.57 km $^2$ in Auyuittuq National Park and 767.76 km
 $^2$ in Sirmilik National Park. NAPL’s archive comprises over six million aerial photographs documenting Canada’s landscapes since the 1920s (Fig. 1). Captured between 1958 and 1962 by Spartan Air Services Limited during high-altitude surveys for the Distant Early Warning Line project, these images provide a rare glimpse into long-term glacier changes in the Canadian Arctic.
The photographs were captured at a scale of 1:60 000 using  $9 \times 9$ inch (
 $22.86 \times 22.86$ cm) panchromatic film. A Wild Heerbrugg RC5a aerial camera, with a focal length of 152.51 mm for the Auyuittuq National Park image roll and 152.33 mm for the Sirmilik National Park image roll, was mounted on a fixed-wing aircraft equipped with a viewing port and manually operated. Most photographs were taken in a near-vertical (nadir) orientation, with a 60% overlap, enabling stereo coverage of the terrain in view. These scanned images are accessible via the Earth Observation Data Management System (EODMS) platform. For this study, only the images that covered the targeted glacier areas were processed (Table 2).
Summary of historical aerial-photograph rolls used for photogrammetric analysis in Auyuittuq (ANP) and Sirmilik (SNP) National Parks.

Table 2 Long description
The table summarizes two historical aerial-photograph rolls used for photogrammetric work in two national parks, listing roll number, image count, acquisition date, flight altitude above sea level, camera model, lens, and focal length in millimetres. Auyuittuq National Park includes roll A16817 with 36 images acquired 06 Sep 1959 at 29,965 feet ASL using an RC5A 235 camera with a 15 AG71 lens and a 152.51 millimetre focal length. Sirmilik National Park includes roll A16018 with 12 images acquired 30 Jun 1958 at 29,920 feet ASL using an RC5-311 camera with a 15 AG32 lens and a 152.33 millimetre focal length. Auyuittuq has three times as many images as Sirmilik in this summary. The flight altitudes are very similar, differing by only 45 feet, and both focal lengths are close to 152 millimetres. Altitude values reflect the original flight-log records and may not match modern measurement conventions.
Altitudes are recorded in feet Above Sea Level (ASL) as per original survey flight logs.
3.2. Image scanning, camera positions and calibration metadata
All 48 negative films were digitized at 8  $\mu$m resolution using Leica Geosystems DSW700 photogrammetric scanners to produce high-quality imagery for softcopy photogrammetric processing. Each scan was stored as an 8-bit greyscale Tagged Image File Format (TIFF) image with dimensions of approximately
 $20\,000 \times 20\,000$ pixels. Based on the original camera focal length and recorded flight altitudes ranging from 9065 to 9324 m a.s.l. (29,740–30,590 ft a.s.l.), the ground sample distance (GSD) of the original photography was estimated at
 $\sim$50cm.
Ancillary metadata—including flight altitude, image file name, roll number and camera specifications—were printed on the photograph borders and transcribed in the NAPL metadata files. All NAPL programme cameras underwent regular calibration, with calibration reports providing focal length, fiducial marker coordinates, lens distortion parameters and optical centre position. These parameters were applied to recover the interior orientation for this study.
Metadata were retrieved from the EODMS archive in comma-separated values (CSV) format, including acquisition date, geographic coordinates, altitude and camera parameters. The Python EODMS application programming interface (API) was used to extract all image metadata. These records were subsequently standardized for the photogrammetric workflow, which involved the manual organization of camera calibration parameters, focal lengths and flight altitudes into a format compatible with the Structure-from-Motion (SfM) software environment. This preparation ensured that the interior and exterior orientation parameters were correctly initialized during the initial image alignment phase.
3.3. Reference DEMs and modern satellite imagery
A tiered hierarchy of reference DEMs was utilized to ensure geodetic accuracy and coverage across the study period. ArcticDEM v4.1 (2 m resolution) served as the primary vertical reference for all elevation-change and geodetic mass balance calculations. In Auyuittuq National Park, the 2 m mosaic (2021–22) was leveraged to mitigate persistent data voids caused by steep topography and shadowing. Conversely, for Sirmilik National Park, individual 2 m ArcticDEM strips (2022) were used due to more continuous coverage in less rugged terrain (see Supplemental Table S2). Both ArcticDEM products have a reported vertical accuracy of approximately 4 m (Porter and others, Reference Porter2023).
Vertical estimates for Ground Control Points (GCPs) were selected from the TanDEM-X (12 m resolution) reference DEM for camera model refinement during photogrammetric reconstruction. While TanDEM-X provides a global absolute vertical accuracy of 2 m (Wessel and others, Reference Wessel, Huber, Wohlfart, Berkenbusch, Abelleira and Roth2018), its performance in high-relief glacierized terrain can be degraded by layover, shadowing and radar signal decorrelation. High-resolution PlanetScope imagery (3 m spatial resolution) was used to support horizontal GCP identification and visual alignment of stable terrain features. Thus, the horizontal positions of GCPs were identified using PlanetScope imagery, while the corresponding vertical estimates were extracted from the TanDEM-X reference DEM.
To assess the quality of the reference DEMs and enhance spatial analyses, additional reference datasets were evaluated. The Canadian Digital Elevation Model (CDEM), a 20 m product derived from historical photogrammetry and aerial photography (1945–2011), provided a baseline for long-term topographic change (Natural Resources Canada, 2013). The 2020 WorldView DEM for Auyuittuq National Park was used only as an auxiliary contemporary topographic consistency check and is discussed in the Supplement.
All datasets were reprojected to the relevant UTM zones for Auyuittuq and Sirmilik National Park. Although transverse Mercator projections can introduce distortion in high-latitude regions, the study extents are within  $ \lt 3^\circ$ of the relevant central meridians, yielding negligible scale distortion. All elevation datasets were referenced to WGS 84 mean sea level heights to maintain consistency with satellite-derived products and alignment over stable terrain. Because DEM differencing was performed within a common vertical datum, the geoid term cancels during elevation change (
 $\Delta h$) calculations, avoiding additional geoid-model uncertainty.
3.4. Meteorological records
Daily meteorological observations (1975–2020) were obtained from the Environment and Climate Change Canada (ECCC) Historical Climate Data portal (https://climate.weather.gc.ca/). Records from the Pangnirtung AWS in Auyuittuq National Park and the Pond Inlet AWS in Sirmilik National Park were used. Because of data gaps, a completeness filter was applied: calendar years with  $ \gt 30$ missing daily records were excluded. Seasonal metrics for June–August (JJA) and December–February (DJF) were computed only when the season contained
 $ \lt 10$ missing days; seasons with
 $\ge 10$ missing days were excluded.
4. Methods
The methodological framework of this study, illustrated in Fig. 2, is structured into six core steps: (1) reference DEMs quality assessment, (2) image preprocessing, (3) photogrammetric reconstruction, (4) co-registration with reference DEMs, (5) delineation of glacier outlines, area extent and centrelines from historical orthomosaics and contemporary satellite orthoimagery and (6) calculation of geodetic mass balance along with associated uncertainty assessment.
Workflow for glacier change analysis using photogrammetric reconstruction of historical aerial imagery. Green boxes denote input datasets; blue boxes indicate processing steps; red boxes are intermediate files; and yellow boxes represent final outputs used for snowline and mass-balance estimation.

Figure 2 Long description
The workflow for glacier change analysis using historical photogrammetry consists of six core steps: 1. Reference DEMs Quality Assessment (xDEM) involves ArcticDEM, TanDEM-X and others, focusing on DEM quality assessment, standard deviation calculation and QA metrics. 2. Image Preprocessing (HIPP/OpenCV 4.4) uses scanned NAPL historical imagery for standardized image sets. 3. Photogrammetric Reconstruction (Catalyst) includes image processing, bundle adjustment and alignment, using historical imagery and GCPs for orthomosaics and historical DEMs. 4. DEM Co-registration (DEMcoreg) involves historical DEMs and satellite terrain masks for co-registration and elevation analysis. 5. Outline Delineation (ArcGIS Pro/OGGM) uses historical orthomosaics and contemporary satellite imagery for glacier outlines, area extent and centrelines. 6. Geodetic Mass Balance and Uncertainty involves co-registered DEMs and ice density calculations for final geodetic mass balance estimates and uncertainties. Each step is connected with specific processes and outputs, including QA metrics, standardized image sets, orthomosaics, co-registered DEMs, glacier outlines and mass balance estimates.
4.1. Reference DEMs quality assessment
The accuracy of reference DEMs is a primary constraint on the reliability of both the 1958/1959 photogrammetric reconstruction and the subsequent multi-decadal DEM co-registration. Consequently, a systematic quality assessment of all contemporary elevation products was performed as the initial methodological step. This assessment utilized the xDEM Python package (v0.0.20), which facilitates robust evaluation of DEM consistency over stable, non-glacierized terrain (xDEM contributors, 2021).
Stable-terrain masks were generated by excluding all areas identified within the historical 1958/1959 glacier extents. By using the maximum historical ice limits as the exclusion mask, this multi-temporal approach ensured that GCPs were extracted only from surfaces that remained ice-free throughout the 65 year study period. This protocol effectively eliminated vertical biases that would otherwise be introduced by choosing points in areas of historical glacier cover that have since undergone retreat or thinning. Within these verified stable zones, vertical accuracy was quantified using the median elevation offset, the normalized median absolute deviation (NMAD) and the standard deviation (SD) of elevation residuals. These results informed the selection of the most geometrically consistent DEMs to serve as the vertical reference for GCP extraction and bundle adjustment.
4.2. Image preprocessing
Image preprocessing was performed to standardize the scanned historical aerial photographs prior to photogrammetric reconstruction. This step used the Python-based Historical Image Pre-Processing (HIPP) package, which uses OpenCV version 4.4 for image correction and enhancement (Knuth and others, Reference Knuth, Schwat, Shean and McNeil2021). HIPP was used to detect pseudofiducial or fiducial-like frame features, estimate the principal point, centre each image, enhance contrast and remove the outer photographic frame.
The preprocessing step produced cropped and contrast-enhanced images in which the non-image border information was reduced while the true fiducial markers required for formal photogrammetric registration were preserved. These HIPP-preprocessed images, together with EODMS metadata and camera calibration information, were subsequently imported into PCI Geomatics Catalyst for formal fiducial registration and photogrammetric reconstruction. This staged workflow was necessary because direct processing of the original scans in Catalyst was unreliable for several images owing to variable scanning quality, frame artefacts and low contrast.
4.2.1. Fiducial marker detection
The NAPL dataset includes four mid-side and four corner fiducial markers per image, defining the camera’s interior geometry (Fig. 3). These true fiducial markers have calibrated coordinates from the camera calibration reports and were therefore required for formal interior-orientation recovery in Catalyst.
Detection of fiducial markers in a mid-20th-century aerial photograph used for photogrammetric analysis. The red box highlights marginal metadata information, while the orange box identifies frame annotation artefacts that can degrade automated tie point detection and photogrammetric reconstruction. Yellow arrows indicate fiducial targets, with the inset showing an enlarged fiducial marker used for geometric registration. Accurate identification and registration of fiducial markers are essential for correcting lens distortion, maintaining internal geometric consistency and supporting spatial referencing during photogrammetric DEM reconstruction.

During preprocessing, HIPP was used to assist with marker detection and image standardization. Fiducial-marker templates were generated from representative images with minimal overexposure, dust or scratches. These templates, including both corner and mid-side markers, were used at native and upsampled resolutions ( $8\times$) to improve marker detection, principal point estimation and visual quality control. The final calibrated pixel-to-millimetre transformation, however, was performed in PCI Geomatics Catalyst using the preserved fiducial markers and the camera calibration coordinates.
4.2.2. Image enhancement
Image enhancement was conducted within HIPP, where contrast adjustments were applied to improve feature visibility in scans affected by variable exposure, shadows, snow-covered surfaces and scanning artefacts. Following the settings recommended by Knuth and others (Reference Knuth, Schwat, Shean and McNeil2021), these enhancements improved the visibility of fiducial markers and surface features, supporting more reliable subsequent tie-point detection, alignment and orthoimage generation in Catalyst.
4.2.3. Principal point determination and outer frame removal
The HIPP package calculated the principal point using all detected markers that passed quality control. At least two markers were required for estimation, with accuracy improving as more markers were successfully detected. Each image was then cropped to a fixed square area around the estimated principal point to remove the outer photographic frame and marginal non-image information.
Importantly, this cropping step did not remove the true four corner fiducial markers required for photogrammetric registration. The cropped image dimensions were selected so that the fiducial markers remained visible within the image grid. These standardized, frame-reduced images were then imported into PCI Geomatics Catalyst together with EODMS metadata and camera calibration parameters for formal fiducial registration and bundle adjustment.
4.3. Photogrammetric reconstruction
Photogrammetric processing was performed using PCI Geomatics Catalyst (Version 2023), a software suite optimized for image alignment, mosaicking and DEM generation from historical aerial imagery. Developed through a collaboration between the U.S. Geological Survey and the Canada Centre for Remote Sensing, Catalyst incorporates advanced algorithms, including tie-point matching, self-calibration, bundle adjustment and model refinement, for automated, high-precision orthorectification.
The reconstruction workflow comprised the following key steps:
1. Initial Georeferencing: The HIPP-preprocessed, frame-reduced images were imported into Catalyst. Metadata from the EODMS was used to estimate image coordinates. Lens-distortion parameters and fiducial-mark coordinates from the camera calibration report were entered. Images were rotated to a north-up orientation, and flight altitude and focal length were imported as plain-text (TXT) files for nominal georeferencing.
2. Fiducial Registration: Although HIPP was utilized for initial marker detection during preprocessing, the formal registration of fiducial marks was performed manually within the Catalyst. The preserved fiducial markers in the HIPP-preprocessed images were registered using the calibrated fiducial-marker coordinates from the camera calibration reports. This step provided the final affine pixel-to-millimetre transformation, recovered the camera interior orientation and maintained a maximum residual error below 0.2 pixels, providing a stable geometric foundation for the subsequent bundle adjustment.
3. Tie Points (TPs) Detection: An initial set of tie points was semi-manually collected and supplemented with automatically generated feature-based matches to facilitate coarse block adjustment. In areas with challenging terrain and sparse image features, additional TPs were added manually, though coverage in some sectors was limited to fewer than ten reliable TPs. TPs were placed on both glacier ice and stable, non-glaciated terrain to maximize spatial coverage and improve bundle adjustment robustness.
4. Alignment Refinement: Following several initial alignment iterations, GCPs and TPs exhibiting root mean square (RMS) errors greater than 10 pixels were excluded. Images lacking viable GCPs or TPs, such as those documented in the supplemental material, were also omitted from further processing.
5. Iterative Alignment: For each image, RMS errors of TPs and GCPs were inspected manually and outliers were removed. Alignment was repeated until the total RMS error in both X and Y directions was reduced to
 $\leq 2$ pixels.

Following final alignment, orthorectified historical imagery and DEMs were produced. Epipolar image pairs with maximum overlap were selected to generate geocoded DEMs at a spatial resolution of 2–4 m using semi-global matching (SGM), vertically referenced to mean sea level. For spatial reference, Auyuittuq National Park datasets were projected to WGS84 / UTM zone 20N (EPSG:32620), while Sirmilik National Park datasets were projected to WGS84 / UTM zone 17N (EPSG:32617). A low-smoothing filter was applied to preserve elevation detail.
4.4. Co-registration with reference DEMs
Following photogrammetric reconstruction, vertical alignment was refined by co-registering the historical DEMs to ArcticDEM v4.1 reference data. The co-registration processing chain follows established glaciological practices implemented via the xDEM Python package (xDEM contributors, 2021), using the sub-pixel offset correction proposed by Nuth and Kääb (Reference Nuth and Kääb2011). Co-registration and the characterization of residual errors were restricted to stable terrain. All glacier-covered pixels were excluded from the co-registration cost function; offsets were solved on stable terrain and subsequently applied scene-wide. Elevation-change estimates were then derived from differenced DEMs (dDEMs) within glacier masks. In this workflow, stable terrain serves to constrain sensor alignment and support quality assessment but is not interpreted as physical change.
Preprocessing All reference DEMs were reprojected to the coordinate reference system (CRS) of the historical datasets and resampled using bilinear interpolation to ensure pixel-wise correspondence. Spatial resolution was standardized across datasets—aggregated to  $4\,\text{m}$ for Auyuittuq National Park and
 $2\,\text{m}$ for Sirmilik National Park—to minimize the influence of high-frequency noise and improve the stability of the co-registration adjustment. This resampling approach enhanced both the reliability of the vertical-bias correction and the overall computational efficiency.
Stable-terrain mask Stable terrain was defined by excluding: (i) slope thresholds—in Auyuittuq National Park, pixels with slopes  $ \lt 5^\circ$ or
 $ \gt 30^\circ$ were removed to avoid geomorphically unstable flats (e.g. seasonally flooded valley floors) and steep slopes prone to occlusion; in Sirmilik National Park, terrain with slopes
 $\ge 30^\circ$ (up to
 $50^\circ$ where local relief warranted) was masked to minimize shadowing and slope-related artefacts; (ii) glacier extents—areas inside the 1958/59 glacier outlines; (iii) water bodies—rivers, lakes and coastal water; and (iv) outliers. Outliers were identified as dDEM residuals where
 $|\Delta z| \gt 3 \times \text{NMAD}$, where
 $\Delta z$ represents the elevation difference. Following Höhle and Höhle (Reference Höhle and Höhle2009), the NMAD was used as a robust estimator of elevation-error dispersion because it is less sensitive than the standard deviation to extreme residuals.
Co-registration procedure Following the application of the stable-terrain masks, DEM co-registration was performed using the sub-pixel offset correction method proposed by Nuth and Kääb (Reference Nuth and Kääb2011), as implemented in xDEM. To address more complex spatially varying vertical biases, a subsequent de-ramping step was applied using a second-degree polynomial surface (quadratic detrending). This allowed for the correction of residual tilts and warping across the DEM domain that often arise from systematic sensor distortions in historical photogrammetric datasets. Finally, the vertical alignment was centred by subtracting the median elevation offset, calculated over stable, ice-free terrain, from the entire elevation difference map.
Uncertainty estimation To quantify the vertical uncertainty in the dDEMs, a spatial inference analysis was performed on stable, ice-free terrain. Following the framework of Hugonnet and others (Reference Hugonnet, McNabb, Berthier, Menounos and Nuth2022), elevation-change uncertainty ( $\sigma_{\Delta z}$) was modelled as a heteroscedastic function of terrain slope and maximum curvature, utilizing the NMAD to minimize the influence of outliers (Höhle and Höhle, Reference Höhle and Höhle2009). To account for the spatial autocorrelation of these residuals, which prevents random errors from perfectly cancelling out during area-integration, the uncertainty of the mean elevation change (
 $\sigma_{\overline{\Delta z}}$) was computed by estimating the effective number of independent observations (
 $N_{eff}$):
 \begin{equation}
\sigma_{\overline{\Delta z}} = \sigma_{\Delta z} \sqrt{\frac{1}{N_{eff}}}
\end{equation}
where  $\sigma_{\Delta z}$ represents the spatially varying standard deviation derived from the stable-terrain NMAD.
 $N_{eff}$ is determined by the glacier area (
 $A$) and the range of spatial correlation (
 $L$), derived empirically through multi-range semivariogram analysis of the stable terrain (see Supplement Section 4).
4.5. Delineation of glacier outlines
Glacier outlines were manually delineated from historical orthomosaics and modern satellite images, adhering to the guidelines established by Paul and others (Reference Paul, Winsvold, Kääb, Nagler and Schwaizer2017). This process was conducted using ArcGIS Pro at a scale of 1:10 000, ensuring precise delineation. Following digitization, the primary surface area for each glacier polygon was calculated using Python-based geospatial libraries within a projected coordinate reference system. The resulting outlines were then ingested into the Open Global Glacier Model (OGGM v1.6) (Maussion and others, Reference Maussion, Rothenhäusler, Künzler and Huss2019) to facilitate automated centreline extraction.
To account for potential boundary errors introduced during manual digitization, a buffer of half a pixel width was applied to each glacier outline shapefile (Paul and others, Reference Paul, Winsvold, Kääb, Nagler and Schwaizer2017). This approach quantified the uncertainty in the delineation of glacier extent, providing an assessment of the accuracy of the inventory. All operations were implemented in Python (V 3.12.2) using code developed in this study.
4.6. Calculation of geodetic mass balance
Geodetic mass balance was computed by differencing co-registered reference and historical DEMs to obtain a raster of elevation change. A circular median filter (radius 30 pixels) was applied to suppress high-frequency noise, and robust outlier rejection was performed on the dDEM. Elevation-change values were then aggregated into fixed-width elevation intervals to support local analyses and to enable interpolation across voids (areas without valid elevations in either DEM due to limited image extent, terrain occlusion or cloud shadow).
Hypsometric interpolation followed McNabb and others (Reference McNabb, Nuth, Kääb and Girod2019). For glaciers with  $\ge 80\%$ valid dDEM coverage, a glacier-specific elevation–change relation was fit and applied to estimate
 $\Delta h$ within voids; interpolation was performed on a per-glacier basis.
Glacier outlines from 1958/59 were used as the spatial domain for calculating volume changes. While using the maximum historical area provides a conservative estimate of the area-averaged thinning rate, this approach may subdue the total mass change signal by up to 19% for the most rapidly retreating glaciers in the sample (Florentine and others, Reference Florentine, Sass, McNeil, Baker and O’Neel2023).
The total change in glacier volume  $\Delta V$ was calculated by summing the elevation change of each pixel
 $\Delta h$ multiplied by its area
 $A$:
 \begin{equation}
\Delta V = A_p \sum_{i=1}^{n} \Delta h_i
\end{equation}
where  $\Delta V$ is the total glacier volume change (m
 $^3$),
 $A_p$ is the area of a single pixel (m
 $^2$),
 $\Delta h_i$ is the elevation change of the
 $i$th pixel (m) and
 $n$ is the total number of valid pixels within the glacier outline.
This methodology enabled glacier-by-glacier geodetic mass balance estimation. Total geodetic uncertainty is then derived by combining the spatially averaged elevation error with the uncertainty in glacier area ( $\sigma_A$) and an assumed density uncertainty (
 $\sigma_{\rho}$), following standard error propagation rules as detailed in Section 5.2 of the Supplemental Material.
4.7. Melt season identification
To characterize the timing of the melt season, Sentinel-1 Synthetic Aperture Radar (SAR) data from 2014 to 2023 were examined over Auyuittuq National Park. Seasonal melt onset and persistence were inferred from the characteristic reduction in radar backscatter associated with wet snow conditions. This analysis was used only to contextualize the regional melt season and was not used directly in the geodetic mass balance calculations.
5. Results
5.1. Reference DEMs elevation differences across stable terrain
The inter-comparison of DEM datasets across stable terrain in Auyuittuq and Sirmilik National Park provides insight into the relative accuracy, temporal consistency and quality of reference DEM datasets, as well as evidence of long-term geomorphic evolution in these Arctic environments.
In Auyuittuq National Park, the comparison of modern DEM datasets highlights their high precision for contemporary terrain analysis. The ArcticDEM Mosaic (2011–22) and TanDEM-X (2011–14) datasets (Fig. 4a) exhibit a median elevation difference of 0.36 m, and an NMAD of 2.78 m. This close agreement reflects the robustness of current spaceborne photogrammetric and interferometric methods in resolving fine-scale topographic variation with minimal systematic bias. However, localized deviations exceeding 20 m occur on steep slopes, likely due to terrain-induced distortions and shadowing effects.
Elevation differences between reference Digital Elevation Models (DEMs) over stable terrain in Auyuittuq National Park (Nunavut, Canada). Glacierized areas (1959 inventory) are masked and outlined in black for reference. Panels show pairwise differencing (source $_1$ minus source
 $_2$): (a) ArcticDEM (2021/2022) – TanDEM-X (2011–14). (b) ArcticDEM (2021/2022) – CDEM (1958. (c) ArcticDEM (2021/2022) – WorldView DEM (2020). (d) TanDEM-X (2011–14) – CDEM (1958).

Figure 4 Long description
A) The map shows elevation differences between ArcticDEM (2021/2022) and TanDEM-X (2011–2014) in Auyuittuq National Park, Nunavut, Canada. Glacierized areas from the 1959 inventory are outlined in black. The legend indicates elevation differences in meters, with a median of 0.36 m, standard deviation of 2.78 m and NMAD of 2.78 m. B) Elevation differences between ArcticDEM (2021/2022) and CDEM (1958) are shown. The median difference is 5.06 m, standard deviation is 8.25 m and NMAD is 2.89 m. C) The map compares ArcticDEM (2021/2022) with WorldView DEM (2020), showing a median difference of 0.23 m, standard deviation of 2.27 m and NMAD of 2.18 m. D) Elevation differences between TanDEM-X (2011–2014) and CDEM (1958) are displayed, with a median of 3.20 m, standard deviation of 10.81 m and NMAD of 12.80 m. Each map uses a consistent scale bar of 15 km for reference.
By contrast, comparisons involving the historical CDEM (1959) reveal substantial long-term changes. Relative to ArcticDEM (2021/22), CDEM shows a median elevation difference of 5.00 m (SD = 25.18 m, NMAD = 8.90 m) (Fig. 4b), with the largest positive differences along the Weasel River in the Akshayuk Pass region, an area of known geomorphic change. These differences may reflect cumulative effects of landscape lowering through erosion and periglacial processes over the 64 year interval. A comparison between TanDEM-X (2011–14) and CDEM (1959) (Fig. 4d) yields a median difference of 2.30 m (SD = 83.90 m, NMAD = 12.90 m), with deviations particularly pronounced in areas of high topographic relief. The larger dispersion in this pairing reflects both true surface change and differences in sensor characteristics and data quality.
The auxiliary comparison between ArcticDEM and the 2020 WorldView DEM is reported in the Supplement Section, as this dataset was not used for final geodetic mass balance calculations.
In Sirmilik National Park, DEM comparisons indicate overall terrain stability, with localized glacier-proximal changes. The ArcticDEM (2022)–TanDEM-X (2011–14) pairing (Fig. 5a) shows a median elevation difference of  $-1.60$ m, an SD of 3.24 m and an NMAD of 1.62 m. Discrepancies are concentrated near glacier boundaries and are likely associated with recent glacier retreat or sediment redistribution in proglacial areas, while stable terrain away from ice margins exhibits minimal change. These results demonstrate the reliability of modern DEMs for detecting subtle elevation changes over decadal timescales.
Elevation differences between reference Digital Elevation Models (DEMs) over stable terrain in Sirmilik National Park (Nunavut, Canada). Glacierized areas (1958 inventory) are masked and outlined in black for reference. Panels show pairwise differencing (source $_1$ minus source
 $_2$): (a) ArcticDEM (2022) – TanDEM-X (2011–14). (b) ArcticDEM (2022) – CDEM (1958). (c) TanDEM-X (2011–14) – CDEM (1958).

Figure 5 Long description
A) The map shows elevation differences between ArcticDEM (2022) and TanDEM-X (2011–2014) in Sirmilik National Park, Nunavut, Canada. The median difference is minus 1.60 meters, with a standard deviation of 3.24 meters and a normalized median absolute deviation (NMAD) of 1.62 meters. Glacier outlines from 1958 are marked in black. B) The map compares ArcticDEM (2022) with CDEM (1958), showing a median difference of minus 2.65 meters, a standard deviation of 7.68 meters and an NMAD of 5.79 meters. C) The map displays differences between TanDEM-X (2011–2014) and CDEM (1958), with a median of minus 0.45 meters, a standard deviation of 9.32 meters and an NMAD of 3.05 meters. The legend indicates elevation differences in meters, with blue representing negative changes and red positive changes. Glacier outlines are consistent across all maps, highlighting areas of change near glacier boundaries.
In contrast, TanDEM-X (2011–14)–CDEM (1958) (Fig. 5c) shows a smaller median difference of  $-0.64$ m (SD = 5.32 m, NMAD = 3.05 m), with residuals likewise clustered along coasts and steep slopes. This pattern indicates that much of the offset arises from terrain-dependent errors and inter-dataset biases rather than widespread recent surface change, consistent with the overall stability of non-glaciated terrain in Sirmilik National Park over the last decade.
The contrasting patterns between Auyuittuq and Sirmilik National Park indicate regional differences in terrain dynamics and glacier influence that are consistent with variations in topography and geomorphic setting. Auyuittuq National Park exhibits larger offsets and greater dispersion, especially in comparisons involving the historical CDEM (1959), for example ArcticDEM (2021–22)–CDEM (median = 5.00 m, NMAD = 8.90 m) and TanDEM-X (2011–14)–CDEM (median = 2.30 m, NMAD = 12.90 m). The heightened variability in Auyuittuq National Park is concentrated along steep slopes and active valley corridors (e.g. the Weasel River), and likely reflects a combination of terrain-dependent DEM errors and long-term geomorphic modification (erosion, mass wasting and sediment redistribution). In contrast, Sirmilik National Park shows smaller elevation differences and lower scatter, for example ArcticDEM (2022)–CDEM (median =  $-2.65$ m, NMAD = 5.79 m) and TanDEM-X (2011–14)–CDEM (median =
 $-0.64$ m, NMAD = 3.05 m), indicating a more subdued geomorphic response overall, with residuals primarily confined to coastal zones and steep slopes.
5.2. Photogrammetric uncertainty and DEM coregistration
Photogrammetric precision and the performance of DEM coregistration methods differ markedly between Auyuittuq and Sirmilik National Park. In Auyuittuq National Park, the complex topography, steep slopes and extensive glacier margins contribute to larger photogrammetric uncertainties, with GCPs yielding RMS errors of 4.59 pixels in  $X$ and 4.82 pixels in
 $Y$ (Table 3). TPs exhibit smaller RMS errors (0.89 pixels in
 $X$ and 0.73 pixels in
 $Y$), but their spatial distribution is less uniform in glacierized and high-relief areas. In Sirmilik National Park, simpler topography and a denser, more evenly distributed network of GCPs and TPs result in lower RMS errors for both point types (Table 3), underscoring the importance of high-quality, well-distributed ground control for minimizing planimetric error in DEM reconstruction.
Root-mean-square (RMS) errors in pixels for  $X$ and
 $Y$ coordinates derived from ground control points (GCPs) and tie points (TPs) in Auyuittuq National Park (1959) and Sirmilik National Park (1958), Canada.

Table 3 Long description
The table reports root-mean-square pixel errors for horizontal and vertical image coordinates from a photogrammetric adjustment, summarized by park, year, and point type. In Auyuittuq in 1959, ground control points number 157 with RMS errors of 4.59 pixels in the horizontal coordinate and 4.82 pixels in the vertical coordinate, while tie points number 1174 with 0.89 and 0.73 pixels. In Sirmilik in 1958, ground control points number 73 with 3.71 and 2.61 pixels, while tie points number 953 with 0.92 and 1.04 pixels. Across both parks, tie points consistently show much smaller errors than ground control points. Ground control point errors are higher in Auyuittuq than in Sirmilik for both coordinates, while tie point errors are similar between parks and remain close to 1 pixel. Values reflect residuals from the adjustment and should be interpreted as internal fit rather than a complete measure of absolute positional accuracy.
RMS values were computed from the photogrammetric adjustment residuals.
In Auyuittuq National Park, uncorrected DEMs show substantial vertical offsets, with a median stable-terrain elevation difference ( $\Delta h$) of 4.32 m, an SD of 7.10 m and an NMAD of 6.12 m (Table 4; Fig 6). Application of the Nuth and Kääb (Reference Nuth and Kääb2011) method reduces the median
 $\Delta h$ to 0.00 m and the NMAD to 5.68 m, with corresponding horizontal translations of 4.37 m in
 $X$ and
 $-4.03$ m in
 $Y$, and a vertical shift of 4.06 m. Subsequent deramping correction reduces the median to 0.74 m and the NMAD to 4.09 m, and a final vertical shift adjustment brings the median to 0.00 m while retaining the NMAD of 4.09 m. These results illustrate that, in high-relief terrain, sequential application of coregistration steps is essential for mitigating systematic vertical and horizontal biases.
Sequential digital elevation model (DEM) co-registration and bias correction workflow in Auyuittuq (ANP) National Park, Canada. Panels illustrate the elevation difference (dDEM) at each processing step: (a) the initial, uncorrected dDEM; (b) after applying a 3D co-registration following Nuth and Kääb (Reference Nuth and Kääb2011); (c) following a second-order polynomial deramping to mitigate spatial along- and cross-track biases; and (d) the final dDEM after applying a residual vertical shift. Inset statistics display the median, standard deviation (SD) and normalized median absolute deviation (NMAD) over stable, ice-free terrain.

Figure 6 Long description
Initial dDEM A four-part map figure with four raster maps and one shared vertical color scale labeled Elevation Difference (m). The scale ranges from minus 30 to 30, with labeled ticks at minus 30, minus 20, minus 10, 0, 10, 20 and 30. The image A showing a raster elevation-difference map with an inset labeled Stable Terrain. The inset lists Med: 4.32 m, SD: 7.10 m, NMAD: 6.12 m. The image B showing a raster elevation-difference map with an inset labeled Stable Terrain. The inset lists Med: 0.00 m, SD: 7.03 m, NMAD: 5.68 m. The image C showing a raster elevation-difference map with an inset labeled Stable Terrain. The inset lists Med: 0.74 m, SD: 6.26 m, NMAD: 4.09 m. The image D showing a raster elevation-difference map with an inset labeled Stable Terrain. The inset lists Med: 0.00 m, SD: 6.26 m, NMAD: 4.09 m. A scale bar labeled 10 km appears near the bottom of the figure.
Translation parameters ( $X$,
 $Y$,
 $Z$ in m) and stable-terrain elevation differences (
 $\Delta h$ in m) for various coregistration methods in Auyuittuq (ANP) and Sirmilik (SNP) National Parks, Canada.

Table 4 Long description
The table reports horizontal and vertical translation offsets and stable-terrain elevation difference statistics for several coregistration methods in two Canadian parks. For Auyuittuq, no correction has a median stable-terrain difference of 4.32 m with SD 7.10 m and NMAD 6.12 m. The Nuth and Kääb method applies translations of 4.37 m in X, -4.03 m in Y, and 4.06 m in Z, yielding a median of 0.00 m with SD 7.03 m and NMAD 5.68 m. Deramping and the vertical shift by median both use a Z shift of 0.74 m and report SD 6.26 m and NMAD 4.09 m; the vertical shift row also reports a median of 0.00 m. For Sirmilik, no correction has a median of -1.99 m with SD 2.57 m and NMAD 2.28 m. The Nuth and Kääb method uses translations of 0.06 m in X, 0.36 m in Y, and -1.95 m in Z, producing a median near zero at -0.01 m with SD 2.57 m and NMAD 2.27 m. Deramping and the vertical shift by median both use a Z shift of -0.08 m and report SD 2.22 m and NMAD 2.08 m, with the vertical shift row listing a median of 0.00 m. Overall, the methods mainly reduce median bias toward zero, while spread metrics change modestly and are not always reported for every method.
In Sirmilik National Park, initial misalignments are considerably smaller than those observed in Auyuittuq National Park. Uncorrected DEMs have a median  $\Delta h$ of
 $-1.99$ m, SD of 2.57 m and NMAD of 2.28 m. Application of the Nuth and Kääb (Reference Nuth and Kääb2011) sub-pixel alignment method yields a near-zero median
 $\Delta h$ (
 $-0.01$ m) and an NMAD of 2.27 m, with minimal calculated translations (0.06 m in
 $X$, 0.36 m in
 $Y$,
 $-1.95$ m in
 $Z$). Deramping and vertical median shift corrections resulted in a slight reduction of the
 $\text{NMAD}$ to
 $2.08\,\text{m}$. The limited magnitude of these improvements reflects the high initial alignment accuracy inherent in the Sirmilik National Park datasets. This stability is attributed to the moderate topographic relief and uniform slope distribution of the Sirmilik National Park region, which present fewer geometric challenges for image correlation. Furthermore, the higher quality of the initial photogrammetric reconstruction in this domain was facilitated by optimal stereo-geometry, including high image overlap, which provided superior image texture for reliable tie-point auto-correlation.
5.3. Areal extent and glacier centreline changes
Glaciers in both Auyuittuq and Sirmilik National Park have retreated over the past six to six-and-a-half decades, with changes evident in both centreline length and areal extent (Table 5).
Changes in glacier centreline length (CL) and area in Auyuittuq National Park (1959–2023) and Sirmilik National Park (1958–2023).

Table 5 Long description
The table reports glacier centreline length and glacier area at the start and end of the study period for named glaciers in Auyuittuq and Sirmilik National Parks, along with percent change. Every glacier shows decreases in both centreline length and area over time. In Auyuittuq, centreline length declines range from about 7 percent (Turner) to about 16 percent (Nakarpog and Highway), while area declines range from about 9 percent (Turner) to about 28 percent (Rundle). Rundle’s area drops from about 46.73 to 33.65 square kilometres, the largest area loss in the table, and Highway remains the largest by area in Auyuittuq, decreasing from about 100.59 to 86.59 square kilometres. In Sirmilik, centreline length changes are small, about 2 percent for Fountain and about 3 percent for Sermilik, but areas still decline by about 14 percent for Fountain and about 5 percent for Sermilik. Sermilik is the largest glacier listed by area, decreasing from about 226.56 to 215.36 square kilometres. Area values include uncertainty ranges, so small differences should be interpreted with that measurement uncertainty in mind.
Centreline lengths are in km, areas are in km $^2$ and area uncertainties represent
 $\pm$1 SD.
In Auyuittuq National Park, centreline shortening ranges from 6.84% (Turner Glacier) to 15.82% (Nakarpog Glacier). Highway Glacier shows one of the largest absolute retreats, shortening by 3.45 km from 22.15 km to 18.70 km ( $-15.58\%$), accompanied by a 13.91% area reduction. Given its position within the regional drainage network, retreat of Highway Glacier may influence downstream hydrology, including changes in meltwater routing, discharge seasonality and sediment delivery, with potential implications for valley geomorphology. Area losses are largest for Rundle Glacier (
 $-27.99\%$), indicating substantial frontal retreat and/or lateral thinning.
In Sirmilik National Park, glaciers have undergone more modest changes. Fountain Glacier shortened by only 0.27 km ( $-1.65\%$) but lost 14.20% of its area, suggesting thinning and narrowing dominate over frontal retreat. Sermilik Glacier, the park’s largest, shortened by 1.01 km (
 $-2.97\%$) with an area loss of 4.95%, indicating relative stability over recent decades. These subdued changes may reflect topographic shielding or more favourable accumulation conditions compared with Auyuittuq National Park.
5.4. Geodetic mass balance
This geodetic mass balance assessment, derived from DEM differencing between 1958/1959 and 2021/2022, reveals pronounced spatial variability in glacier change across both national parks (Fig. 7; Table 6). All glaciers in Auyuittuq and Sirmilik National Park exhibited increased thinning towards their termini, reflecting the predominance of negative mass balance conditions over the study period. Glaciers with insufficient coverage in the differenced DEMs ( $ \lt 80\%$ valid pixels), including Highway Glacier in Auyuittuq National Park and Sermilik Glacier in Sirmilik National Park, were excluded from the analysis to ensure the reliability of the geodetic estimates.
Surface elevation change maps for glaciers in Auyuittuq National Park (left, 1959–2021/22) and Sirmilik National Park (right, 1958–2022). Elevation differences were computed by co-registering historical and contemporary digital elevation models (DEMs) using stable, ice-free terrain and then differencing them to derive dDEMs. The co-registration process followed the stable terrain bias correction approach implemented in the xDEM Python library (xDEM contributors, 2021). The black polygons delineate the study glaciers analysed in this research.

Figure 7 Long description
A) The map of Auyuittuq National Park (1959 to 2021/22) shows elevation changes with a gradient from blue to red, indicating changes from 50 meters to minus 50 meters. Black polygons outline the study glaciers. B) The map of Sirmilik National Park (1958 to 2022) also displays elevation changes using the same gradient. Both maps include a scale bar of 5 kilometers. The elevation change is represented by a vertical color bar on the right, with blue indicating positive changes and red indicating negative changes.
Geodetic mass balance, volume change and mean elevation change for glaciers in Auyuittuq National Park (1959–2021/22) and Sirmilik National Park (1958–2022).

Table 6 Long description
The table reports mean elevation change, total volume change, total geodetic mass balance, and annual mass balance for seven named glaciers across two Canadian national parks over multi-decade periods. Every glacier shows negative elevation change, negative volume change, and negative mass balance, indicating sustained thinning and ice loss. In Auyuittuq National Park, mean elevation change ranges from about minus 16.0 meters (Caribou) to about minus 25.4 meters (Rundle), with annual mass balance spanning roughly minus 0.22 to minus 0.35 meters water equivalent per year. Rundle has the greatest volume loss in Auyuittuq at about 1.19 billion cubic meters, while Caribou has the smallest at about 217 million cubic meters. The largest thinning values in Auyuittuq are around minus 25 meters for Rundle and Nerutusoq, paired with annual mass balance near minus 0.35 meters water equivalent per year. In Sirmilik National Park, Fountain shows about minus 25.7 meters of mean elevation change, about 920 million cubic meters of volume loss, and an annual mass balance near minus 0.35 meters water equivalent per year, similar to the most negative rates in Auyuittuq. Uncertainty ranges are provided for volume change and mass balance, so small differences between glaciers may not be meaningful when values are close.
Uncertainties are  $\pm$1 SD; volumes are in
 $\mathrm{m}^3$ and MB in m w.e.
5.4.1. Auyuittuq National Park (1959–2021/22)
Mean elevation changes across the six analysed glaciers in Auyuittuq National Park ranged from  $-16.02$ m (Caribou Glacier) to
 $-25.42$ m (Rundle Glacier) over the 62.5 year study period. Corresponding geodetic mass balances were uniformly negative, from
 $-13.62 \pm 0.96$ m w.e. for Caribou Glacier to
 $-21.61 \pm 1.53$ m w.e. for Rundle Glacier, equivalent to annual rates of
 $-0.22 \pm 0.02$ and
 $-0.35 \pm 0.02$ m w.e. a
 $^{-1}$, respectively. Other notably affected glaciers included Nerutusoq (
 $-21.31 \pm 1.51$ m w.e.) and Nakarpog (
 $-19.79 \pm 1.40$ m w.e.), reflecting extensive ice loss in topographically exposed and dynamically active catchments. The volumetric losses were greatest for Rundle Glacier (
 $-1.19 \times 10^9$ m
 $^3$) and Norman Glacier (
 $-7.64 \times 10^8$ m
 $^3$), underscoring their regional significance in long-term mass balance trends. (See supplemental material).
5.4.2. Sirmilik National Park (1958–2022)
In Sirmilik National Park, Fountain Glacier exhibited a mean elevation change of  $-19.04$ m over the 64 year record, corresponding to a total volume loss of
 $-9.20 \times 10^8$ m
 $^3$ and a cumulative geodetic mass balance of
 $-21.85 \pm 1.54$ m w.e. This equates to an annual rate of
 $-0.35 \pm 0.02$ m w.e. a
 $^{-1}$, closely matching the highest annual losses observed in Auyuittuq National Park. The spatial uniformity of thinning across Fountain Glacier contrasts with the more heterogeneous patterns in Auyuittuq National Park, suggesting a dominant influence of regional climatic forcing with minimal topographic shielding (See supplemental material).
5.5. Morphometric and topographic sensitivities
Standardized bivariate sensitivities ( $\beta^{\ast}$; Fig. 8) were computed for six glaciers in Auyuittuq National Park and Fountain Glacier in Sirmilik National Park (
 $n=7$). Mean slope is the dominant predictor of specific geodetic mass balance, with
 $\beta^{\ast}\approx+0.83$, such that steeper glaciers exhibit less-negative balances. This tendency is consistent with higher effective elevations, terrain shading and snow redistribution from steep headwalls (e.g. Caribou,
 $16.6^{\circ}$; Norman,
 $15.4^{\circ}$; Turner,
 $14.9^{\circ}$). Aspect exerts a secondary control: eastness is associated with less-negative balance (
 $\beta^{\ast}\approx+0.69$), whereas northness shows a weaker negative tendency (
 $\beta^{\ast}\approx-0.33$), plausibly reflecting local shading and circulation. Minimum and maximum elevation correlate positively with balance (
 $Z_{\min}$:
 $\beta^{\ast}\approx+0.47$;
 $Z_{\max}$:
 $\beta^{\ast}\approx+0.46$), consistent with temperature–elevation gradients. Glacier area (total planform area) is negatively associated with balance (
 $\beta^{\ast}\approx-0.63$), i.e. within this sample larger glaciers exhibit more-negative balances, indicating faster thinning where a substantial fraction of area lies at low elevations. Given larger Auyuittuq National Park glaciers also tend to extend to lower elevations, part of this size effect may reflect covariation with low-elevation footprint. Given the small
 $n$ and covariance with
 $Z_{\min}$ and
 $Z_{\max}$, this association should be interpreted cautiously.
Standardized bivariate regression coefficients ( $\beta^{\ast}$, unitless) for the sensitivity of annual geodetic mass balance to glacier characteristics for six glaciers in Auyuittuq National Park (ANP) and Fountain Glacier in Sirmilik National Park (SNP) (
 $n=7$). Positive
 $\beta^{\ast}$ indicates less-negative mass balance (reduced thinning) as the predictor increases; negative
 $\beta^{\ast}$ indicates more-negative mass balance. Predictors include glacier area, minimum and maximum elevation (
 $Z_{\min}$,
 $Z_{\max}$), mean slope, aspect components (eastness and northness, derived from aspect) and the hypsometric integral (HI, from RGI v7).

The hypsometric integral (HI) was also calculated following the Jiskoot and others (Reference Jiskoot, Curran, Tessler and Shenton2009) approach, using
 \begin{equation}
r \;=\; \frac{Z_{\max}-Z_{\mathrm{med}}}{\,Z_{\mathrm{med}}-Z_{\min}\,},
\end{equation}
where  $Z_{\mathrm{med}}$ is the median glacier surface elevation and
 $Z_{\min}$ and
 $Z_{\max}$ are the minimum and maximum glacier elevations, respectively. HI is then defined piecewise as
 \begin{equation}
\mathrm{HI} \;=\;
\begin{cases}
r, & r \ge 1,\\[0.3em]
-\,1/r, & 0 \lt r \lt 1~.
\end{cases}
\end{equation}
By construction,  $|\mathrm{HI}|\approx 1$ indicates near-symmetric hypsometry;
 $\mathrm{HI} \gt 1$ denotes progressively bottom-heavy glaciers (greater low-elevation area), whereas
 $\mathrm{HI} \lt -1$ denotes progressively top-heavy glaciers (greater high-elevation area).
In this dataset (Table 7), HI shows only a weak association with the geodetic mass balance ( $\beta^{\ast} \approx 0.57$). Given the small sample size, the predominance of Auyuittuq National Park glaciers, potential covariation with area and elevation and reliance on RGI-derived HI, this relationship should be interpreted cautiously. Conceptually, glacier sensitivity scales with the fraction of area lying below the ELA (Angelis, 2014). Glaciers whose hypsometry concentrates area below the geodetic ELA (e.g. Rundle, Nerutusoq) exhibit the most severe multi-decadal thinning, even where centreline retreat lags because width and buttressing limit frontal change.
Hypsometric integral (HI) for glaciers in Auyuittuq National Park (ANP) and Sirmilik National Park (SNP), computed following Jiskoot and others (Reference Jiskoot, Curran, Tessler and Shenton2009).

Table 7 Long description
The table lists hypsometric integral values for nine named glaciers in two Canadian Arctic national parks, indicating whether glacier area is concentrated at lower or higher elevations. In Auyuittuq National Park, six of seven glaciers have positive values from 1.02 to 1.76, suggesting generally bottom-heavy hypsometry; Caribou Glacier is highest at 1.76. Nakarpog, Turner, and Rundle are close to 1, indicating near-balanced elevation-area distribution. Highway Glacier is the ANP exception with a negative value of minus 1.54, indicating top-heavy hypsometry. In Sirmilik National Park, both listed glaciers are negative, with Fountain Glacier at minus 1.10 and Sermilik Glacier at minus 1.86, making this park consistently top-heavy in this sample. Two glaciers, Highway and Sermilik, are flagged as lacking a geodetic mass-balance estimate and may be excluded from some related analyses.
First compute  $r = (Z_{\max}-Z_{\mathrm{med}})/(Z_{\mathrm{med}}-Z_{\min})$, where
 $Z_{\mathrm{med}}$ is the elevation of the contour enclosing half the glacier area; then set
 $\mathrm{HI}=r$ for
 $r\ge 1$ and
 $\mathrm{HI}=-1/r$ for
 $0 \lt r \lt 1$. Thus
 $|\mathrm{HI}|\approx 1$ indicates equidimensional hypsometry;
 $\mathrm{HI} \gt 1$ indicates progressively bottom-heavy glaciers (greater low-elevation area), whereas
 $\mathrm{HI} \lt -1$ indicates progressively top-heavy glaciers (greater high-elevation area).
* No geodetic mass balance estimate available; glacier excluded from the sensitivity analysis (Fig. 8). Note— $Z_{\mathrm{med}}$,
 $Z_{\min}$ and
 $Z_{\max}$ are derived from DEM elevations sampled within each glacier polygon from the Randolph Glacier Inventory version 7.0.
 $Z_{\mathrm{med}}$ is the 50th percentile (area-weighted) of glacier surface elevation.
5.6. Annual climate variability: summer (JJA), winter (DJF), positive degree days (PDD) and precipitation
Climatological contrasts between the two coastal Baffin Island stations delineate a maritime–polar gradient. Pangnirtung (Davis Strait–exposed fjord on the Cumberland Peninsula) is warmer and wetter, with June–August (JJA) mean air temperature typically 6–8 $^{\circ}$C and annual precipitation commonly 250–350 mm. Pond Inlet (higher-latitude Baffin Bay coast) is colder and drier, with JJA mean temperature approximately 3–6
 $^{\circ}$C and annual precipitation generally 200–250 mm. Winters are severe at both sites but markedly colder at Pond Inlet, where December–February (DJF) means are often -33 to -8
 $^{\circ}$C compared with approximately -24 to -19
 $^{\circ}$C at Pangnirtung. Positive degree days (PDD) are defined as the annual sum of daily mean temperature above 0
 $^{\circ}$C. These patterns and trends are summarized in (Fig. 9).
Annual climate at Pond Inlet and Pangnirtung, Baffin Island (1960–2020). (a) June–August (JJA) mean air temperature; (b) December–February (DJF) mean air temperature; (c) annual precipitation; and (d) positive degree days (PDD). Solid lines (and bars in panel c) show annual values; dashed lines denote linear trends for the sub-periods indicated in each panel. Trend slopes (per decade) and two-sided  $p$-values are listed in the legends. PDD is the annual sum of daily mean temperature above 0
 $^{\circ}$C. Units are
 $^{\circ}$C, mm and
 $^{\circ}$C
 $\cdot$day.

Figure 9 Long description
Panel A shows June to August mean air temperature for Pond Inlet and Pangnirtung from 1960 to 2020. The x-axis represents years and the y-axis represents temperature in degrees Celsius. Pond Inlet shows an increase from approximately 3 degrees Celsius in 1960 to 6 degrees Celsius in 2020. Pangnirtung shows a rise from about 6 degrees Celsius to 8 degrees Celsius over the same period. Panel B displays December to February mean air temperature. The x-axis is years and the y-axis is temperature in degrees Celsius. Pond Inlet temperatures range from negative 33 to negative 8 degrees Celsius, while Pangnirtung ranges from negative 24 to negative 19 degrees Celsius. Panel C is a bar graph showing annual precipitation in millimeters. The x-axis is years and the y-axis is precipitation in millimeters. Pond Inlet varies between 200 and 250 millimeters, while Pangnirtung ranges from 250 to 350 millimeters. Panel D shows positive degree days, with the x-axis as years and the y-axis as degree-days. Pond Inlet increases from 20 to 60 degree-days and Pangnirtung rises from 60 to 140 degree-days. All panels indicate climate changes over time for the two locations.
5.6.1. Summer temperature (JJA)
JJA warming is evident at both sites and is strongest in the late 1990s–2010s. At Pond Inlet, JJA increased by 0.86 $^{\circ}$C dec
 $^{-1}$ (
 $p=0.066$) during 1976–1993 and by 0.59
 $^{\circ}$C dec
 $^{-1}$ (
 $p=0.046$) during 1999–2020. At Pangnirtung, JJA increased by 0.95
 $^{\circ}$C dec
 $^{-1}$ (
 $p=0.018$) during 1996–2010.
5.6.2. Winter temperature (DJF)
DJF trends are weaker and segmented. Pond Inlet exhibits a non-significant cooling during 1976–1992 (-2.08 $^{\circ}$C dec
 $^{-1}$,
 $p=0.127$) followed by a non-significant warming during 1998–2020 (0.64
 $^{\circ}$C dec
 $^{-1}$,
 $p=0.306$). Pangnirtung warmed modestly during 1996–2010 (1.69
 $^{\circ}$C dec
 $^{-1}$,
 $p=0.238$).
5.6.3. Positive degree days (PDD)
PDD increases mirror the summer warming and indicate greater melt-energy availability. At Pond Inlet, PDD rose by 76.7 $^{\circ}$C
 $\cdot$day dec
 $^{-1}$ (
 $p=0.052$) during 1976–1993 and by 39.9
 $^{\circ}$C
 $\cdot$day dec
 $^{-1}$ (
 $p=0.180$) during 1999–2020. Pangnirtung shows an increase of 64.0
 $^{\circ}$C
 $\cdot$day dec
 $^{-1}$ (
 $p=0.345$) during 1996–2009. Although only the earlier Pond Inlet segment approaches conventional significance, all slopes are positive and consistent with enhanced ablation potential since the late 20th century.
5.6.4. Precipitation
Annual precipitation exhibits high interannual variability and clear site differences (Pangnirtung generally wetter than Pond Inlet), but no robust long-term trend is resolved given data gaps and discontinuous spans. Wetter years cluster in the late 1990s–2000s at Pangnirtung, possibly reflecting increased open-water fetch and storminess in Davis Strait; a formal trend was not fitted by design.
6. Discussion
6.1. Evaluating reference DEM suitability and implications for glaciological studies
Selection of an appropriate reference DEM strongly controls the accuracy of photogrammetric alignment, the fidelity of historical DEM reconstructions, and the robustness of geodetic mass balance estimates, particularly in data-sparse regions such as the CAA. We evaluated three widely used reference DEMs—ArcticDEM, TanDEM-X and the CDEM. The datasets exhibit complementary strengths and limitations under contrasting topographic and climatic conditions in Auyuittuq and Sirmilik National Park. Overall, the findings provide practical guidance for reference DEM selection in Arctic studies and for monitoring climate-driven glacier evolution, with ArcticDEM preferred for high-resolution differencing, TanDEM-X best suited as a cloud-independent alignment control, and CDEM offering earlier-epoch context at coarser scales.
6.1.1. ArcticDEM: high precision for glaciological applications
Among the tested datasets, ArcticDEM performed best for this study, especially for geodetic mass balance calculations, owing to its higher spatial resolution (2 m) and extensive temporal coverage associated with optical-stereo acquisitions (Noh and Howat, Reference Noh and Howat2017; Porter and others, Reference Porter2023). After co-registration on bedrock, ArcticDEM yielded lower median elevation offsets and NMAD over stable terrain in both parks, supporting its use for detailed analyses of glacier elevation change and geodetic mass balance.
ANP (Auyuittuq National Park) ArcticDEM Version 4.1 mosaics from 2021/22 were employed to improve spatial completeness across complex relief. Individual strips exhibited persistent voids arising from steep topography and frequent topographic shadowing, which impeded acquisition of cloud- and void-free coverage. Mosaicking enhanced spatial continuity and geometric stability but introduced potential temporal inconsistency, a known limitation for glaciological applications (Hugonnet and others, Reference Hugonnet, McNabb, Berthier, Menounos and Nuth2022). This issue is acute in Auyuittuq National Park, where dynamic weather near Baffin Bay drives highly variable and adverse sky conditions for optical imaging. To preserve temporal coherence, each mosaic component was inspected and validated against its acquisition year (2020 or 2021), and the mosaic was treated explicitly as a two-epoch composite within the analysis framework. Averaging across the two years mitigated residual temporal mismatch while retaining maximal spatial coverage, thereby providing a basis for geodetic mass balance estimation.
SNP (Sirmilik National Park) Individual ArcticDEM Version 4.1 strips from 2022 (see supplemental material) were used. The smaller glacier sizes and simpler terrain reduced inconsistencies arising from temporal mismatch (Shean and others, Reference Shean2020) and enabled precise, site-specific geodetic mass balance estimates (e.g. Fountain Glacier; Fig. 7, Table 6).
Artefact mitigation and quality control Despite its fine spatial detail, ArcticDEM exhibits characteristic artefacts visible in the dDEMs (Figs. 5 and 4), including strip-edge noise, local voids and speckle along very steep, shadowed margins. These arise from optical-stereo constraints (occlusion, low texture over snow and firn, illumination differences) and can propagate into dDEMs if unfiltered; frequent cloud and seasonal snow further complicate photogrammetric processing in the CAA (Morin and others, Reference Morin2016; Porter and others, Reference Porter2023). The two-stage quality-control workflow applied here—(i) a stable-terrain blunder mask based on the  $3 \times \text{NMAD}$ threshold and (ii) connected-component filtering on glacier dDEMs followed by hypsometric void infilling in 50 m elevation bands—reduced ArcticDEM-specific artefacts without damping genuine, kilometre-scale thinning signals. Application of these steps decreased rock-surface NMAD and had only a minor effect on park-wide mean thickness change; spatial thinning patterns and glacier-integrated volume changes remained unchanged within uncertainty. Consequently, ArcticDEM is recommended as the preferred reference DEM for co-registration and dDEM generation in both parks, provided that mosaic temporal consistency is verified (ANP) and artefacts are systematically mitigated.
6.1.2. TanDEM-X: complementary strengths and limitations of radar-derived DEMs
To address photogrammetric alignment limitations in optical datasets (e.g. ArcticDEM), the TanDEM-X interferometric synthetic aperture radar (InSAR) DEM was used as an auxiliary reference for co-registration and for guiding the distribution of TPs and GCPs constraints on stable terrain. Radar-derived DEMs are insensitive to cloud cover and independent of solar illumination, enabling acquisitions throughout the polar year and improving the robustness of alignment in persistently overcast conditions typical of Auyuittuq and Sirmilik National Park (Rizzoli and others, Reference Rizzoli, Martone, Rott and Moreira2017). In stable-terrain comparisons, integrating TanDEM-X reduced systematic biases, yielding lower median offsets and NMAD values (Fig. 5).
In keeping with the Methods, co-registration and quality assessment were restricted to off-glacier rock to avoid radar penetration effects in snow and firn that can shift the InSAR phase-centre elevation relative to the physical surface (Noh and Howat, Reference Noh and Howat2017). Nonetheless, two limitations constrain TanDEM-X as a primary source for glacier-elevation change. First, its 12 m spatial resolution under-resolves fine-scale surface morphology (e.g. crevasse fields and supraglacial channels on Fountain Glacier). Second, the temporal mismatch between mosaic (composed of multiple acquisitions between 2011 and 2014) additional uncertainty where significant geomorphic change has occurred, as reflected by larger stable-terrain dispersion in Auyuittuq National Park. Taken together, TanDEM-X is most valuable as a temporally consistent, cloud-independent control surface for alignment and error characterization.
6.1.3. CDEM: temporal alignment benefits and scale-dependent limitations
The CDEM was evaluated for its earlier nominal epoch and broad coverage, which improve temporal alignment with mid–late twentieth-century imagery relative to modern optical mosaics. Compiled from heterogeneous sources (archival topographic mapping and airborne data), CDEM provides a useful historical elevation reference for regional context in Auyuittuq and Sirmilik National Park (Natural Resources Canada, 2013). Stable-terrain diagnostics reflect contrasting geomorphic histories: higher NMAD in Auyuittuq National Park indicates substantial landscape evolution associated with glacier retreat, thinning and paraglacial adjustment, whereas lower NMAD in Sirmilik National Park suggests that more subdued relief and slower change eased co-registration (Figs. 4 and 5).
However, the multi-temporal and 20–30 m spatial resolution of CDEM, combined with variable processing techniques, limits its efficacy for glacier-scale applications. Fine-scale elevation signals are smoothed, voids or artefacts can persist at valley scales and heterogeneous acquisition dates introduce temporal inconsistency across tiles. Consequently, CDEM is best used as an ancillary, temporally closer baseline for regional assessments and as a check on gross alignment, but it is not recommended for primary derivation of glacier elevation change where decimetre–metre vertical precision and sub-decametre spatial detail are required.
6.2. Identifying stable terrain for co-registration and implications for glacier-elevation analysis
Photogrammetry-derived DEMs from historical aerial photographs are susceptible to substantial noise and outliers owing to variable image quality, including cloud contamination, overscan borders and broken frames (see supplemental material) and limited sidelap imposed by survey design (Fig. 10). These factors reduce the reliability of glacier-elevation change estimates and, by extension, long-term geodetic mass balance assessments.
Spatial distribution of historical aerial-photograph flight lines, group control points (red triangles) and tie points (blue crosses) for Auyuittuq National Park (ANP; panel a) and Sirmilik National Park (SNP; panel b). The edge-to-edge frame layout restricts sidelap in steep terrain in ANP, increasing the likelihood of block misalignment and geometric distortion during the photogrammetric reconstruction of digital elevation models (DEMs). In contrast, SNP features a more evenly distributed network of control points, which facilitates higher geometric stability.

Figure 10 Long description
A) The map of Auyuittuq National Park displays a distribution of group control points marked by red triangles and tie points marked by blue crosses. The points are densely clustered, particularly in the central and northern areas, with a grid overlay indicating flight lines. B) The map of Sirmilik National Park also shows group control points as red triangles and tie points as blue crosses. The distribution is more even compared to Auyuittuq, with a similar grid overlay. The legend clarifies the symbols used for group control points and tie points.
A recurring artefact in snow-covered scenes is saturation that reveals the scanner grid used during digitization (see supplemental material). This grid pattern introduces systematic texture distortions that mislead feature-matching algorithms, reduce the density of reliable TPs and increase alignment uncertainty. In Auyuittuq National Park, these limitations are exacerbated by the park’s physiography and environmental setting (Fig. 11). Glacier cover exceeds 70% of the study area, dynamic river systems are pervasive, and the bedrock geology of Akshayuk Pass is complex. Bedrock is dominated by Precambrian granite with interspersed younger sedimentary units. Surficial deposits, shaped by glacial and post-glacial processes, are likely to be geomorphically active: frost-shattered debris transported downslope by gravity is concentrated on steep slopes and commonly extends 50–100 m up valley and fjord walls, while fine-textured aeolian sand occurs along the Weasel River Valley (Hines and Moore, Reference Hines and Moore1988). Collectively, these conditions impede the identification and placement of reliable GCPs. The inherently dynamic surface—characterized by shifting talus, sediment redistribution and active glaciofluvial processes—adds uncertainty to DEM alignment and propagates error into glacier-elevation change estimates (Pandey and others, Reference Pandey, Manickam, Bhattacharya, Ramanathan, Singh and Venkataraman2016).
Stable-terrain analysis in Auyuittuq National Park (ANP), Nunavut, Canada (1959–2021/2022). Panels: (a) 2023 field photograph near Pangnirtung; (b) stable-terrain mask used for co-registration between the photogrammetric DEM (1959) and ArcticDEM strips (2021/2022), with 1959 glacier outlines in black; (c) distribution of elevation differences (dDEM histogram) and normalized semivariogram of residuals over stable terrain, quantifying spatial autocorrelation and co-registration quality.

Figure 11 Long description
Auyuittuq National Park terrain analysis consists of three panels. Panel (a) shows a field photograph near Pangnirtung, depicting mountainous terrain with snow-covered peaks and a river valley. Panel (b) presents a map illustrating elevation changes in the park, with a legend indicating elevation difference in meters. The map includes glacier outlines from 1959 in black and elevation differences are marked in a gradient from negative to positive values. The map highlights areas around Pangnirtung and Akshayuk Pass, with a scale bar indicating 10 kilometers. Panel (c) features a histogram of elevation differences, with categories labeled as mean, median and standard deviation. The histogram shows a distribution of elevation differences, with a peak around zero. Below the histogram, a normalized semivariogram of elevation differences is displayed, quantifying spatial autocorrelation and co-registration quality. The semivariogram graph includes axes labeled as distance and semivariance, with data points plotted to show spatial patterns.
Slope statistics reinforce the difficulty of isolating stable ground. Across candidate terrain in Auyuittuq National Park, the mean slope is  $12.17^{\circ}$, with maxima of
 $89.99^{\circ}$ (Fig. 11). To mitigate co-registration errors, slopes
 $ \lt 5^{\circ}$ and
 $ \gt 30^{\circ}$ were excluded. Slopes
 $ \lt 5^{\circ}$ typically correspond to depositional zones and watercourses, whereas slopes
 $ \gt 30^{\circ}$ are prone to rockfalls and landslides. This masking isolates quasi-stable surfaces and reduces both random and systematic errors during co-registration. Given the combination of geological instability, active surface processes and extensive glacierization, adaptive co-registration strategies are required to obtain reliable glacier-elevation change estimates in Auyuittuq National Park (Li and others, Reference Li, Hu, Liu, Jiang, Wang and Shen2023).
In contrast to the geomorphically complex and unstable terrain of Auyuittuq, Sirmilik National Park provides a more favourable setting for DEM co-registration, albeit with localized challenges (Fig. 12). The geological framework is dominated by sedimentary formations of the Bylot Supergroup—primarily sandstone and dolomite—which form layered cliffs and hoodoos on Bylot Island. Although these units are moderately erodible over geological timescales, their surface expression is typically persistent over decades, yielding clear, repeatable TPs that improve the accuracy and efficiency of photogrammetric workflows. Potential exposures of Canadian Shield basement rocks (metamorphic and igneous) further support the stability of co-registration reference surfaces.
Stable-terrain analysis in Sirmilik National Park (SNP), Nunavut, Canada (1958–2022). Panels: (a) 2023 field photograph of the glacial landscape; (b) stable-terrain mask used for co-registration between the photogrammetric DEM (1958) and ArcticDEM strips (2022), with 1958 glacier outlines in black; (c) distribution of elevation differences (dDEM histogram) and normalized semivariogram of elevation residuals over stable terrain, quantifying spatial autocorrelation and evaluating co-registration quality.

Figure 12 Long description
A composite image showing four parts related to Sirmilik National Park. The first part is a photograph of a glacial landscape, depicting snow-covered mountains and valleys. The second part is a map labeled ′Analysis of Stable Terrain Elevation in Sirmilik National Park,′ showing stable-terrain areas with a color gradient from blue to red, indicating elevation differences. Black lines outline the 1958 glacier boundaries. The third part is a histogram titled ′Elevation Difference Distribution,′ displaying elevation differences with a normal distribution curve. The fourth part is a graph labeled ′Normalized Variogram of Elevation Differences,′ showing spatial autocorrelation with a plotted line and inset histogram. The map and graphs provide insights into terrain stability and elevation changes over time.
Despite this relative stability, terrain-induced uncertainties remain. Local permafrost-related processes, notably thermal erosion of ice wedges, can trigger rapid ground deformation. On Bylot Island, retrogressive thaw slumps and gully incision associated with ice-wedge degradation have retreated at up to 5 m d $^{-1}$ during summer melt episodes (Godin and Fortier, Reference Godin and Fortier2012). These disturbances necessitate targeted exclusion zones and validation checks during GCP selection.
6.3. Inter-DEM accuracy benchmarks for glacier elevation-change studies
Residual elevation differences over stable terrain in this study are consistent with benchmarks from other high-relief glacierized regions. After co-registration, median biases over bedrock were  $\le$0.1 m in both parks, with NMAD values of 4.07 m and 2.08 m, respectively. These dispersions exceed those reported from recent WorldView/Pléiades DEM differencing in steep Arctic terrain (NMAD 1–1.5 m; Bł aszczyk and others Reference Blaszczyk2019), but are comparable to the 2–5 m standard deviations obtained when differencing SPOT-5 DEMs against historical maps in the Canadian Arctic (Gardner and others, Reference Gardner, Moholdt, Arendt and Wouters2012). They are also within the range reported for the Pamir–Karakoram by Ghuffar and others (Reference Ghuffar, King, Grégoire, Rupnik and Bolch2023), who found NMAD values from 3.35 to 27.78 m depending on subregion and terrain complexity.
Area-averaged glacier thinning rates derived here for 1958–2023 ( $-0.30$ to
 $-0.36$ m a
 $^{-1}$) represent a multi-decadal mean. Because this estimate integrates variability over more than six decades, it is not directly comparable to rates derived over short, recent intervals. When compared with other multi-decadal assessments, our rates are consistent with those reported for the Penny Ice Cap (
 $-0.20 \pm 0.12$ m a
 $^{-1}$) and Bylot Island glaciers (
 $-0.33 \pm 0.19$ m a
 $^{-1}$; Gardner and others Reference Gardner, Moholdt, Arendt and Wouters2012). Key methodological and accuracy benchmarks for this study and selected literature are summarized in Table 8.
Stable-terrain residuals and glacier thinning rates from selected multi-temporal DEM studies, including sensors, periods and co-registration approaches.

Table 8 Long description
The table compares several multi-temporal elevation-model studies by reporting stable-terrain residual statistics (median bias and dispersion) alongside glacier thinning rates, plus brief method notes. Median residuals are near zero in most entries, indicating little systematic vertical offset after co-registration. This study for Baffin and Bylot from 1958 to 2022 reports a median near zero, dispersion of 4.07 meters in one area and 2.08 meters in another, and thinning between 0.30 and 0.36 meters per year in magnitude, using historical aerial imagery versus ArcticDEM with a Nuth and Kaab style co-registration. Blaszczyk and others for Svalbard from 2011 to 2017 reports an average median of minus 0.5 meters, dispersion around 1.4 meters, and much faster thinning between 1.7 and 2.4 meters per year in magnitude, using WorldView-2 and Pleiades stereo in a tidewater setting. Gardner and others for Penny Ice Cap from 1958 to 2010 and for Bylot Island from 1979 to 2008 both show median near zero, dispersion between 2 and 5 meters, and thinning magnitudes of about 0.195 and 0.326 meters per year, with stated uncertainty ranges and thinning derived from mass-loss conversion. Ghuffar and others for the Pamir and Karakoram from 1973 to 2021 reports median near zero, dispersion spanning 3.35 to 27.78 meters, and thinning between 0.106 and 0.541 meters per year in magnitude, noting strong terrain dependence and use of Hexagon compared with SPOT-6 and Pleiades. Dispersion values are not all computed the same way across studies, and sensors, time spans, and terrain conditions differ, so thinning rates and residual spreads are not strictly like-for-like comparisons.
Dispersion is reported as NMAD where available; otherwise as standard deviation (std).
In this study, stable-terrain diagnostics (median  $\approx$0 m; NMAD 2–4 m) fall within the expected range for historical photogrammetry referenced to modern DEMs, confirming that co-registration and bias control are adequate for multi-decadal change detection at the thinning rates observed. The higher NMAD in Auyuittuq National Park (4.07 m) relative to Sirmilik National Park and to WorldView/Pléiades benchmarks likely reflects the quality constraints of mid-20th-century aerial imagery and the prevalence of steep, high-relief terrain. These values remain notably lower than the upper NMAD reported by Ghuffar and others (Reference Ghuffar, King, Grégoire, Rupnik and Bolch2023) for the Pamir–Karakoram, where terrain and sensor limitations introduced greater dispersion. Crucially, no systematic bias remains after applying the Nuth and Kääb (Reference Nuth and Kääb2011) and de-ramping correction, as indicated by median residuals
 $\leq$0.1 m. The agreement of the thinning rates with the PIC in Auyuittuq National Park, Bylot Island in Sirmilik National Park and the lower end of Pamir–Karakoram estimates further supports the robustness of our elevation-change signal and indicates sustained but moderate mass loss across the eastern Canadian Arctic over the last six decades.
6.4. Decadal evolution of JJA, DJF and precipitation at coastal Baffin stations
Decadal trends in summer (June–August, JJA), winter (December–February, DJF) and total annual precipitation were evaluated for Pond Inlet and Pangnirtung. Trends were computed only for time series with  $\ge 10$ consecutive years that passed quality control; years with
 $ \gt 10$ missing days in JJA or DJF, or
 $ \gt 30$ missing days annually, were excluded. To avoid seasonal truncation, DJF was treated across calendar years.
Both stations exhibit statistically significant JJA warming in at least one multidecadal time series, accompanied by increasing PDD totals across all segments. These uniformly positive slopes indicate enhanced melt energy and ablation potential since the late 20th century. The larger trend observed at Pangnirtung is consistent with its geographic and climatological setting: located  $\sim 6^{\circ}$ farther south (
 $66^{\circ}\mathrm{N}$ vs.
 $72^{\circ}\mathrm{N}$ for Pond Inlet), Pangnirtung experiences higher summer solar elevation and a longer above-freezing season. Combined with stronger summer marine advection from nearby open water in Cumberland Sound and Baffin Bay, these factors yield a higher mean JJA temperature and a stronger warming response relative to Pond Inlet. Regionally, this summer warming aligns with reductions in sea-ice concentration and earlier open-water onset in the Baffin Bay–Davis Strait sector, which enhance turbulent heat fluxes from newly ice-free waters to adjacent coasts (Dauginis and Brown, Reference Dauginis and Brown2021; Uhlíková and others, Reference Uhlíková, Vihma, Karpechko and Uotila2024).
In contrast to the summer signal, no long-term change is detected in DJF winter temperature or total annual precipitation. Winter trends vary in sign and magnitude among segments and are generally indistinguishable from zero. Although site differences are clear, with Pangnirtung generally wetter than Pond Inlet, annual precipitation exhibits high interannual variability. Furthermore, significant data gaps and discontinuous observation spans preclude the calculation of defensible long-term trends. Potential influences on time series slopes and  $p$-values include undocumented instrument changes, site relocations and uncertainties in rainfall–snowfall partitioning. Further work and investigation are required to homogenize these time series.
Despite these caveats, the coherent JJA warming and concurrent increase in PDD at both stations provide a process-based explanation for increased ablation across the region during the satellite era. Because the precipitation records lack a coherent positive trend, increased PDD will generally outweigh any precipitation-driven accumulation increases. Furthermore, the stronger summertime signal at the more maritime Pangnirtung station implies a heightened sensitivity of low-elevation, ocean-proximal glacier tongues to continued warming, which is consistent with observed regional retreat patterns.
6.5. Glacier area and volume change over six decades (1958–2022)
6.5.1. Topographic controls on retreat and response timescales
The observed spatial heterogeneity in glacier retreat underscores the role of regional variability in climatic forcing and topographic sensitivity. The extensive area loss and rapid recession of valley glaciers in Auyuittuq National Park, such as Rundle and Highway, suggest that glaciers with steep longitudinal profiles and lower median elevations are particularly susceptible to rapid dynamic adjustment. These findings align with established models of glacier response timescales, where thinner, steeper glaciers adjust more quickly to climatic perturbations through coupled dynamic flow and enhanced melt-driven thinning (Huss and others, Reference Huss, Hock, Bauder and Funk2012).
Conversely, the more subdued centreline changes observed in Sirmilik National Park, specifically for Sermilik Glacier, likely reflect thicker ice bodies and higher hypsometric indices. In these systems, a larger proportion of the glacier area is situated at higher elevations, which buffers the terminus against immediate retreat. The data suggest that in Sirmilik National Park, mass loss manifests primarily as pervasive surface lowering and lateral margin retreat rather than rapid frontal withdrawal. This indicates a longer dynamic response timescale, where significant cumulative thinning must occur before translating into measurable longitudinal shortening.
6.5.2. Geodetic mass balance trends and volume loss: thinning and vulnerability to accelerating warming
Over the 62.5–64 year observation window, the six glaciers in Auyuittuq National Park and Fountain Glacier in Sirmilik National Park experienced a combined total ice-volume loss of  $\Delta V = -4.76 \pm 0.004 \times 10^{9}~\mathrm{m^3}$ (ANP:
 $-3.84 \times 10^{9}~\mathrm{m^3}$; SNP:
 $-0.92 \times 10^{9}~\mathrm{m^3}$). Converting this volume to mass using an assumed ice density of
 $850 \pm 60~\mathrm{kg\,m^{-3}}$ yields a net mass loss of
 $-4.05 \pm 0.29$ Gt equivalent to a global mean sea-level rise of
 $0.0112 \pm 0.0008$ mm over the study period. Inter-park contrasts and within-park variability reflect three interacting controls: (i) the distribution of glacier area relative to the ELA, which sets where thinning concentrates and the magnitude of volume loss; (ii) local energy-balance proxies (slope, aspect) and supraglacial debris, which modulate geodetic mass balance; and (iii) thermal and dynamic structure, which governs the degree of decoupling between terminus retreat and thickness change.
Within Auyuittuq National Park, Rundle and Nerutusoq exhibit the most negative specific geodetic mass balances (both  $-0.35 \pm 0.02$ m w.e. a
 $^{-1}$), with the largest absolute volume change at Rundle (
 $-1.188 \times 10^{9}~\mathrm{m^3} \approx -1.19~\mathrm{km^3}$). Thinning is strongly concentrated towards glacier termini: on Rundle, losses reach
 $\le -70$ m at
 $\sim$480–520 m a.s.l. and remain
 $\le -30$ m up to
 $\sim$1000 m; on Nerutusoq, thinning approaches
 $-45$ m at
 $\sim$680–740 m a.s.l. and remains
 $\le -20$ m through
 $\sim$1400 m (see supplemental material).
In the elevation-change profiles, Rundle Glacier exhibits no zero-crossing within the plotted range, indicating a geodetic ELA exceeding approximately 1850–1900 m a.s.l. In contrast, Nerutusoq Glacier approaches or slightly crosses zero near 1800 m a.s.l. The hypsometric distribution shows that the vast majority of glacier area lies below the inferred ELA, exceeding 90% for Rundle and approximately 85–90% for Nerutusoq, indicating a limited hypsometric buffer to accommodate further atmospheric warming (see supplemental material).
Surface characteristics further modulate these climatic responses. Caribou Glacier carries a patchy supraglacial debris cover concentrated in the terminal zone, covering  $\sim 5\%$ of the terminus area over the lower 1.5 km. This debris locally insulates the ice, yielding a less negative geodetic mass balance of
 $-0.22 \pm 0.02$ m w.e. a
 $^{-1}$ over 1958/59–2023, despite broadly similar hypsometry to Rundle and Nerutusoq glaciers. The geodetic elevation-change profile (
 $\Delta h$) remains strongly negative at low elevations, with magnitudes of
 $\sim -45$ to
 $-50$ m at 650–750 m a.s.l., moderating to
 $\sim -15$ to
 $-25$ m at 1100–1300 m a.s.l. and approaching zero to slightly negative above
 $\sim 1500$ m a.s.l. This underscores the role of debris cover in damping ablation and shaping geodetic mass balance trends. Debris-related moderation of melt has been documented elsewhere: Companion Glacier (Himalaya) showed
 $-0.12 \pm 0.10$ m w.e. a
 $^{-1}$ (Garg and others, Reference Garg, Mehta, Shukla, Chauhan, Kesarwani and Mukherjee2023), and modelling at Batura Glacier indicated a
 $\sim 45\%$ melt reduction under debris relative to clean ice (Zhu and others, Reference Zhu2024).
In Sirmilik National Park, Fountain Glacier illustrates decoupling between frontal change and mass loss. Despite modest geometric changes—centreline shortening of  $-1.65\%$ (16.43 km to 16.16 km) and areal reduction of
 $-14.20\%$ (35.77 km
 $^{2}$ to 30.69 km
 $^{2}$) since 1958—the glacier incurred a cumulative geodetic loss of
 $-21.85 \pm 1.54$ m w.e., equivalent to a mean surface lowering of
 $-25.71$ m. Previous studies show that Fountain is polythermal, with cold margins, a temperate core, a well-developed englacial–subglacial conduit network and a large perennial proglacial icing fed by pressurized winter/spring discharge (Moorman and Michel, Reference Moorman and Michel2000; Whitehead and others, Reference Whitehead, Moorman, Wainstein and Habib2008; Wainstein and others, Reference Wainstein, Moorman and Whitehead2014). In such systems, advection of ice to the tongue can limit terminus retreat even as enhanced ablation drives strong, area-averaged thinning; cold-based margins and valley confinement provide additional buttressing. These processes plausibly explain the observed planform stability concurrent with substantial downwasting. As exemplified by Thores Glacier (northern Ellesmere Island), which shows little terminus change since the 1950s despite measurable thinning, slow velocities and basal temperatures of
 $-7$ to
 $-12^{\circ}\mathrm{C}$ with minimal evidence of basal water, this dynamical configuration can persist over decades (Kochtitzky and others, Reference Kochtitzky2023).
The geodetic mass trends align with the climatic diagnostics from nearby coastal Baffin stations: statistically significant summer (June–August) warming and increases in PDD, with no coherent long-term increase in total precipitation. In this context, enhanced melt energy is expected to dominate mass-balance responses, favouring sustained areal contraction. The stronger summertime signal in Auyuittuq National Park corresponds with its more negative specific geodetic mass balance, likely reflecting its lower latitude and consequently warmer baseline conditions compared to Sirmilik National Park. This latitudinal contrast suggests that low-elevation glacier tongues in Auyuittuq National Park may be particularly sensitive to continued summer warming.
Together, the both parks results demonstrate that ELA-relative hypsometry, polythermal structure and surface properties (e.g. debris cover) jointly govern glacier sensitivity to sustained JJA warming and increased PDD. The divergence between centreline retreat and areal/volume losses further shows that length change alone is an incomplete proxy for mass change, particularly for polythermal systems. An integrated approach, combining planform metrics with geodetic elevation change and volume estimates, remains essential for quantifying glacier contributions to sea-level rise and freshwater fluxes in the Canadian Arctic, and for diagnosing proximity to hypsometric thresholds (e.g. Hugonnet and others, Reference Hugonnet2021).
6.5.3. Interpretation of topographic and morphometric controls on geodetic mass balance change
The observed spatial heterogeneity in GMB across both parks suggests that while atmospheric warming is the primary driver of regional ice loss, local topography modulates the magnitude of the response. The strong positive correlation between mean slope and annual GMB ( $\beta^{\ast} \approx +0.83$) indicates that steeper glaciers in our sample, such as Caribou (
 $16.6^{\circ}$) and Norman (
 $15.4^{\circ}$), have experienced less-negative mass balances compared to their gentler counterparts. In contrast, low-gradient glaciers like Rundle (
 $9.9^{\circ}$) and Nerutusoq (
 $10.7^{\circ}$) lack these protective topographic effects and often possess more expansive low-elevation areas that are highly sensitive to increases in the ELA. The role of hypsometry is further clarified by the relationship between the HI and mass loss. Glaciers with
 $HI \gt 1$ (bottom-heavy), such as Rundle and Nerutusoq, exhibited the most severe multi-decadal thinning. This vulnerability is driven by the fact that a vast majority of their surface area (estimated at
 $ \gt 90\%$ for Rundle) lies below the geodetic ELA inferred from elevation-change profiles. Consequently, even a modest atmospheric warming that raises the ELA leads to a disproportionately large expansion of the ablation area. This is consistent with evidence from the PIC, where lengthening melt seasons and deep-firn warming have weakened the high-elevation buffer (Zdanowicz and others, Reference Zdanowicz2012).
Local surface characteristics also interact with topography to govern mass change. Caribou Glacier, despite having a “bottom-heavy” hypsometry ( $HI = 1.76$), exhibited a less-negative GMB (
 $-0.22 \pm 0.02$ m w.e. a
 $^{-1}$) than Rundle. We attribute this to the patchy supraglacial debris cover observed in its terminal zone, which likely provides thermal insulation and damps the ablation signal. Similar debris-mediated melt damping has been documented in high-relief environments elsewhere (Garg and others, Reference Garg, Mehta, Shukla, Chauhan, Kesarwani and Mukherjee2023), emphasizing that planform metrics must be integrated with surface properties to fully diagnose glacier sensitivity.
Finally, the divergence between centreline retreat and volumetric loss—most notable at Fountain Glacier—highlights the role of thermal and dynamic structure. As a polythermal system with cold-based margins, Fountain Glacier can maintain relatively stable terminus positions through valley-confinement buttressing, even while undergoing pervasive surface lowering ( $-19.04$ m). These findings reinforce that in the Canadian Arctic, terminus retreat alone is a conservative and potentially misleading proxy for total mass loss, particularly where polythermal dynamics or debris cover decouple planform change from volumetric thinning.
Accordingly, robust assessments of future change should integrate planform metrics (area, length) with geodetic elevation change, volume loss and explicit hypsometric diagnostics (including HI and ELA-relative area distributions) to quantify sensitivity and anticipate thresholds beyond which area-wide surface lowering (geodetic thinning), rather than frontal retreat alone, will dominate mass-loss trajectories.
6.5.4. Regional mass-balance dynamics: comparison with previous studies
Penny Ice Cap (Cumberland Peninsula) versus Auyuittuq National Park glaciers Geodetic mass balance during 1959–2021/22 for Auyuittuq National Park valley glaciers (Caribou–Turner) ranged from  $-0.22$ to
 $-0.35$ m w.e. a
 $^{-1}$, indicating sustained losses that are similar in sign but somewhat less negative than post-2005 rates reported for PIC (Table 9). Over a multi-decadal baseline, PIC’s geodetic mass balance was
 $-0.23 \pm 0.05$ m w.e. a
 $^{-1}$ for 1958–2006 (Gardner and others, Reference Gardner, Moholdt, Arendt and Wouters2012), comparable to the mid-range of the Auyuittuq National Park valley-glacier values (e.g. Norman/Turner
 $-0.31$ m w.e. a
 $^{-1}$; Table 9). Losses intensified after 2005: total PIC mass change increased from
 $-1.3 \pm 0.7$ Gt a
 $^{-1}$ in 1995–2000 to
 $-5.4 \pm 1.9$ Gt a
 $^{-1}$ in 2005–13 after correcting elevation change for firn densification (Schaffer and others, Reference Schaffer, Copland, Zdanowicz, Burgess and Nilsson2020). Using
 $A_{\mathrm{PIC}}\approx 6300$ km
 $^{2}$ yields a specific loss of
 $-0.86 \pm 0.30$ m w.e. a
 $^{-1}$ for 2005–13, which is notably more negative than the Auyuittuq National Park glacier means (Table 9). Earlier altimetry likewise documented strong low-elevation thinning (approximately
 $-0.2$ to
 $-0.5$ m a
 $^{-1}$) on PIC in 1995–2000 with little change at high elevations (Abdalati and others, Reference Abdalati2004).
Synthesis of published and current mass-balance estimates for Auyuittuq National Park (ANP) and Sirmilik National Park (SNP), including Penny Ice Cap (PIC) and Bylot Island.

Table 9 Long description
The table compiles published and new estimates of specific glacier mass balance, reported in meters water equivalent per year, for sites in Auyuittuq and Sirmilik National Parks including Penny Ice Cap and Bylot Island. New historical elevation-change reconstructions show sustained losses from 1959–2022 for six Auyuittuq glaciers (about minus 0.22 to minus 0.35) and from 1958–2022 for Fountain Glacier in Sirmilik (about minus 0.35 with a small uncertainty). For Penny Ice Cap, airborne altimetry indicates modest loss in 1995–2000 (about minus 0.21) followed by much stronger loss in 2005–2013 (about minus 0.86), suggesting acceleration of thinning in the later period. A surface mass balance model for 2005–2014 gives about minus 0.72 but represents surface processes only and does not include ice lost at glacier fronts, so it is not directly comparable to full mass-balance estimates. A regional geodetic synthesis for 1963–2006 reports about minus 0.27, and an island-wide benchmark for Bylot Island around 1979–2008 reports about minus 0.28. Gridded elevation-change products for 2000–2019 show a more negative value for an Auyuittuq tile (about minus 0.49) than for a Sirmilik tile (about minus 0.20), indicating stronger recent losses in the Auyuittuq area. Some values are derived from elevation-change rates using an assumed ice density, adding conversion uncertainty beyond the reported measurement errors.
Acronyms: MB—specific mass balance; SMB—surface mass balance; ATM—NASA Airborne Topographic Mapper; dDEM—digital elevation model of difference; CDED—Canadian Digital Elevation Data; GRACE—Gravity Recovery and Climate Experiment.
* Values converted from  $dh/dt$ (m a
 $^{-1}$) to m w.e. a
 $^{-1}$ using a density of
 $850 \pm 60$ kg m
 $^{-3}$.
Methodological differences partly explain the spread, and so do timespan effects: thinning intensified after  $\sim$2005, multi-decadal windows (e.g. 1958–2006; 1959–2021/22) damp the mean signal, whereas post-2005 assessments and decade-on-decade contrasts capture the markedly more negative 2010s signal (Gardner and others, Reference Gardner, Moholdt, Arendt and Wouters2012; Schaffer and others, Reference Schaffer, Copland, Zdanowicz, Burgess and Nilsson2020, Reference Schaffer, Copland, Zdanowicz and Hock2023; Hugonnet and others, Reference Hugonnet2021). Gardner and others (Reference Gardner, Moholdt, Arendt and Wouters2012) combined SPOT5 stereo DEMs with ICESat altimetry, applying DEM co-registration and bias controls, whereas Schaffer and others (Reference Schaffer, Copland, Zdanowicz, Burgess and Nilsson2020) explicitly adjusted for firn densification to isolate surface mass change. The volume–mass conversion used here follows the same density conventions, enabling direct comparison (Table 9). Differences in magnitude relative to PIC primarily reflect (i) time-window mismatch (the 1959–2021/22 averages include cooler decades, whereas PIC’s post-2005 interval captures peak melt) and (ii) hypsometry: PIC retains extensive high-elevation accumulation area that moderates multi-decadal means, while many Auyuittuq National Park valley glaciers have proportionally greater area at ablation-zone elevations, increasing sensitivity during warm summers (Gardner and others, Reference Gardner, Moholdt, Arendt and Wouters2012; Schaffer and others, Reference Schaffer, Copland, Zdanowicz, Burgess and Nilsson2020).
Bylot Island glaciers (SNP) versus previous studies Fountain Glacier’s geodetic mass balance for 1958–2022 is  $-0.35 \pm 0.02$ m w.e. a
 $^{-1}$, consistent with slightly more negative than Bylot Island’s island-wide geodetic mean of approximately
 $-0.277 \pm 0.162$ m w.e. a
 $^{-1}$ over
 $\sim$1979–2008 (Gardner and others (Reference Gardner, Moholdt, Arendt and Wouters2012); Table 9). The
 $\sim$25% more negative rate is expected because our analysis window includes the warm 2010s–early 2020s, when thinning accelerated region-wide. Short-term measurements in Fountain’s ablation area corroborate high melt (0.06–0.11 m d
 $^{-1}$ in late July 2016 from unmanned aerial vehicle–structure-from-motion, UAV–SfM, with centimetric vertical accuracy; Bash and others Reference Bash, Moorman and Gunther2018), supporting the interpretation that surface mass balance dominates losses on this land-terminating glacier.
Decadal acceleration: 2000s–2010s (Hugonnet and others (Reference Hugonnet2021) tiles) Independent global DEM time series indicate a decadal acceleration of thinning consistent with our local results. The tile covering the Auyuittuq National Park sector ( $67^{\circ}\mathrm{N}, 65^{\circ}\mathrm{W}$) shows a decade-on-decade change in
 $dh/dt$ of
 $-0.57 \pm 0.21$ m a
 $^{-1}$ (2010s minus 2000s), and the Bylot sector tile (
 $73^{\circ}\mathrm{N}, 79^{\circ}\mathrm{W}$) shows
 $-0.24 \pm 0.14$ m a
 $^{-1}$ (Hugonnet and others, Reference Hugonnet2021). In this study, Auyuittuq National Park glacier
 $dh/dt$ became more negative in the 2010s, and Fountain Glacier’s inferred loss in 2010–20 exceeded that in 2000–10 (subset DEMs), corroborating the regional signal. These trends align with evidence that the early 21st century (post-2005) marks a transition to more extreme melt in Arctic Canada (e.g. Gardner and others (Reference Gardner, Moholdt, Arendt and Wouters2012); Schaffer and others (Reference Schaffer, Copland, Zdanowicz and Hock2023)). The acceleration is attributed to higher summer air temperatures, record-low late-summer sea-ice extent and reduced refreezing in the winter snowpack.
Taken together, the consistency among local geodetic estimates, regional syntheses and global DEM time series indicates a robust, decadal-scale intensification of mass loss across south-eastern Baffin and Bylot. Because many Auyuittuq National Park valley glaciers and Bylot outlets have hypsometries that place substantial area below the contemporary equilibrium-line altitude, modest additional ELA rises will disproportionately expand ablation-zone area and amplify geodetic lowering—even where planform retreat remains limited by valley confinement or polythermal buttressing. Practically, this implies (i) continued or increasing freshwater fluxes in the near term, (ii) potential underestimation of mass change by length or areal extent-only indices and (iii) the need for sustained geodetic monitoring with explicit treatment of firn processes to constrain projections of glacier contributions to sea level and regional hydrology.
7. Future research directions
The findings and limitations of this study motivate three priorities for future research in the CAA. These directions address (i) automation and robustness of historical photogrammetry, (ii) attribution of mass-balance variability to topography and microclimate and (iii) extension of temporal context using palaeo- and community-based records, thereby targeting the key gaps identified in the Results and Discussion.
1. Machine-learning–enabled enhancement of SfM photogrammetry: Recent advances in machine learning (ML) offer improved processing of challenging historical aerial imagery. For example, Maiwald and others (Reference Maiwald, Feurer and Eltner2023) combined the SuperGlue and DISK neural networks to overcome feature-matching limitations, achieving rotational invariance and tile-based handling of high-resolution images. The integration of these ML-based descriptors enhances match point detection in low-texture regions, such as glacier accumulation zones, where conventional operators often fail. This increased tie-point density facilitates a more rigid Bundle Block Adjustment (BBA), thereby mitigating the non-linear geometric “warps” and systematic biases common in historical reconstructions. Adapting and benchmarking such workflows for multi-temporal glacier datasets, particularly legacy missions like CORONA or ARGON, will improve alignment accuracy, reduce residuals relative to conventional SfM and enable more reproducible uncertainty quantification.
2. Topographic and microclimatic controls on mass-balance variability: The observed negative association between HI and annual geodetic mass balance warrants targeted analysis to disentangle hypsometric exposure from co-varying topography and microclimate. Future work should augment or replace HI with ELA–relative diagnostics (e.g. fraction of area below the ELA) derived from high-resolution DEMs with explicit propagation of ELA uncertainty. A consistent geodetic mass balance record, complemented by targeted glaciological measurements, should then be analysed using hierarchical models that partition variance among climate forcing, hypsometry and microclimate while mitigating collinearity among slope, elevation and area. This approach will yield physically interpretable sensitivity metrics, support extrapolation to unsampled glaciers and identify thresholds beyond which glacier-wide thinning, rather than frontal retreat alone, dominates mass-loss trajectories.
3. Extending temporal context with palaeo- and community-based records: A multidisciplinary programme integrating the paleoclimate proxies possible in these regions (e.g. lake sediments, cosmogenic dating, etc.) and Indigenous oral histories should be pursued in the two parks to extend temporal coverage and contextualize recent change. For example, lacustrine sedimentary records may provide high-resolution environmental records over millennia and can frame present-day variability; for example, Miller and others (Reference Miller, Wolfe, Briner, Sauer and Nesje2005) reconstructed Holocene climate variations from Baffin Island cores. Oral histories (e.g. AROSS and ORHELIA initiatives) document more recent changes and associated impacts, guide site selection and enhance the cultural relevance of scientific interpretation. Combining these lines of evidence will improve attribution of current glacier change and inform projections under continued warming.
Pursued together, these priorities constitute an operational pipeline for the CAA: ML-enhanced historical photogrammetry delivers higher-quality elevation change data; hierarchical attribution links those changes to glacier form and local climate; and palaeo- and community-based records anchor interpretations in a longer temporal and societal frame. The resulting evidence base directly addresses outstanding limitations—data gaps across the CAA, challenges with historical imagery and uncertainties in void-filling—while strengthening monitoring and adaptation planning for ecosystems, water resources and cultural heritage across the region.
8. Conclusion
This study presents a glacier-specific, six-decade assessment of elevation and volume change on Baffin and Bylot Islands by reconstructing geodetic signals from historical aerial photography co-registered to modern satellite DEMs. Across six glaciers in Auyuittuq National Park and one in Sirmilik National Park, thinning since 1958/59 is spatially pervasive and sustained. Specific geodetic mass balances (GMBs) for Auyuittuq National Park span  $-0.22$ to
 $-0.35$ m w.e. a
 $^{-1}$ (1959–2021/22), while Fountain Glacier (SNP) averages
 $-0.35 \pm 0.02$ m w.e. a
 $^{-1}$ (1958–2022) (Table 6). Cumulatively, the analysed glaciers lost
 $\sim 4.76 \times 10^{9}$ m
 $^{3}$ of ice (
 $-4.05 \pm 0.29$ Gt), equivalent to
 $0.0112 \pm 0.0008$ mm global mean sea-level rise over the study period.
Climatic context from coastal Baffin stations shows coherent summer (June–August, JJA) warming and increased PDD since the late twentieth century, with no robust long-term trend in annual precipitation. Spatial variability in thinning is explained by morphometry and setting: steeper glaciers exhibit less-negative balances (higher effective elevations, self-shading, avalanche nourishment), whereas glaciers with proportionally greater low-elevation area thin faster due to hypsometric exposure of the ablation zone. Polythermal structure and surface properties may modulate this response locally—e.g. Fountain Glacier’s pronounced downwasting with comparatively modest length change, and debris-mediated melt damping on Caribou—demonstrating that length change alone can underestimate mass loss where lateral retreat and pervasive surface lowering dominate.
Methodologically, we show that historical photogrammetry can yield glacier-scale geodetic estimates in rugged High-Arctic terrain when combined with co-registration over stable terrain, spatial error modelling and targeted void infilling. Stable-terrain diagnostics indicate negligible residual bias (median  $\approx 0$ m) and dispersion of NMAD = 4.07 m (ANP) and 2.08 m (SNP) after correction—sufficient to resolve decadal signals at glacier scale. ArcticDEM is the most effective differencing reference in complex relief when mosaic temporal consistency is verified; TanDEM-X provides cloud-independent alignment control; the historical CDEM supplies longer-term context but is scale-limited. Excluding scenes or glaciers with
 $ \lt 80\%$ valid dDEM coverage (e.g. Highway, Sermilik) reduces bias at the cost of spatial completeness.
Two substantive limitations remain. First, ArcticDEM mosaics introduce minor temporal heterogeneity that cannot be fully removed in Auyuittuq National Park. Second, volume-to-mass conversion relies on a bulk density assumption ( $\rho = 850 \pm 60$ kg m
 $^{-3}$) and does not explicitly model firn evolution. Both effects likely bias GMB slightly negative where firn densification contributes to surface lowering. Nevertheless, agreement with independent regional syntheses and the decadal acceleration resolved in global DEM time series supports the robustness of the principal findings.
Beyond scientific implications, these findings carry direct relevance for Inuit communities in Pond Inlet and Pangnirtung, for whom glacier-fed watersheds support freshwater availability, landscape stability and traditional land use. Ongoing glacier mass loss and associated environmental changes pose tangible risks to these communities, emphasizing the need for enhanced monitoring programs, climate-resilient planning and integration of Indigenous knowledge in adaptation strategies.
Because many Auyuittuq National Park valley glaciers and Bylot outlets concentrate area at or below contemporary ELAs, continued summer warming will expand ablation-zone area and amplify downwasting even where planform retreat is constrained by valley geometry or polythermal buttressing. Practical consequences include (i) increased freshwater and sediment fluxes, (ii) evolving proglacial hazards associated with thinning and englacial–subglacial drainage and (iii) potential underestimation of mass change by length- or area-only indices. The workflow presented here—archival photogrammetry tied to rock-masked co-registration, hypsometric diagnostics—offers a scalable template for pan-Canadian Arctic monitoring.
Supplementary material
The supplementary material for this article can be found at https://doi.org/10.1017/jog.2026.10177.
Data availability statement
The scripts and workflows used in this research are publicly accessible via the following GitHub repositories:
Co-registration with Reference DEMs: https://github.com/cwywilson/Co-registration-with-reference-DEMs
Reference DEMs Quality Assessment: https://github.com/cwywilson/Reference-DEMs-quality-assessment
Calculation of Geodetic Mass Balance: https://github.com/cwywilson/Calculation-of-geodetic-mass-balance-and-its-uncertainty-assessment
OGGM Centreline: https://github.com/cwywilson/OGGM-Centerline
Regional Hypsometric Interpolation: https://github.com/cwywilson/Regional-hypsometric-interpolation
Uncertainty of Glacier Extent Delineation: https://github.com/cwywilson/Uncertainty-of-glacier-extent-delineation
The primary datasets produced in this study, including historical Digital Elevation Models (DEMs) and geodetic elevation-change products (dDEMs), are archived on Zenodo: https://doi.org/10.5281/zenodo.18884387. The Zenodo record provides the full file inventory, metadata, coordinate reference systems and processing documentation. For further information or technical assistance regarding the workflows, inquiries may be directed to the corresponding author.
Acknowledgements
We extend our sincere gratitude to the community members of Pangnirtung and Mittimatalik (Pond Inlet) for their invaluable support and hospitality during our fieldwork. This research was conducted with the operational support of Parks Canada’s Nunavut Field Unit under permit ANP-2022-41482. We also thank the German Aerospace Center (DLR) for generously providing the TanDEM-X data under the project DEMGLAC3690. This research received financial, logistical and in-kind support from several sources, including Queen’s University through the Queen’s Graduate Award, Parks Canada through a Partnership Agreement with the Nunavut Field Unit, the Canada Foundation for Innovation, the NSERC Discovery and Northern Supplement programs, the Canada Research Chairs Program and Natural Resources Canada’s Polar Continental Shelf Program. We sincerely thank the Scientific Editor and reviewers for their constructive and insightful feedback, which improved the clarity and presentation of the manuscript.


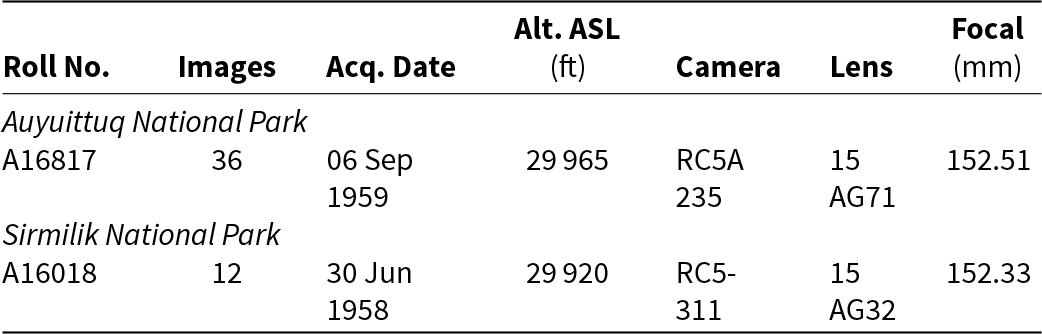
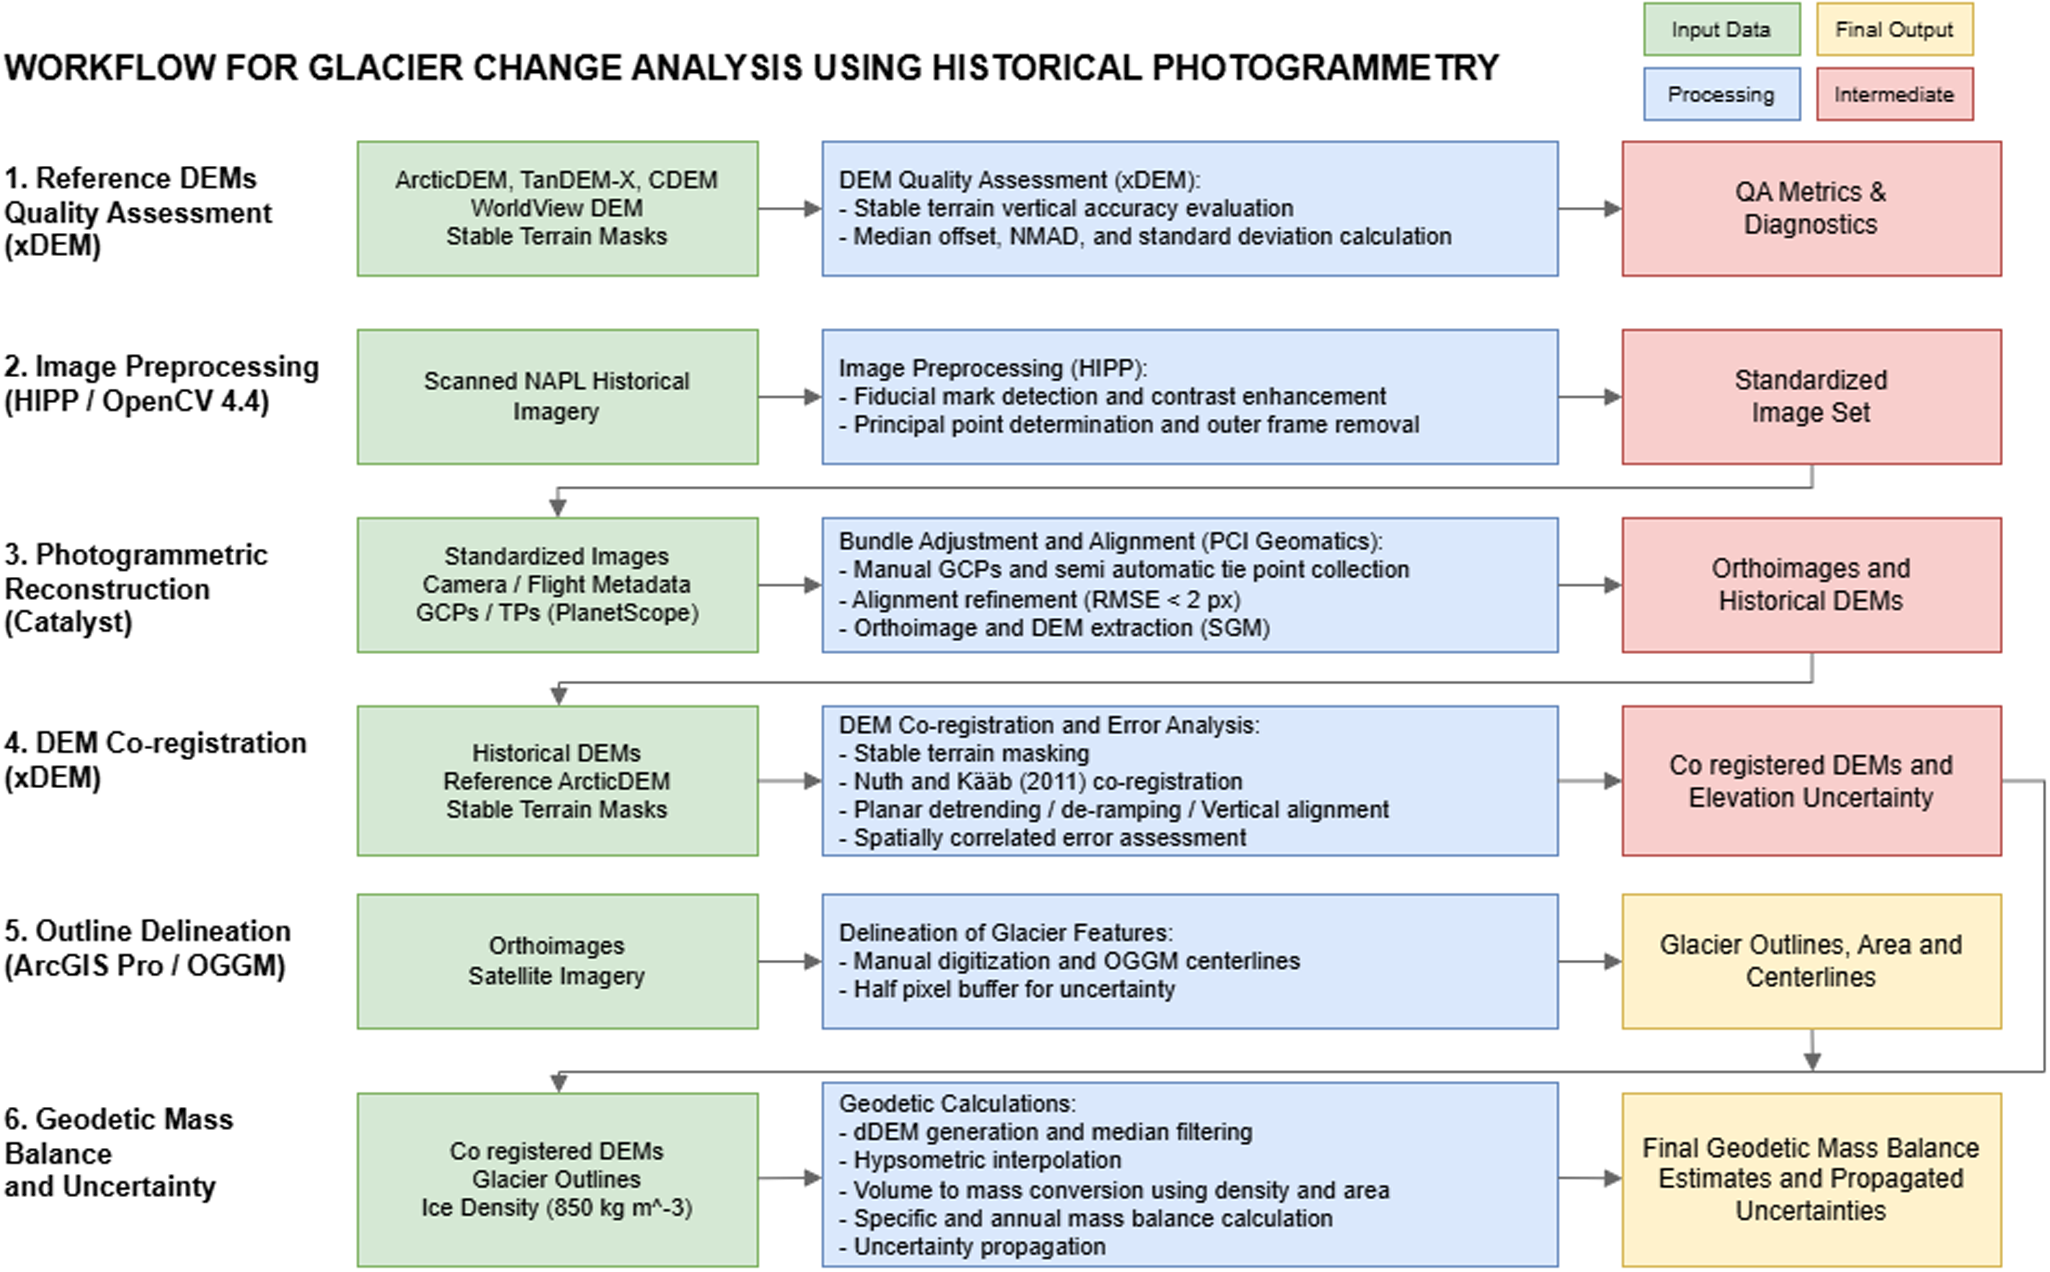
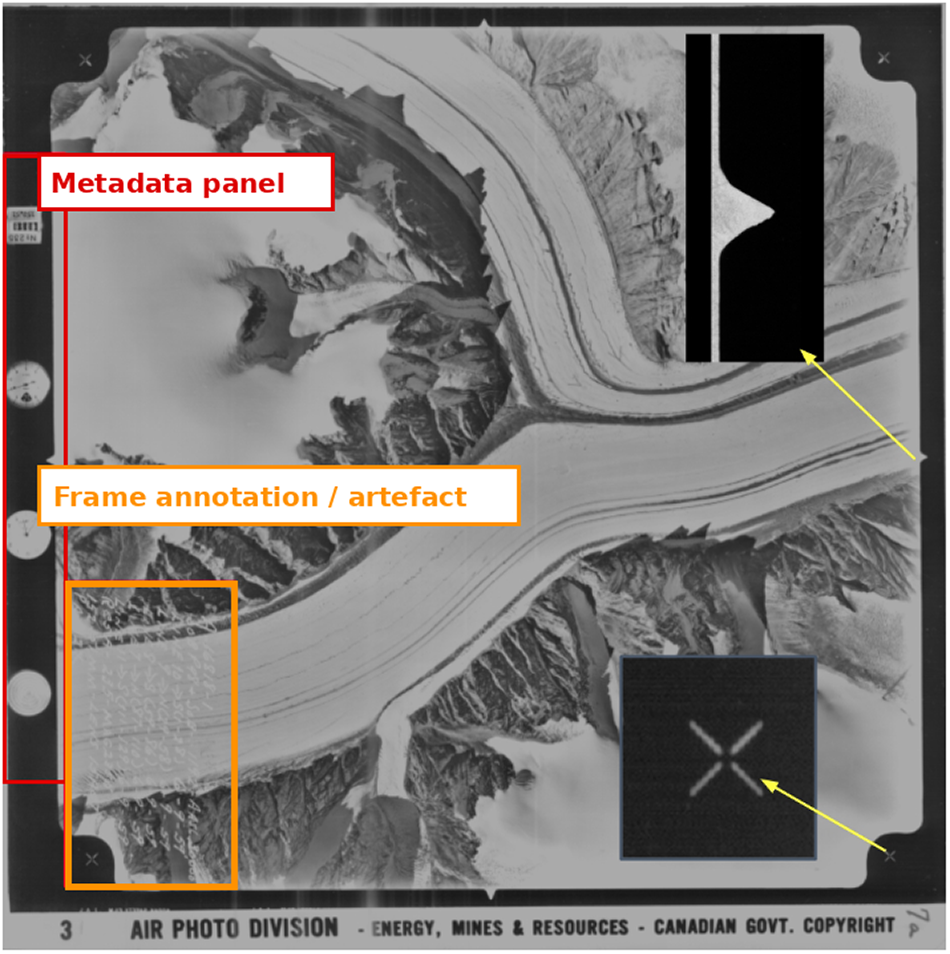
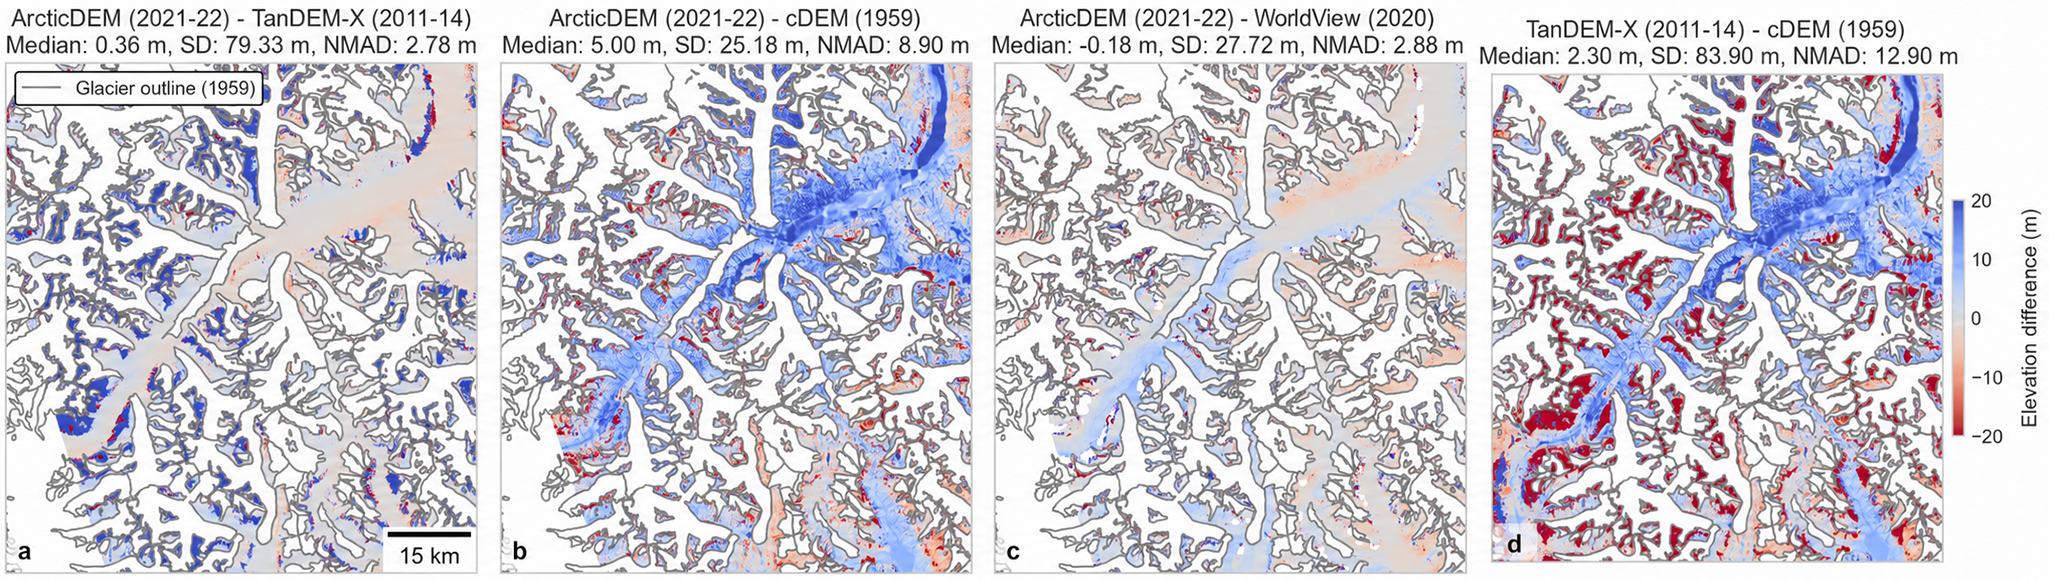


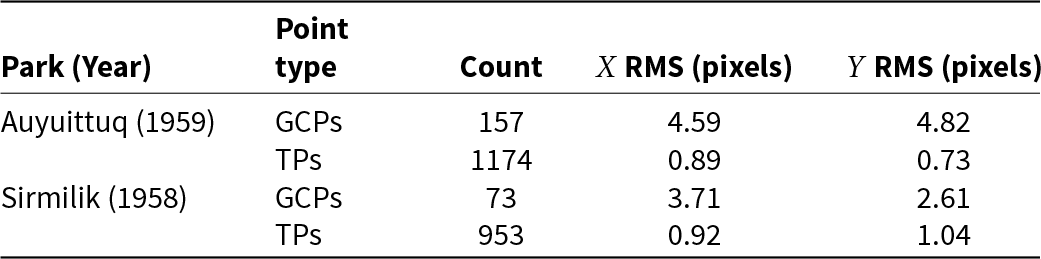


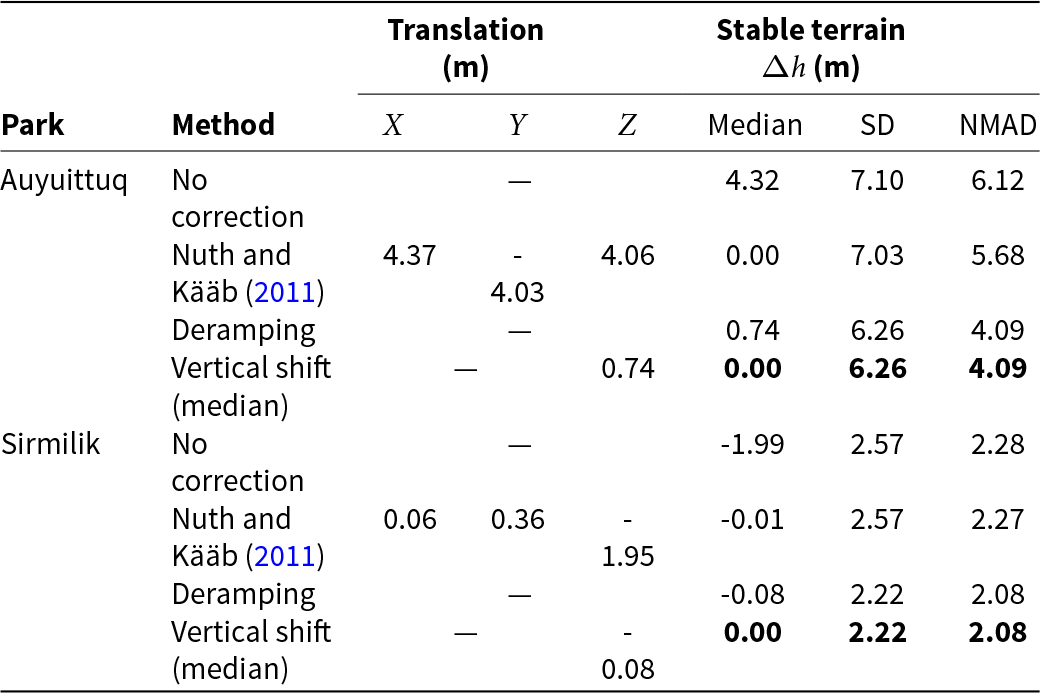


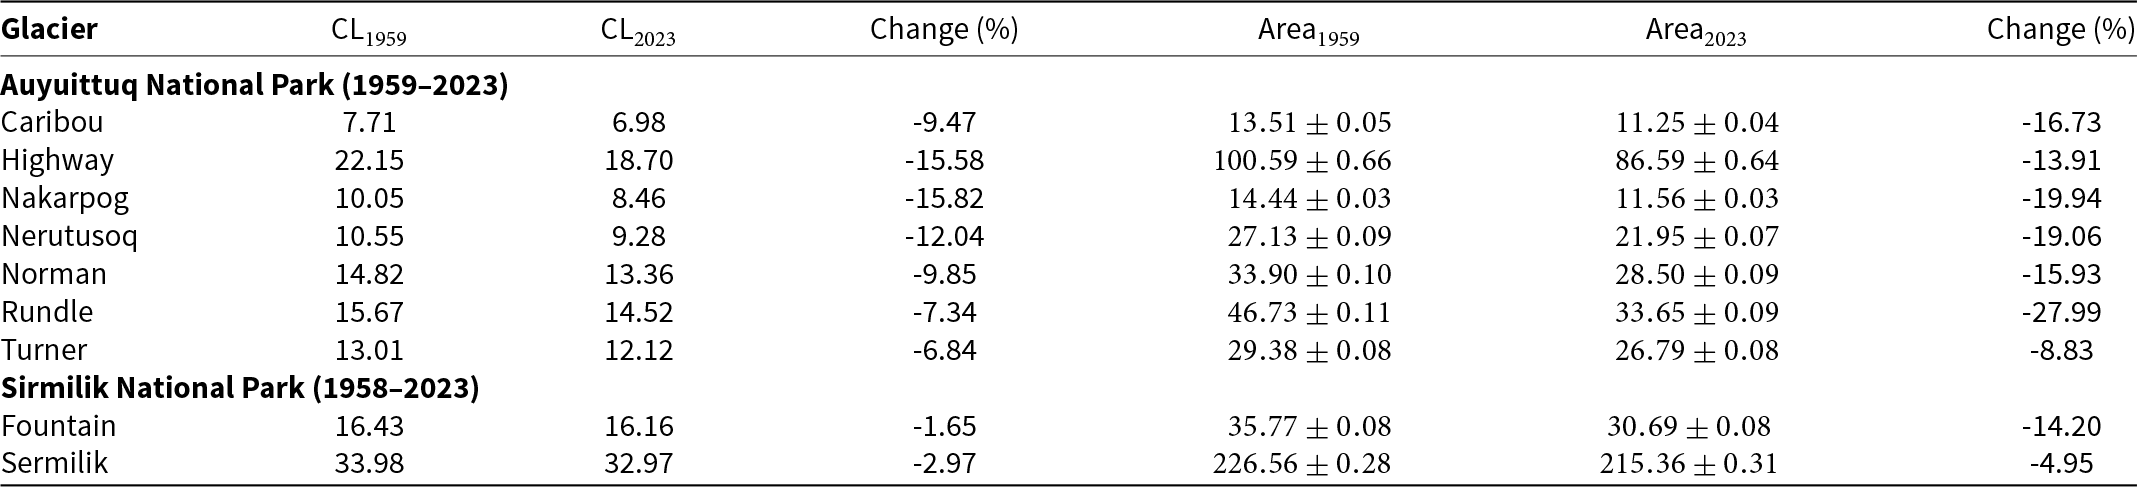

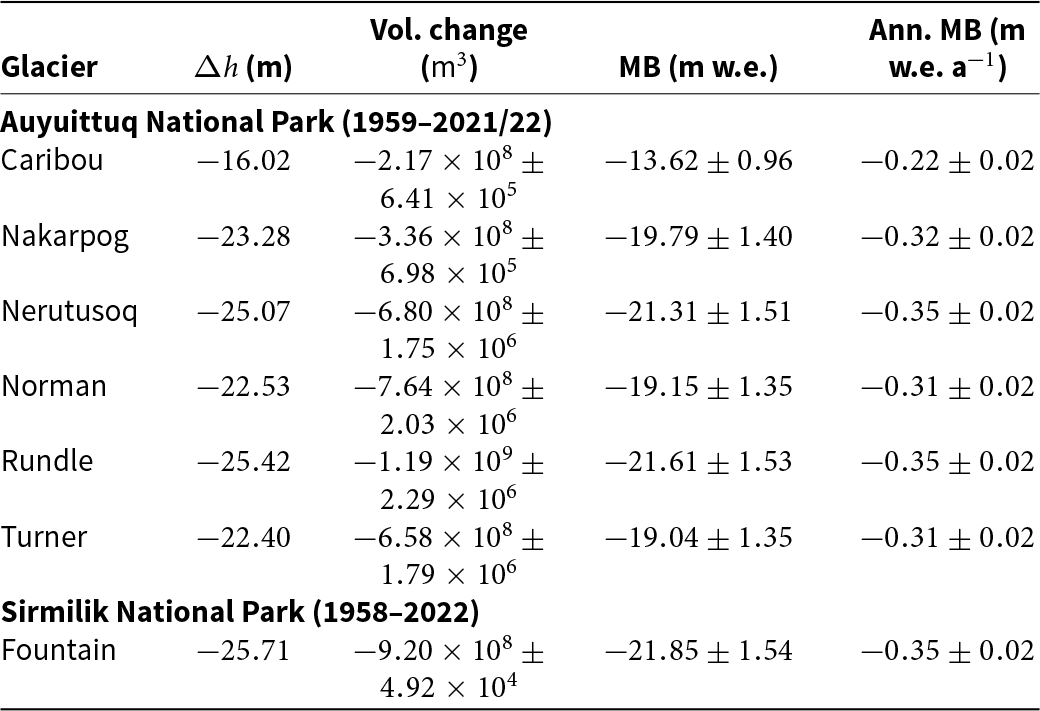


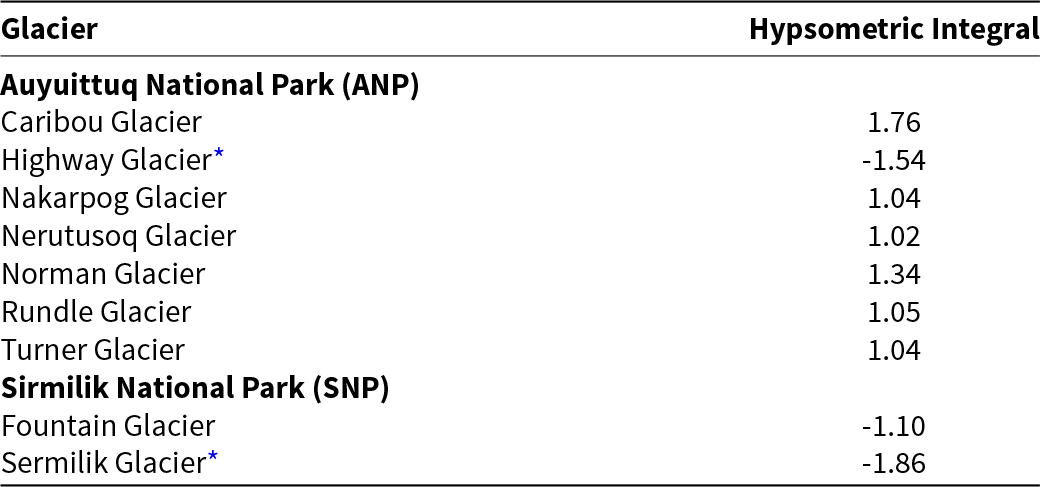


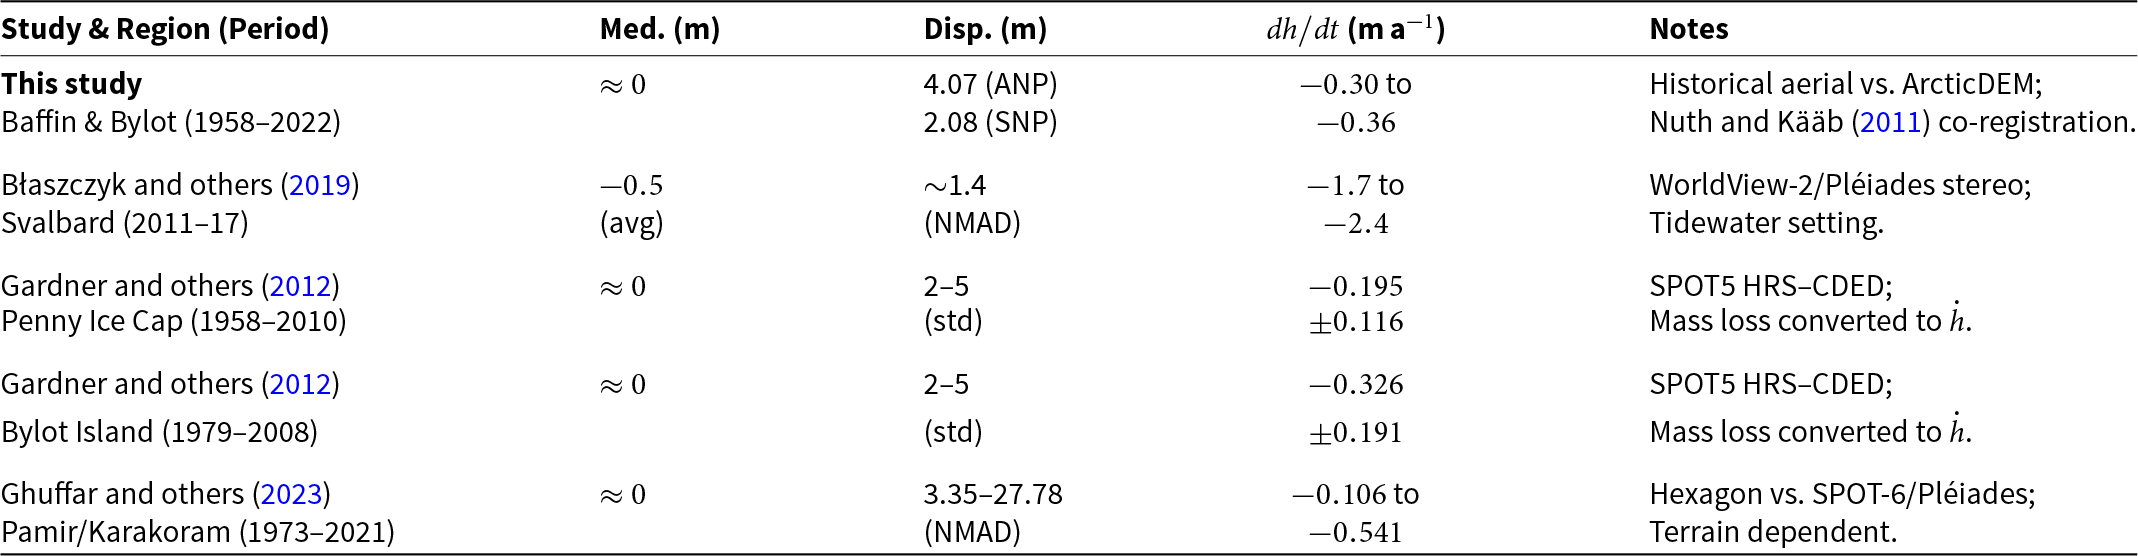



 Open access

