INTRODUCTION
Parkinson’s disease (PD) is a neurodegenerative disorder characterized by movement abnormalities, including dysfunction in the musculature essential for speech production. Cardinal motor signs of PD, such as muscular rigidity and bradykinesia, contribute to irregular airflow and air pressure in the vocal apparatus, diminished breath support, decreased laryngeal stability, and declining range of motion in the larynx, lips, jaws, and tongue (see Critchley, Reference Critchley1981; Goberman & Coelho, Reference Goberman and Coelho2002, for reviews). These physiological deficits can have severe negative effects on speech intelligibility, articulation, prosody, and speech rate (Ackermann & Ziegler, Reference Ackermann and Ziegler1991; Sapir, Ramig, & Fox, Reference Sapir, Ramig and Fox2008). In particular, studies repeatedly show that Parkinsonian speakers display reduced vocal intensity (loudness), and limited variation in the intensity and fundamental frequency (pitch) of their speaking voice, when compared to healthy, age-matched adults (Canter, Reference Canter1963; Cheang & Pell, Reference Cheang and Pell2007; Gamboa et al., Reference Gamboa, Jimenez-Jimenez, Nieto, Montojo, Orti-Pareja and Molina1997; Ho, Bradshaw, Iansek, & Alfredson, Reference Ho, Bradshaw, Iansek and Alfredson1999).
Dysfluencies are another characteristic of Parkinsonian speech that can impede the regular flow of discourse, making it sound halting and hesitant (as measured by the abundance of pauses and word repetitions). For example, during a spontaneous language generation task (interview paradigm), PD speakers were found to have significantly increased pauses per minute and pauses that were abnormally long when compared to healthy speakers without PD (Illes, Metter, Hanson, & Iritani, Reference Illes, Metter, Hanson and Iritani1988). In a study that used a reading paradigm to elicit discourse, PD patients produced pauses at inappropriate places in the sentence, such as within a phrase or clause (Hammen & Yorkston, Reference Hammen and Yorkston1996). Stuttering and repetition of syllables have also been observed more frequently in Parkinsonian speech (Goberman, Blomgren, & Metzger, in press). Thus, there can be little doubt that part of the motor disturbance in PD manifests in the form of acoustic alterations and dysfluencies in speech. But what about the effects of these impairments on family and peers who converse with individuals with PD? That is, how can we begin to estimate the social ramifications of speaking with PD from the perspective of listeners?
In fact, there is growing evidence that PD impacts negatively on many social or “pragmatic” communication abilities (see Pell & Monetta, Reference Pell and Monetta2008, for a recent overview). In a study that used open-ended questions to elicit conversation, PD speakers were rated as pragmatically “inappropriate” on several important communication measures, including the ability to initiate conversations, speech intelligibility, conciseness, and pause time (McNamara & Durso, Reference McNamara and Durso2003). The ability to use prosody, or tone of voice, to convey meaningful distinctions in communication is also frequently impaired in PD (Caekebeke, Jennekens-Schinkel, van der Linden, Buruma, & Roos, Reference Caekebeke, Jennekens-Schinkel, van der Linden, Buruma and Roos1991; Darkins, Fromkin, & Benson, Reference Darkins, Fromkin and Benson1988; Pell & Leonard, Reference Pell and Leonard2003). Recently, Cheang and Pell (Reference Cheang and Pell2007) compared the ability of 21 PD speakers and 21 healthy adults to produce acoustic distinctions marking lexical stress (e.g., “hotDOG” vs. “HOTdog”), word emphasis, and vocally-expressed emotions. Consistent with the literature, the PD speakers were restricted in the ability to modulate fundamental frequency (f0) and intensity to emphasize specific words in a sentence and to express certain emotions through prosody. Of special relevance here, a companion study established that these acoustic deficits had a measurable impact on how well Parkinsonian speakers were understood from the perspective of listeners (Pell, Cheang, & Leonard, Reference Pell, Cheang and Leonard2006). Twenty listeners who were naïve to patient status made significantly more errors when asked to identify which word in a sentence was being emphasized by PD relative to healthy speakers. Furthermore, PD patients were less successful in conveying many emotional meanings to listeners, especially anger, as listeners often rated their speech as sounding neutral (Pell et al., Reference Pell, Cheang and Leonard2006). These findings emphasize that limitations in prosody and speech motor control have a “real” impact on how listeners understand the intentions that Parkinsonian speakers wish to convey through their voice.
A critical extension of these ideas is that changes in the speaking voices of Parkinsonian adults could inadvertently affect what social impressions are formed about these individuals (i.e., in terms of perceived personality traits). This possibility was raised by Pitcairn, Clemie, Gray, & Pentland, (Reference Pitcairn, Clemie, Gray and Pentland1990), who required listeners to judge dialogue produced by four PD patients and four neurologically unimpaired participants during a semi-structured interview. Compared to controls, the PD speakers were rated as significantly more hostile, unhappy, tense, passive, anxious, suspicious, introverted, tough-minded, and bored, based on their voice. Although there were no overall group differences in perceived intelligence, listeners rated the PD speakers as experiencing less enjoyment from the conversation, as being less likeable, and as having a poorer relation to the interviewer. Acoustic analyses revealed that the PD speech samples displayed less f0 variation and a greater number of pauses relative to controls, although no direct link was established between the acoustic and perceptual measures. The findings of Pitcairn et al. are important in demonstrating that changes in speech patterns contribute to negative impressions of PD patients by listeners unaware of their disease status, a phenomenon that could act as a serious social barrier for these individuals. However, these conclusions are based on recordings from only four PD patients, which greatly limits the generalizability of these findings to the PD population without further study.
In the present investigation, we elicited discourse recordings from a much larger group of PD patients and healthy adults described in earlier studies (Cheang & Pell, Reference Cheang and Pell2007; Pell & Leonard, Reference Pell and Leonard2003; Pell et al., Reference Pell, Cheang and Leonard2006) to test whether changes in the speaking voices of Parkinsonian adults promote negative evaluations of these individuals. Here, we used a picture description task to better control the linguistic content of discourse samples obtained from each group, ensuring that our findings reflect how listeners perceive PD speakers based on attributes of their speaking voice. We also conducted acoustic analyses of the recordings to investigate whether certain characteristics of Parkinsonian speech are strongly associated with changes in linguistic or social impressions drawn about PD speakers. Based on Pitcairn et al.’s (Reference Pitcairn, Clemie, Gray and Pentland1990) findings, we predicted that listeners would derive negative impressions about the personality of PD speakers when listening to them speak, although these impressions should not reflect basic difficulties with linguistic demands of the task or the ability to generate discourse in PD (Pell & Monetta, Reference Pell and Monetta2008). Rather, we expected that negative impressions of PD speakers would be tied to changes in certain acoustic parameters of Parkinsonian speech, such as restrictions in voice intensity, f0, or temporal abnormalities.
METHOD
Participants
Thirty participants (15 female) were recruited from McGill University to rate discourse samples produced by adults with and without PD. The listeners had a mean age of 24.2 years (SD = 5.8, range: 18–40) and 15.7 mean years of education (SD = 2.1, range: 13–20). All listeners had spoken English since birth and had good hearing as determined by self-report.
Materials
The stimuli were recorded discourse samples produced by English-speaking patients with idiopathic Parkinson’s disease (PD group) and healthy control participants (HC group). Discourse samples were obtained as part of a battery of receptive and expressive speech tasks completed by the same group of PD and HC participants (Cheang & Pell, Reference Cheang and Pell2007; Pell et al., Reference Pell, Cheang and Leonard2006; Pell & Leonard, Reference Pell and Leonard2003, Reference Pell and Leonard2005). Here, speech samples were used as stimuli that were judged using rating scales to obtain a measure of listeners’ impressions of the speakers.
Speaker characteristics
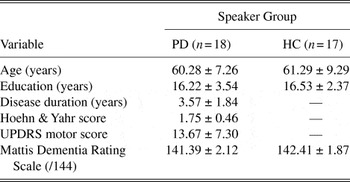
Eighteen PD speakers (9 female) and 17 HC speakers (9 female) provided discourse samples. Three PD and 4 HC speakers from the original group were excluded because they spoke non-North American English dialects, which could potentially bias listener impressions independent of disease status. As summarized in Table 1, individuals in the PD and HC groups were closely matched for age and education. With the exception of PD, none of the speakers had a history of neurological or psychiatric problems. As described by Pell et al. (Reference Pell, Cheang and Leonard2006), idiopathic PD was confirmed by a neurologist and fell within the mild to moderate severity range according to accepted motor criteria. All but one of the PD speakers were receiving anti-Parkinsonian medication at the time of testing. All recordings and testing were conducted during the on-state. The absence of dementia in all speakers was confirmed using the Mattis Dementia Rating Scale (see Table 1 for details).
Demographic and clinical features of speakers with Parkinson’s disease (PD) and healthy control (HC) participants (mean ± standard deviation)

Note
UPDRS = Unified Parkinson’s Disease Rating Scale.
PD and HC speakers underwent a battery of neuropsychological tests to assess cognitive functioning; both groups scored similarly on many standardized measures of visual discrimination (Benton face and visual form subtests), attention, and executive function (e.g., Wisconsin Card Sorting Test; Trails Test; see Pell & Leonard, Reference Pell and Leonard2005, for detailed results). All PD and HC speakers were screened for depression using the Hamilton Depression Inventory; one HC and two PD speakers fell in the mild depression range (score of 10–12). As groups, PD and HC speakers scored well below the cutoff for mild depression (PD: M = 4.72 ± 3.36; HC: M = 2.41 ± 2.78). As reported by Pell et al. (Reference Pell, Cheang and Leonard2006), the intelligibility of each PD speaker was evaluated by a speech-language pathologist, who rated a subset of the discourse samples presented in this study. There was very little disturbance of speech intelligibility in the PD group, as all speakers received ratings indicating “no disorder” or only “slight disorder” on a four-point scale. Normal hearing thresholds for speech comprehension were established for all speakers by means of a pure-tone audiometric exam (minimum 30 db HL at 0.5, 1, and 2 kHz).
Discourse elicitation and recording procedure
To obtain speech samples for the experiment, each PD and HC speaker was shown two black-and-white line drawings of scenes taken from the Discourse Comprehension Test (Brookshire & Nicholas, Reference Brookshire and Nicholas1993). One picture depicted a birthday party (CAKE) and the other showed firemen rescuing a cat in a tree (FIRE). Speakers were instructed to describe “what is happening” in each picture, and their response was recorded onto digital audiotape by a high-quality, head-mounted microphone. The full recording of the description was subsequently transferred to a computer (in digital format) to serve as an experimental item. The speech samples were variable in duration as there was no limit on the time allotted to describe the picture. For certain items, the examiner prompted a speaker to describe further details about the picture and could be heard in the background of the recordings; in these cases, the discourse sample was always cut before the prompt at the point where the speaker naturally terminated their description. A total of 70 discourse samples (PD = 18 speakers × 2 pictures; HC = 17 speakers × 2 pictures) were entered into a perceptual experiment using SuperLab 4.0 presentation software on a laptop computer.
Discourse rating task and procedures
For the main experiment, 30 listeners rated each of the 70 discourse samples in two separate tasks: one task presented eight scales measuring personality traits of the speaker (“speaker impression task”); and a second task presented six scales for rating the linguistic content of the description (“content impression task”). The scales were linear and continuous, modeled after those used by Pitcairn et al. (Reference Pitcairn, Clemie, Gray and Pentland1990) and Miller, Noble, Jones, Allcock, & Burn (Reference Miller, Noble, Jones, Allcock and Burn2008), with two adjectives presented at opposing ends of a straight line and a mark in the middle to signify the midpoint (Table 2 presents the exact scales used). There were no numerical markings seen by the listeners to ensure the perception of a continuum. The adjectives were counterbalanced to present the positive attribute of the scale at the left or right end of the continuum with equal frequency across participants. Furthermore, two versions of the experiment were used to counterbalance the order in which the scales for each task were viewed by listeners after each recording (15 listeners completed each version). In both tasks, recordings were blocked according to which picture was being described (CAKE or FIRE), and corresponding PD and HC recordings were randomized within each block. The order for rating CAKE and FIRE descriptions was counterbalanced across participants in each rating task. All listeners completed the speaker impression task before the content impression task, as our primary outcome measure was the speaker impression ratings, and we did not want these to be influenced by drawing conscious attention to what the speaker was saying when performing the content ratings.
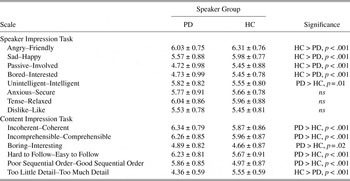
Listener ratings of speakers with Parkinson’s disease (PD) and healthy control (HC) participants (mean ± standard deviation)

Note
Scale ratings range from 1–9, left to right (e.g., on the Angry–Friendly scale, 1 = angriest and 9 = friendliest). The higher rating therefore reflects a more favorable impression.
Listeners were tested individually in a quiet laboratory on two occasions (separated by at least one day). Participants had no knowledge that the study pertained to Parkinson’s disease and were unaware that some of the speech samples were produced by adults with PD. During the first testing session (speaker impression task), listeners were told that they would hear different speakers describing a picture and that they should listen carefully to each person’s voice to form an impression of the speaker and his or her personality. The picture was presented on the computer screen as the participant listened to the recording over headphones, adjusted to a comfortable listening level. After each recording, the eight speaker impression rating scales were presented in sequence and listeners responded by clicking on each scale, using the mouse, at a point that corresponded to their impression of the voice. Responses were converted to numbers by the computer on a scale from 1 to 9 (1 being the leftmost end of the scale, 5 being the middle, and 9 being the rightmost end). On a subsequent testing session, listeners were again instructed to listen to the recordings, but this time to focus on the linguistic content of the speech (content impression task). After each recording, listeners responded in the same manner using the six content impression scales. Both tasks always began with three practice trials. After completing the second session, listeners were compensated for their participation ($30 CAD). All research procedures were ethically approved by a McGill University Review panel in accordance with the Helsinki Declaration.
Acoustic analyses
To characterize basic acoustic features of the PD and HC speakers, the 70 discourse samples were analyzed using Praat software (Boersma & Weenink, Reference Boersma and Weenink2009). Analyses focused on common measures of speech fluency, pitch (f0), volume (intensity), and voice quality. To characterize speech (dys)fluency, we computed the total duration of each speech sample (seconds), the mean pause length (seconds), and percent pause time. A pause was defined as silence exceeding 200 ms, considered the time necessary to restore subglottal pressure for articulation (Harel, Cannizzaro, Cohen, Reilly, & Snyder, Reference Harel, Cannizzaro, Cohen, Reilly and Snyder2004; Illes et al., Reference Illes, Metter, Hanson and Iritani1988; Nishio & Niimi, Reference Nishio and Niimi2001). Percent pause time was calculated with the following formula: (Total Pause Time / Total Duration) × 100 (Goberman & Elmer, Reference Goberman and Elmer2005).
To characterize speaker f0 and intensity, measures were extracted from two intervals of each recording: from speech onset to the second pause and from the second-to-last pause to speech offset. For each interval, the mean and standard deviation of f0 (in Hz) and intensity (in dB) were automatically computed and then averaged separately for each measure. To allow comparisons of f0 measures, which combine male and female speakers in each group, we normalized f0 mean and standard deviation measures for each individual speaker to z scores prior to averaging the interval measures, following Pell (Reference Pell1999). Finally, we calculated the harmonics-to-noise ratio (HNR) of each sample as a measure of speaker voice quality. Compared to a clear voice, a hoarse voice has noise components that replace the harmonic components leading to a lower HNR (Kojima, Gould, Lambiase, & Isshiki, Reference Kojima, Gould, Lambiase and Isshiki1980; Yumoto & Gould, Reference Yumoto and Gould1982). The HNR was obtained by isolating 50-ms portions of the following vowels: /ei/ in ‘cake’ and /a/ in ‘dog’ in the CAKE samples, and /i/ in ‘tree’ and /ae/ in ‘cat’ in the FIRE samples. The four vowel measures were averaged to estimate the HNR for each speaker.
RESULTS
For each rating task, we analyzed the mean ratings assigned by listeners on each 9-point scale using analysis of variance (ANOVA). To simplify data interpretation, we transformed the ratings, so that for all scales, a lower numerical rating reflects a more negative impression, and a higher rating reflects a more favorable impression. Table 2 furnishes the mean ratings assigned to PD and HC speaker groups on each scale in both tasks.
Speaker Impression Task
A series of 1-way ANOVAs was performed on each speaker impression scale, with Speaker (PD, HC) as the independent variable. As summarized in Table 2, a significant Speaker effect was observed for the following scales: Angry-Friendly, F(1, 29) = 24.92, p < .001; Bored-Interested, F(1, 29) = 59.78, p < .001; Sad-Happy, F(1, 29) = 52.56, p < .001; Passive-Involved, F(1, 29) = 77.59, p < .001; and Unintelligent-Intelligent, F(1, 29) = 7.58, p = 0.01. Post hoc Tukey’s honestly significant difference (HSD) tests (p = .05) revealed that PD speakers were rated as significantly less friendly, less interested, less happy, less involved, and more intelligent than HC speakers. There was no significant effect of Speaker on ratings assigned for the Anxious-Secure, Dislike-Like, or Tense-Relaxed scales (all F’s(1, 29) < 2.12, p’s > .16).
Content Impression Task
Another series of 1-way ANOVAs, with Speaker (PD, HC) as the independent variable, then considered listeners’ impressions of the content of the same discourse samples. A significant effect of Speaker was observed for all six scales: Incoherent–Coherent, F(1, 29) = 29.53, p < .001; Incomprehensible–Comprehensible, F(1, 29) = 14.31, p < .001; Not enough detail–Too much detail, F(1, 29) = 210.41, p < .001; Hard to follow–Easy to follow, F(1, 29) = 22.74, p < .001; Boring–Interesting, F(1, 29) = 5.62, p = .02; and Poor sequential order–Good sequential order, F(1, 29) = 33.37, p < .001. These effects are summarized in Table 2. Post hoc (Tukey) comparisons (p = .05) indicated that listeners rated the content of discourse produced by PD speakers as more coherent, comprehensible, easier to follow, more interesting, having less detail, and having a better sequential order compared to HC speakers.
Overall Task Comparisons
To directly evaluate how listener impressions varied according to Speaker (PD, HC) and what listeners were asked to focus on (Task; speaker, content), these two factors were entered simultaneously as repeated measures in a 2 × 2 ANOVA (the mean ratings for each listener were averaged across scales within each Task). The ANOVA yielded a significant Task × Speaker interaction, F(1, 29) = 23.74, p < .0001. As illustrated in Figure 1, post hoc Tukey’s tests (p = .05) indicated that listeners rated PD speakers more negatively than HC speakers on the speaker impression task overall, whereas the PD patients were rated more positively than HC participants on the content impression task overall.
Mean listener ratings of speakers with Parkinson’s disease (PD) and healthy control (HC) participants by task.

Relationship between Speaker Impressions and Acoustic Measures
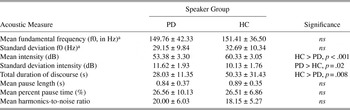
To determine whether speech patterns of the PD and HC participants differed acoustically, we performed a 1-way ANOVA for each acoustic parameter, with Speaker (PD, HC) as the independent variable. A significant Speaker difference emerged for mean intensity, F(1, 33) = 41.71, p < .001; standard deviation of intensity, F(1, 33) = 5.72, p = .02; and total discourse duration, F(1, 33) = 7.97, p = .008. Post hoc Tukey tests (p = .05) demonstrated that PD speakers had a lower mean intensity, a higher standard deviation of intensity, and a shorter total discourse duration than HC speakers. There was no significant group difference for mean f0, standard deviation f0, mean pause length, percent pause time, or HNR, all F’s(1, 33) < 1.07, p’s > .30. Table 3 reports mean values for each acoustic measure.
Acoustic characteristics of discourse produced by speakers with Parkinson’s disease (PD) and healthy control (HC) participants (mean ± standard deviation)

Note
a The mean values shown here are the uncorrected measurements. Statistical significance was calculated using normalized values.
Pearson correlations (p < .05) were calculated to explore the relationship between acoustic measures and ratings of PD speakers on the speaker impression task. There was a significant positive correlation between the mean intensity of PD speech and ratings on the Passive–Involved scale (r = .47). A significant inverse relationship was observed between intensity variation (standard deviation) and ratings on the Angry–Friendly scale (r = −.47), Bored–Interested scale (r = −.64), Sad–Happy scale (r = −.57), and Passive–Involved scale (r = −.62). Results also showed significant negative correlations between PD speakers’ percent pause time and ratings on the Angry–Friendly scale (r = −.51), Bored–Interested scale (r = −.69), Sad–Happy scale (r = −.70), Passive–Involved scale (r = −.74), and Unintelligent–Intelligent scale (r = −.76). Finally, significant negative correlations emerged between PD speakers’ mean pause length and ratings on the Angry–Friendly scale (r = −.51), Bored–Interested scale (r = −.71), Sad–Happy scale (r = −.72), Passive–Involved scale (r = −75), and Unintelligent–Intelligent scale (r = −.81).
DISCUSSION
This study investigated how adult speakers with PD are perceived by listeners who are unaware of their disease, and explored whether acoustic changes in their speech may be contributing to listener impressions. On the speaker impression task, our main finding was that PD speakers are rated as sounding significantly less happy, friendly, interested, and involved compared to healthy speakers. These findings corroborate data reported by Pitcairn et al. (Reference Pitcairn, Clemie, Gray and Pentland1990), which also show that listeners perceive PD speakers as less happy, friendly, interested, and more passive during a conversational interview. Using a larger sample size of speakers and listeners, our results lend support to the notion that listeners perceive PD speakers as less engaged and more emotionally “flat,” based solely on vocal characteristics. The prospect that many adults with PD are viewed as unfriendly and disinterested in communicative settings is likely to have far-reaching effects on their social lives and psychological well-being.
Although PD speakers were perceived more negatively for certain attributes, we uncovered no evidence that listeners rated PD speakers as less likeable, more anxious, or more tense than HC speakers, contrary to Pitcairn et al.’s (Reference Pitcairn, Clemie, Gray and Pentland1990) findings. Because Pitcairn et al. used speech derived from a conversational interview (rather than picture description), it is possible that their task elicited feelings of anxiety in their PD speakers because of the interpersonal nature of the situation. That is, differences in the social context for obtaining speech samples, and their effects on the speaker’s comfort, may explain some of the observed differences in listener impressions between studies related to perceived tension and anxiety in PD. Another distinction was observed on the unintelligent–intelligent scale; here, we found that PD speakers were rated as more intelligent than HC speakers, whereas Pitcairn et al. found no difference on this dimension. These findings demonstrate that despite the negative effects of PD on speech production, listeners do not perceive PD speakers as less intelligent based on their speech cues. Moreover, it cannot be concluded that a lack of perceived intelligence contributes to certain negative evaluations drawn about PD speakers.
Similarly, negative social impressions of PD speakers were not influenced by linguistic dimensions of their discourse, because listeners rated speech samples produced by the PD group as more positive (i.e., more comprehensible, coherent, interesting, easy to follow, and in a better sequential order) than those produced by healthy speakers. We did not expect our patients to have major language deficits that would impede the ability to generate narratives and produce grammatically correct sentences (e.g., Murray & Lenz, Reference Murray and Lenz2001). However, the language output of PD patients is sometimes perceived as less informative than that of healthy speakers (Cummings, Darkins, Mendez, Hill, & Benson, Reference Cummings, Darkins, Mendez, Hill and Benson1988; Murray, Reference Murray2000), and if true for our PD patients, negative impressions of the quality or quantity of their linguistic output could play a role in how social impressions are formed about these individuals. Our methods allow us to discount this possibility because, unexpectedly, the narratives of the PD speakers were rated more positively overall in the content impression task. Interestingly, listeners judged that the PD speakers provided less detail in their descriptions than HC speakers, which fits with the observation that the total duration of PD speech samples was significantly shorter than the HC samples (review Table 3). By speaking for a shorter length of time, one can speculate that our PD speakers focused more on describing main details of the pictures without providing extraneous, potentially tangential details; this factor could explain why Parkinsonian discourse was perceived as more coherent and easy to follow from the perspective of listeners. Regardless, it can be argued confidently that a failure to produce linguistically acceptable narratives was not responsible for negative social impressions of the PD speakers. Because our patients were not demented, depressed, and produced highly intelligible speech (Pell et al., Reference Pell, Cheang and Leonard2006), these factors are also unlikely to have contributed to impressions that the PD speakers are less friendly, happy, interested, and involved.
Role of Acoustic Variables on Listener Impressions of PD
To explore factors that could have contributed to negative listener impressions, we analyzed major acoustic properties of our PD and HC speech samples. As expected, the voices of PD speakers had lower mean intensity compared to HC speakers, a well-replicated finding in the literature (Ho et al., Reference Ho, Bradshaw, Iansek and Alfredson1999; Holmes, Oates, Phyland, & Hughes, Reference Holmes, Oates, Phyland and Hughes2000). Parkinsonian speech also exhibited greater variation (standard deviation) of intensity relative to HC speakers, a finding that is less consistently reported (Gamboa et al., Reference Gamboa, Jimenez-Jimenez, Nieto, Montojo, Orti-Pareja and Molina1997), although it fits with previous data indicating that PD patients have imprecise control of voice volume modulation during sustained speaking tasks (see Ho, Iansek, & Bradshaw, Reference Ho, Iansek and Bradshaw2001, for data). In contrast to intensity measures, there were no group differences in speakers’ fundamental frequency, percent pause time, pause duration, or harmonics-to-noise ratio.
In healthy speakers, sentences portraying emotions of boredom and sadness are characterized by a low mean intensity (Banse & Scherer, Reference Banse and Scherer1996). It can be hypothesized that the lower volume of PD discourse contributed to the impression of patients as bored, sad, or lacking positive emotion, and thus they were rated by listeners as less interested, involved, and happy while describing the pictures. In support of this idea, we observed a significant correlation within the PD group between changes in mean intensity and perceived “involvement,” implying that reductions in vocal intensity were responsible for some of the negative speaker impressions in our data. Similarly, measures of pause time and length – although they did not differ significantly between the two groups – demonstrated a significant, inverse relationship with ratings of speakers within the PD group. Specifically, PD speakers who produced longer pauses with increased pause time were rated as less friendly, happy, interested, involved, and intelligent. Interestingly, Alpert, Pouget, & Silva (Reference Alpert, Pouget and Silva1995) showed that by manipulating the duration of pauses to be longer, speakers with schizophrenia were rated as having a flatter affect; increased pause time is also a known acoustic correlate of major depression, which varies with the clinical state of depressed patients (e.g., Nilsonne, Reference Nilsonne1987). Pending further data, it is possible that hesitant speech that impedes the flow of natural discourse promotes the impression that PD speakers are less happy, friendly, or emotionally involved. In more severe PD patients, who produce greater dysfluencies than the ones studied here, one can predict that negative social impressions of these individuals would increase.
Although our results point to the likelihood that changes in vocal intensity (volume) and fluency (temporal parameters) promote negative impressions of PD speakers, we did not find evidence that voice quality (HNR) changes sometimes present in PD (Gamboa et al., Reference Gamboa, Jimenez-Jimenez, Nieto, Montojo, Orti-Pareja and Molina1997; Holmes et al., Reference Holmes, Oates, Phyland and Hughes2000) were a factor in personality judgments of PD speakers. Also, we anticipated that abnormalities in pitch modulation would contribute to negative impressions of PD patients, since Cheang and Pell (Reference Cheang and Pell2007) reported that the use of f0/pitch to convey sentence stress and certain emotional distinctions were impaired in the same PD patients. In healthy populations, increased f0 variability correlates with increased ratings of liveliness, competence, benevolence, and being a “good speaker” (Brown, Strong, & Rencher, Reference Brown, Strong and Rencher1974; Strangert & Gustafson, Reference Strangert and Gustafson2008; Traunmuller & Eriksson, Reference Traunmuller and Eriksson1995). However, f0 measures of discourse produced by the PD speakers did not differ from the HC group, and no correlations were observed in the PD group between f0 variation and listener impressions. Therefore, it cannot be concluded that f0 variation was contributing to impressions of speakers as sounding less engaging, friendly, or happy. In addition, the fact that f0 measures of Parkinsonian speech showed fewer differences from healthy speakers here in a more spontaneous discourse elicitation task, rather than when reading single sentences (Cheang & Pell, Reference Cheang and Pell2007), implies that acoustic “impairments” in PD are partly dependent on task demands. Future research should attempt to discern whether acoustic impairments and negative impressions of PD speakers vary as a function of the task or communication setting.
Future Directions
Taken as a whole, our results indicate that listeners have negative impressions of certain personality attributes of PD speakers; they interpret PD patients as lacking engagement in the conversation and as being less happy and friendly. Voice intensity reductions and speech dysfluencies appear to play the largest role in these evaluations. However, PD speakers are not perceived to be more anxious and tense, or less intelligent and likeable. Furthermore, the linguistic content of Parkinsonian discourse appears to remain relatively intact from the perspective of listeners; that is, nondemented adults in the mild to moderate stages of PD do not appear to have difficulties communicating ideas and concepts, as their verbalizations remained clear, comprehensible, and sufficiently understandable to listeners (cf. Murray, Reference Murray2000, for further data).
Our findings have broader implications for PD in the context of social relationships and interpersonal communication. When engaging in daily conversations, PD patients may find that their interaction with individuals unaware of their disease is altered or impeded by negative impressions formed by these individuals. This reaction is likely to create barriers for PD patients and lead to their withdrawal from social situations (Miller, Noble, Jones, & Burn, Reference Miller, Noble, Jones and Burn2006). Future studies should attempt to replicate and extend our findings to even more natural discourse settings (e.g., spontaneous dialogue between a PD speaker and a known vs. unknown interlocutor) to ensure that our results can be generalized to the daily lives of adults living with PD. We also did not look at patients’ self-reported difficulties in speech and communication. Recent studies show that speech impairments in PD lead to feelings of annoyance, frustration, inadequacy, and loss of control in communicating (Miller et al., Reference Miller, Noble, Jones and Burn2006, Reference Miller, Noble, Jones, Allcock and Burn2008). Such feelings may cause patients to consciously limit their speech and involvement in conversations. Future research should explore the relationship between PD patients’ self-perception of their communication abilities and listener impressions. Finally, because many of our PD speakers were relatively early in the disease, it would be beneficial to follow a group of PD patients over time to understand how voice changes, listener impressions, and self-impressions evolve over the course of the disease, to further comprehend the impacts these changes have on the social world of patients with PD.
ACKNOWLEDGMENTS
This research was financially supported by the Canadian Institute of Health Research, Institute of Aging (Operating Grants program) and by the Fonds de la Recherche en Santé du Québec (Chercheur-Boursier award to MDP). We thank Dr. Carol Leonard for help with participant recruitment and testing.