I. INTRODUCTION
Quantitative backscattered electron (qBSE) imaging is a useful tool to investigate localized variations in atomic density at high resolution (i.e., <1 μm) on two-dimensional (2D) surfaces. Application of qBSE imaging permits quantification of composition across a range of materials and has been commonly applied to mineralized tissues.Reference Ferguson, Bushby and Boyde1–Reference Smith, Schirer and Fazzalari11 Traditionally, metallic and carbon reference materialsReference Roschger, Fratzl, Eschberger and Klaushofer4, Reference Angker, Nockolds, Swain and Kilpatrick6, Reference Smith, Schirer and Fazzalari11–Reference Traini, Degidi, Iezzi, Artese and Piattelli14 have been used to quantify mineral content in mineralized tissues. However, limitations including channeling contrast, oxidization, and fixed composition make these less ideal reference materials. The development of alternative reference materials with adjustable compositions, which are amorphous, easily made, and cost-effective, will make qBSE imaging of mineralized tissues broadly available.
Application of qBSE imaging allows for visualization of local changes in mineral concentration within cortical and trabecular bone structures and has been applied to investigate variations with age and sex,Reference Boyde, Elliott and Jones3, Reference Skedros, Bloebaum, Bachus, Boyce and Constantz5, Reference Reid and Boyde15 loading conditions,Reference Kingsmill, Boyde, Davis, Howell and Rawlinson8 and disease states.Reference Ferguson, Bushby and Boyde1, Reference Roschger, Fratzl, Eschberger and Klaushofer4, Reference Tjhia, Odvina, Rao, Stover, Wang and Fyhrie9, Reference Zebaze, Jones, Pandy, Knackstedt and Seeman10, Reference Fratzl-Zelman, Morello, Lee, Rauch, Glorieux, Misof, Klaushofer and Roschger12 At every pixel in an image, the qBSE gray level (GL), ranging from 0 to 255, is proportional to the backscattered coefficient η, defined as the fraction of detected backscattered electrons (BSEs) divided by the total number of incident electrons.Reference Lloyd16, Reference Howell, Davy and Boyde17 Backscattering events are dependent on the atomic number of the element involved, and therefore, GL is also related to the composition of the sample.Reference Boyde and Jones18–Reference Goldstein, Newbury, Joy, Layman, Echlin, Lifshin, Sawyer and Michael20 Further, tissue-level measurement can be location matched to mechanical properties by use of nanoindentationReference Ferguson, Bushby and Boyde1, Reference Smith, Schirer and Fazzalari11, Reference Oyen, Ferguson, Bembey, Bushby and Boyde21 and provides insight into structure–property relationships of mineralized tissues.
Application of qBSE imaging to numerous samples necessitates multiple sessions over days and weeks, requiring the use of reference materials. Large fluctuations in beam current, detector brightness and contrast, accelerating voltage, working distance, filament fatigue, and electronic drift may influence the BSE detector output voltage and also the GL of the image. To ensure reproducible GL values, two reference materials, one of low atomic number set to a GL value of 0 and one with high atomic number set to 255, are selected to encompass the compositional range of the samples. While easily obtained and commonly used for calibration,Reference Roschger, Fratzl, Eschberger and Klaushofer4, Reference Angker, Nockolds, Swain and Kilpatrick6, Reference Smith, Schirer and Fazzalari11–Reference Traini, Degidi, Iezzi, Artese and Piattelli14 magnesium, aluminum, and carbon make less ideal qBSE references because they are macrocrystalline and can display visible channeling contrast. Further, the use of magnesium and aluminumReference Bloebaum, Skedros, Vajda, Bachus and Constantz2, Reference Boyce, Bloebaum, Bachus and Skedros13, Reference Vajda, Skedros and Bloebaum22 as reference materials creates an extremely narrow atomic number range (Z = 12–13) compared to mineralized tissues, which can span a larger range of mean atomic number (Z mean = 9–13).Reference Skedros, Bloebaum, Bachus, Boyce and Constantz5 Ideally, reference materials should encompass the whole range of Z mean values of interest to prevent backward extrapolation of the standardization curve. Alternatively, the use of carbon (Z = 6) as a low-Z reference expands the range of available atomic numbers yet decreases resolution in visualizing small mineral content variations—a direct result of stretching the 256 GLs over a compositional range larger than necessary.
In this study, we develop tunable lithium rubidium borosilicate glass reference materials, which can be selected to encompass the whole range of Z mean values of interest while maintaining high atomic number resolution. Application of these novel reference materials is demonstrated through an investigation of mineral volume fraction and mechanical properties of calcified tissues. Tissues were selected to span a wide range of mineral content from poorly mineralized (e.g., young mouse femur and calcified shark cartilage) to highly mineralized (e.g., whale tympanic bulla). Specifically, this study seeks to (i) demonstrate the efficacy of calibrated qBSE glass reference materials with tunable compositions to enable the high-resolution quantitation of mineral volume fraction; (ii) validate glass reference materials by comparing measured mineral content to microcomputed tomography (microCT) density and the mineral ash fraction for a wide range of mineralized tissues; and (iii) demonstrate location-matched measurements of mechanical properties with nanoindentation to mineral content obtained from qBSE imaging.
II. MATERIALS AND METHODS
A. Creation of glass reference materials
The glass system M(Li2O)·X(Rb2O)·(0.30)B2O3·(0.45)SiO2, where M = 0.25 − X and X = 0.00, 0.02, 0.05, 0.10, 0.15, was selected to span the atomic composition range of a wide variety of mineralized tissues. Borosilicate glasses are amorphous, display no channeling contrast, and are chemically stable over long periods Reference Islam, Holland and Scales23, Reference Ewing24 making them ideal long-term reference materials for qBSE imaging. Following the methods of Feller et al.,Reference Mullenbach, Franke, Ramm, Betzen, Kapoor, Lower, Munhollon, Berman, Affatigato and Feller25, Reference Feller, Lodden, Riley, Edwards, Croskrey, Schue, Liss, Stentz, Blair, Kelley, Smith, Singleton, Affatigato, Holland, Smith, Kamitoss, Varsamis and Ioannou26 the glasses were made from lithium carbonate (Li2CO3, Sigma-Aldrich), rubidium carbonate (Rb2CO3, Sigma-Aldrich, St. Louis, MO), silica (SiO2, Alfa Aesar, Ward Hill, MA), and boric acid (H3BO3, Sigma-Aldrich). Chemical compositions of all starting materials were known to more than 99% purity. Stoichiometric combinations were thoroughly mixed in a platinum crucible for 5 min to create batches of 8 g each. Each batch mixture was then melted at 1100 °C for 25 min. Measurements of weight loss taken after 15 min of heating indicated that the intended value of X was within ±2% of the target value. Bulk glasses were obtained by splat-quenching the melt between two brass plates with an estimated cooling rate of 103 °C/s.Reference Feller, Lodden, Riley, Edwards, Croskrey, Schue, Liss, Stentz, Blair, Kelley, Smith, Singleton, Affatigato, Holland, Smith, Kamitoss, Varsamis and Ioannou26 Two batches of each composition were combined and crushed with a mortar and pestle. This mixture was heated for 10 min, splat-quenched, crushed, and mixed, then repeated twice more before final glass formation. These multiple mixing steps helped to ensure a uniform final composition of the glasses. After final splat-quench, glasses were annealed for 4 h at 50 °C below T g (475–500 °C), as measured by differential scanning calorimetry (DSC). As a final step, glasses were slow-cooled overnight. Small sections of each glass were placed side-by-side and embedded in epoxy to form one glass reference block in which all glasses could be viewed in a single BSE image.
B. Calibration materials
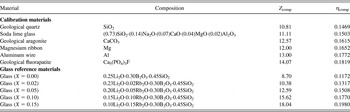
A wide range of engineered and geological materials were obtained for validation of the glass references. We compared the backscattered response of both composite materials and single element materials by selecting this range of materials. Materials are listed in Table I and included geological quartz (Boulder county, CO), soda lime glass (Corning glass microscope slide, Corning, NY), geological aragonite (Cairns Bay, Flinders, Australia), magnesium ribbon (Sigma-Aldrich), aluminum wire (Sigma-Aldrich), and geological fluorapatite (Iron county, UT). Samples were embedded together in epoxy to form a calibration sample block. Both the glass reference materials and calibration sample block were polished with diamond suspension paste to a 0.25-μm finish and coated with a thin layer of carbon before imaging. It should be noted that the use of gold as a conductive coating, while common,Reference Bloebaum, Skedros, Vajda, Bachus and Constantz2, Reference Skedros, Bloebaum, Bachus, Boyce and Constantz5, Reference Boyce, Bloebaum, Bachus and Skedros13, Reference Traini, Degidi, Iezzi, Artese and Piattelli14 can mask compositional changes as a direct result of its high atomic number. Rather, a carbon coating should be used because of its low atomic number,Reference Sinclair, Curtis, Koller and Bloebaum7 which does not mask small compositional variations. At low accelerating voltage (<2 kV), the presence of a surface coating of any type can contribute significantly to backscattered measurements and therefore should not be used with this technique.

C. BSE image capture
qBSE imaging was performed on a field-emission scanning electron microscope with the same settings for each imaging session (accelerating voltage 20 kV, aperture 60 μm, and working distance 15 mm). Use of at least a 1-h warm-up period of the microscope ensures constant operating conditions for each imaging session. Beam current remained stable at (435 ± 15) pA over a typical 4-h imaging session. In general, the backscatter coefficient is independent of acceleration voltage; however, at low voltages, roll-off for low atomic numbers can occur. Each captured image had a resolution of (1024 × 768) pixels with GL values ranging from 0 to 255. The nominal magnification was set to 90x for images of references and calibration materials and 500x or 800x for images of mineralized tissues.
At the beginning of a typical imaging session, brightness and contrast were adjusted to include the GL range of the samples and glass materials. All imaging settings, including brightness and contrast, were held constant throughout each imaging session. The acceptance angle of BSEs contributes significantly to measured GL values; thus, all samples, although loaded at different heights, were imaged at the same working distance of (15 ± 0.1) mm. Reference materials were imaged at the beginning, end, and every 20 min during each imaging session. Postprocessing of the qBSE images was performed with the software package ImageJ (National Institutes of Health, Bethesda, MD, http://rsb.info.nih.gov/ij/).
Ultimately, the raw weighted mean gray level (WMGL) of each reference material or sample was measured within a selected region of the material. The rawWMGL is given byReference Vajda, Skedros and Bloebaum22:
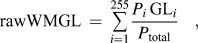 $${\rm{rawWMGL}}\, = \,\mathop\sum\limits_{i = 1}^{255} {{{P_i \,{\rm{GL}}_i } \over {P_{{\rm{total}}} }}} \quad,$$
where i is the index of a single pixel GL, Pi is the number of pixels at the ith gray level GLi, and P total is the total number of pixels. Black pixels from the applied threshold with i = 0 can artificially influence the value of the rawWMGL and are thus excluded from the calculation.
Conversion of rawWMGL values to calibrated values of WMGL requires the use of reference materials. The glass with X = 0, with composition 0.25(Li2O)·(0.30)B2O3·(0.45)SiO2, was selected as the low reference, whose rawWMGL is mapped to WMGL = 0. The glass with X = 0.15, with composition 0.10(Li2O)·0.15(Rb2O)·(0.30)B2O3·(0.45)SiO2, was selected as the high reference, with rawWMGL mapped to WMGL = 255. The rawWMGL of the reference materials was assumed to vary linearly with time between images. The rawWMGLs of both low and high reference materials were determined individually for each sample based on the time the sample image was taken.
Variability of measured rawWMGL across a single image of a glass reference was determined to be ±6 GL. Noted variations in GL were apparent in images taken at low magnification <200x, a direct result of variations in the backscatter detector. Error in the measured rawWMGL of the glass reference materials could lead to errors in calculated mineral volume fraction of up to 10%. However, by selecting data within 50% of the center of an image, measurement variations of rawWMGL were reduced to ±1.5 GL or only 2% error in calculated mineral volume fraction. Variations in GL could be further decreased by characterizing the backscatter detector response on a sample of uniform composition. Characterization of this nature represents important future work that could potentially improve the accuracy of qBSE methods. Further, long-term stability of these glasses was tested with multiple imaging sessions conducted over five months. On average, the rawWMGL of the references remained stable to ±4.5 GL, taken during a 1-h imaging session. After calibration to reference materials of X = 0 and X = 0.15, the remaining glasses (X = 0.02, 0.05, 0.10) had adjusted WMGL that varied only by ±1.2 GL over a 5-mo period.
D. BSE calculations
The WMGL is a relative measure of the fraction of BSEs as defined by the backscatter coefficient ηReference Goldstein, Newbury, Joy, Layman, Echlin, Lifshin, Sawyer and Michael20:
 $${\rm{\eta }}\, = \,{{{\rm{\eta }}_{{\rm{BSE}}} } \over {{\rm{\eta }}_{{\rm{TE}}} }}\quad,$$
where ηBSE is the number of BSEs detected and ηTE is the number of total incident electrons.Reference Goldstein, Newbury, Joy, Layman, Echlin, Lifshin, Sawyer and Michael20, Reference Joy27 Based on published BSE data for a large number of pure elements, numerous authors have proposed equations to relate η to atomic number Z. Reference Lloyd16, Reference Arnal, Verdier and Vincensini28–Reference Reuter, Shinoda, Kohra and Ichinokawa31 While these various equations give similar data for mid to high values of Z, only Arnal et al.Reference Arnal, Verdier and Vincensini28 give positive values for extremely low atomic number elements. Arnal’s formula is:
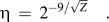 $${\rm{\eta }}\, = \,2^{{-9/{\sqrt Z}}} \quad.$$
The backscattering coefficient of a composite material ηcomp can be determined by the weighted mean η of the individual constituentsReference Howell, Davy and Boyde17, Reference Castaing32 according to Castaing’s formula [Eq. (4)], where Ci is the weight fraction and ηi is the backscattered coefficient of the ith constituent, respectively.
 $${\rm{\eta }}_{{\rm{comp}}} \, = \,\sum {C_i {\rm{\eta }}_i } \quad.$$
While other equations exist to predict ηcomp based on the individual components, Castaing’s formula gives the best experimental agreement across a wide range of crystalline and amorphous materials.Reference Howell, Davy and Boyde17, Reference Herrmann and Reimer30
Similarly, the apparent atomic number Z comp for a composite material can be determined from the weighted average of the atomic numbers of the individual constituentsReference Lloyd16 from
 $$Z_{{\rm{comp}}} \, = \,\sum {C_i Z_i } \quad,$$
where Zi is the atomic number of the of the ith atom and Ci is the same weight fraction in Eq. (4).
E. Determination of mineral volume fraction
Application of these reference materials allows for determination of ηcomp from qBSE-measured WMGL of an unknown material. In this study, the calibration curve was determined through use of the calibration materials and glass reference materials with known compositions as listed in Table I. Calculated values of ηcomp and Z comp for each reference material were determined from Eqs. (4) and (5), respectively.
Mineralized tissues can be approximated as a two-phase composite of organic matrix (OM) and hydroxyapatite (HA).Reference Howell, Davy and Boyde17 The measured value of ηcomp of the mineralized tissue is therefore a combination of the backscattered response of OM (ηOM) and HA (ηHA). From the measured ηcomp of the mineralized tissue, the mineral weight fraction (WTmin) can be calculated by
 $${\rm{\eta }}_{{\rm{comp}}} \, = \,{\rm{WT}}_{{\rm{min}}} {\rm{\eta }}_{{\rm{HA}}} \, + \,(1 - {\rm{WT}}_{{\rm{min}}} ){\rm{\eta }}_{{\rm{OM}}} \quad.$$
The mineral component was assumed to be mineralogical HA [Ca10(PO4)6(OH)2], which has calculated values Z comp = 14.07 and ηHA = 0.1815. The OM component includes both the organic portion of the mineralized tissue and infiltrated poly(methyl methacrylate) (PMMA). PMMA (C5H8O2) has calculated values Z comp = 6.24 and ηcomp = 0.0824. The chemical composition of the organic portion is less well known but consists of collagen, glycosaminoglycans, and proteoglycans. Here, we estimated the organic portion as protein with C, H, S, O, and N mass fractions of 0.525, 0.070, 0.015, 0.225, and 0.165, respectively.Reference Weast33, Reference Wong and Elliott34 Therefore, the OM has a calculated Z comp = 6.74 and ηcomp = 0.089. Here, we approximate the OM as the 50% combination of collagen and PMMA with Z OM = 6.5 and ηOM = 0.086. Finally, the mineral volume fraction (MV%) can be calculated from the mineral weight fraction (WTmin) and the density of OM (ρOM = 1.3 g/cm3) and HA (ρHA = 3.16 g/cm3)Reference Wong and Elliott34 by
 $$\!\!\!\!\!\!{\rm{MV}}\% \, = {{{\rm{WT}}_{{\rm{min}}} } \over {{\rm{WT}}_{{\rm{min}}} \, + \,\left\{ {(1 - {\rm{WT}}_{{\rm{min}}} )\left( {{{{\rm{\rho }}_{{\rm{HA}}} } \over {{\rm{\rho }}_{{\rm{OM}}} }}} \right)} \right\}}} \times {\rm{}}100.$$
The backscattered response of bone has successfully been approximated as a two-phase composite with similar assumptions as above.Reference Howell, Davy and Boyde17 However, it should be noted that this approximation involves assumption about the chemistry of the two phases, which can be highly variable with the type of tissue (e.g., bone versus enamel) or disease states.Reference Elliott, Kohn, Rakovan and Hughes35 Further application of Eq. (7) to mineralized tissues not embedded in PMMA would require determination of Z OM and ηOM for each case considered (e.g., dry, unembedded bone).
F. Mineralized tissues
1. Sample preparation
A varied range of mineralized tissues was obtained for this study, including samples of high mineral content (i.e., whale bulla, bobcat bulla, and bobcat periodic) and samples with lower mineral content (i.e., 2-wk-old mouse femur, carp dermal bone, and shark cartilage). Samples also included the mid-diaphysis of several femurs from a range of species including cow (Arapahoe Packing, Lafayette, CO), young lamb (Mountain Meadow Lamb Corporation, Denver, CO), and 2-wk- and 20-wk-old C57BL/6 mice (collected under full Institutional Animal Use and Care Committee approval at the University of Colorado at Boulder). For fresh samples, all nonosseous tissue was removed before dehydration in a series of ethanol solutions.
Two small neighboring sections from each mineralized tissue sample were cut with a low-speed diamond-wafering saw. MicroCT density was measured before traditional ashing to measure mineral weight percent using one section. The second section was embedded in PMMA, ground with a series of silicon carbide paper (300, 400, 600, and 1200 grit), then polished with successively finer diamond suspension pastes (particle size 6, 3, and 0.25 μm), and cleaned ultrasonically following each polishing step. Polished 2D surfaces were subjected to nanoindentation and qBSE measurements.
2. Mineral content
The entire first section of each tissue, averaging 25 mm3 in volume, was evaluated for volumetric bone mineral density with microCT (microCT 80; Scanco Medical AG; Bassersdorf, Switzerland), with isotropic voxels of 10 μm/side. The volumetric bone mineral density of each tissue was measured as described in the report of the American Society of Bone and Mineral Research Histomorphometry Nomenclature Committee.Reference Parfitt, Drezner, Glorieux, Kanis, Malluche, Meunier, Ott and Recker36 Any partially filled voxels containing void space were discarded.
Following microCT measurements, the same section was first defatted (in chloroform, 24 h), dried for 24 h at 105 °C, and then weighed to produce a measure of dry mass. Ashing for 24 h at 800 °C removed all organic components from the sample to measure the mineral mass. The ash mineral weight percent ASH-WTmin is equal to the mineral mass divided by the dry mass. Ash mineral volume percent is reported as ASH-MV% determined by ASH-WTmin and Eq. (7).
3. Nanoindentation
Nanoindentation tests were performed with a ramp-and-hold method with constant loading and unloading rates of 0.5 mN/s to a maximum load of 20 mN. A 120-s creep hold at maximum load was used to minimize the contribution of creep to the unloading curve. On each mineralized sample, 20 tests were run with a Berkovich indenter tip to measure reduced modulus E R on unloading by the Oliver–Pharr method.Reference Oliver and Pharr37 The Berkovich indenter tip was calibrated with a fused silica reference to determine the tip area function. Here, we report the plane strain modulus E′, which is related to E R through Eq. (8) and eliminates error in assuming the Poisson’s ratio of the sample.
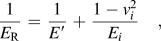 $${1 \over {E_{\rm{R}} }}\, = \,{1 \over {E\prime}}\, + \,{{1 - v_i^2 } \over {E_i }}\quad,$$
where Ei = 1140 GPa is the Young’s modulus and νi = 0.07 is the Poisson’s ratio, respectively, of the diamond indenter tip.
The effective volume of material contributing to the overall mechanical response depends on factors that include the indenter contact depth and the size of the tip. The effective volume can be described by a paraboloid of revolution with radius 3a and depth 5a, where a is the radius of a circle of contact between the tip and the surface.Reference Bushby38 The contact radius a was calculated from contact depth h c from
 $$a\, = \,h_{\rm{c}} \tan {\rm{\alpha }}\quad,$$
where α = 70.3° for a Berkovich tip. For each sample, h c was taken as the average value over all 20 indentation sites. qBSE imaging, collected as described above in Sec. II. C, was used to quantify the WMGL at each indent site to produce location-matched measurements. The WMGL was measured within a circular region of radius = 3a around each indentation imprint (NIH ImageJ software). Prior to measurement of WMGL, the residual indentation imprint, cracks, osteocyte lacuna, and any other void spaces were removed from analysis through a threshold routine. Further, indents close to cracks or other flaws were removed from all analysis.
III. RESULTS AND DISCUSSION
A. Tunable glass reference selection
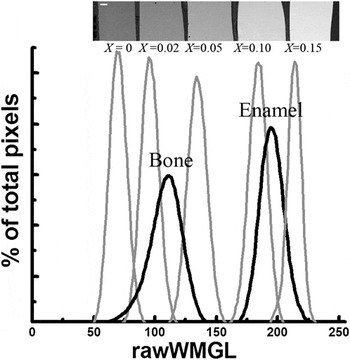
All five glasses (X = 0.00, 0.02, 0.05, 0.10, and 0.15) span the rawWMGL range of mineralized tissues of interest from bone to enamel (Fig. 1). The use of the lowest (X = 0.00) and highest (X = 0.15) references allow for investigation of materials with atomic number from Z = 9 to 18 (see Table I). Alternatively, a narrower range of reference materials may be selected to provide increased atomic number resolution for samples with less variation in atomic number. It is important to select reference materials whose WMGL fall at least one standard deviation σ outside the WMGL of the material of interest, to account for variability of localized sample composition. For this study, the high and low references (X = 0 and X = 0.15) were selected because their WMGL covered the range of WMGL of all mineralized tissues considered within ±σ. Alternatively, improved resolution in the analysis of bone samples can be provided by narrower bracketing of the anticipated distribution of GL. With the use of the glasses X = 0.02 and X = 0.10 to relate the 256 GLs over a smaller range of atomic numbers from Z = 10.4 to 15.6, improved GL resolution is achieved for more atomically uniform sample sets. Additionally, one could create virtually any glass composition with an associated value of Z to target the expected range of Z-values produced by a particular set of samples.
Raw GL histograms of the five glass reference materials and those from cow bone and rabbit enamel. The BSE image (top, scale bar 200 μm) shows that the glasses generally increase in GL with increasing X values. Glass references with X = 0 and X = 0.15 were selected for this study because they encompass the pertinent range of GLs.

B. WMGL references calibration
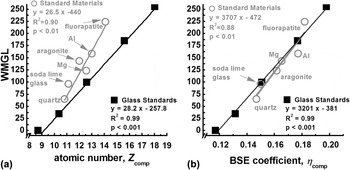
The measured values of WMGL were significantly correlated (P-value of P < 0.05) with linear regression of both Z comp and η for calibration materials and glass reference materials (Fig. 2). However, the linear fit of WMGL to Z comp of the calibration materials and the glasses did not correspond and instead displayed two distinctive trends [Fig. 2(a)]. For composite materials, especially those containing elements of low atomic number, the relationship of WMGL to Z comp has been shown to deviate from expected values of materials containing only one element.Reference Howell, Davy and Boyde17 Because the glass reference materials contain 15–25 wt% Li2O, the lack of correlation of WMGL to Z comp is not surprising. Mineralized tissues contain a high concentration of low atomic number constituents. Thus, while common practice,Reference Roschger, Fratzl, Eschberger and Klaushofer4, Reference Tjhia, Odvina, Rao, Stover, Wang and Fyhrie9–Reference Fratzl-Zelman, Morello, Lee, Rauch, Glorieux, Misof, Klaushofer and Roschger12, Reference Tesch, Eidelman, Roschger, Goldenberg, Klaushofer and Fratzl39 calculations of mineral content by an assumed linear correlation of WMGL to Z comp should be performed with caution.
WMGL of calibration materials and glass references versus (a) mean atomic number Z and (b) qBSE coefficient ηcomp. Calculations for Z comp of composite materials with low atomic number elements do not correctly predict backscattered behavior, as seen in (a). However, calculations for ηcomp do correctly relate to backscattered behavior (i.e., WMGL) as seen in (b).

Because WMGL is proportional to the fractional number of BSEs, a linear relationship between WMGL and η is expected. For both glass references and calibration materials, similar linear fits represent the correlation of WMGL to ηcomp [Fig. 2(b)]. These corresponding lines indicate that η can be used to describe the backscatter behavior of both pure elements and composite materials.
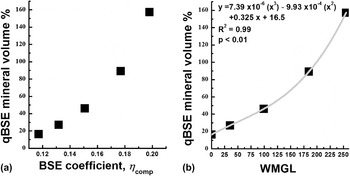
For each glass reference with a known value of ηcomp (see Table I), an equivalent value of MV% was calculated from the assumed values of ηHA and ηOM (see Sec. II. E). The relationship of ηcomp to MV% is shown in Fig. 3(a). With a polynomial fit of the WMGL for the glasses and their equivalent value of MV%, the calibration curve for mineralized tissues was determined [Fig. 3(b)]. The glasses encompass the range of theoretical equivalent MV% from 17% to 157% allowing a quantification of extremely broad range of mineralized tissues. Quantification of very poorly mineralized tissues (with MV% < 17%), while rarely encountered, would require the development of a new standard with a very low ηcomp.
(a) Relationship of ηcomp to calculated MV%. (b) Calibration curve for conversion of WMGL values to mineral volume percent, MV%.

C. qBSE images of mineralized tissues
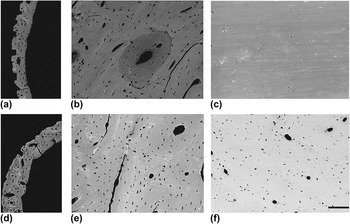
qBSE images of the mineralized tissues in this study displayed both local and intersample variations in mineral content (Fig. 4). The most highly mineralized sample, whale bulla [Fig. 4(f)], appears distinctly brighter (e.g., higher values of WMGL) than samples with lower mineral content such as the 2-wk-old mouse femur [Fig. 4(a)]. Additionally, local variations within each sample are evident, as in the case of the lamb femur [Fig. 4(b)], where more highly mineralized interstitial bone has a distinctly higher WMGL than the newly formed poorly mineralized osteonal bone. Interstitial bone, as the remnant of old lamellar structures or woven bone, mineralizes with time and is eventually replaced by the deposition of new osteons, which are comparatively less mineralized.
Calibrated qBSE images of representative samples displaying variation of mineral content both within and between samples: (a) 2-wk-old mouse femur, (b) young lamb femur, (c) carp dermal bone, (d) 20-wk-old mouse femur, (e) cow femur, and (f) whale bulla. Increasing mineral content from (a) to (f) is evident with a general increase in WMGL. All images were taken at 500x (scale bar = 100 μm), at 20 kV acceleration voltage, and a 15-mm working distance.

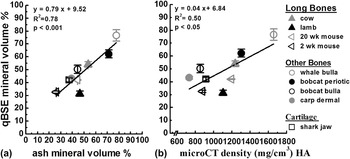
The mean value of MV% for each sample significantly correlated with both microCT density (P < 0.05, R 2 = 0.50) and ash MV% (P < 0.001, R 2 = 0.78) (Fig. 5). These correlations justify measurements of MV% with qBSE and our glass reference materials. Deviations from R 2 = 1 of qBSE MV% to bulk MV% are likely the results of measurement error, length scale effects, and compositional variations. The drastically different length scales investigated by the bulk techniques of microCT and ashing, compared to the submicrometer length scale provided by qBSE imaging, can lead to differences in measured MV%. The volume of material probed with qBSE has been calculated to be about 20 μm3 for bone taken with 20 kV accelerating voltage. Alternatively, microCT and ash MV% measured values from an average volume of 3 mm3 in this study. The mineral compositional heterogeneity evident at the micrometer length scale in qBSE images is averaged together by the bulk measurement techniques of microCT and ashing. Further, our analysis assumes only a fixed chemical formula for HA, yet HA composition has been shown to vary in mineralized tissues with age, location, species, and type of tissue.Reference Elliott, Kohn, Rakovan and Hughes35
Mineral volume percent of the mineralized tissues measured by qBSE correlated to (a) ash mineral volume percent and (b) microCT density.

D. Nanoindentation of mineralized tissues
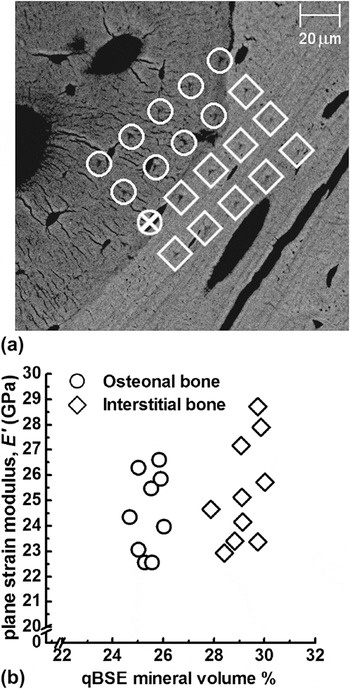
Nanoindentation plane strain modulus E′ of the mineralized tissues examined ranged from E′ = (15.5 ± 1.0) GPa for carp dermal bone to E′ = (74.7 ± 3.2) GPa for whale bulla. Location-matched measurements of MV% and E′ provide insight into the relationship of mineral content to mechanical properties at the tissue scale.Reference Oyen, Ferguson, Bembey, Bushby and Boyde21 This unique strength of qBSE imaging is demonstrated on the lamb femur in Fig. 6. Indentation sites were grouped as falling on either osteonal or interstitial bone. Newly formed osteonal bone had lower values of both MV% = (25.8 ± 0.5)% and indentation modulus E′ = (24.5 ± 1.6) GPa, compared to the older osteonal bone with MV% = (29.6 ± 0.7)% and E′ = (25.3 ± 2.0) GPa. Increased mineralization of the interstitial bone has been previously correlated to higher modulus as compared to osteonal bone.Reference Rho, Roy, Tsui and Pharr40, Reference Gupta, Stachewicz, Wagermaier, Roschger, Wagner and Fratzl41 In particular, our results corroborate Gupta et al.,Reference Gupta, Stachewicz, Wagermaier, Roschger, Wagner and Fratzl41 who demonstrated a higher MV% ≈ 44% in interstitial bone as compared to that of osteonal bone MV% ≈ 36%.
Location-matched measurements of nanoindentation tests and qBSE MV% on young lamb femur. (a) qBSE image showing an indentation array of 5 × 4 indents with 20 μm spacing between test sites. Test sites are categorized as interstitial bone (circles) or osteonal bone (diamonds). The test site with a X though the circle was removed from analysis because the indenter tip landed on an osteocyte lacuna. (b) Corresponding nanoindentation modulus for each test site versus MV% analyzed within the area surrounding each test site.

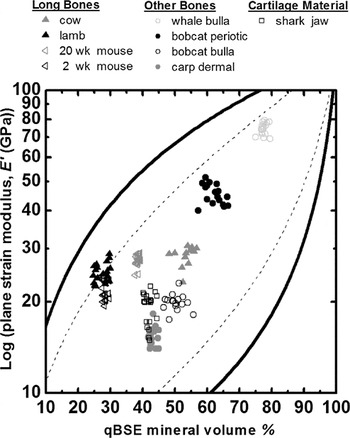
Increased modulus values with MV% were observed across the range of mineralized tissues (Fig. 7). This general correlation of mineral content to mechanical properties has been previously observed at multiple length scalesReference Oyen, Ferguson, Bembey, Bushby and Boyde21, Reference Currey42; however, the correlation is not exact as the mechanical response at a single value of MV% can be highly variable.Reference Oyen, Ferguson, Bembey, Bushby and Boyde21 This inherent variability indicates that other factors such as heterogeneities in mineral or organic composition, mineral crystallinity, porosity, and structural connectivity must contribute to the nanomechanical response.
The log of plane strain modulus E′ versus mineral volume fraction MV% of all mineralized tissue samples for each indentation site. The solid lines are Voigt–Reuss bounds, and the dashed lines are the Hashin–Shtrikman composite bounds.

Further insight into the source of this variability is possible by considering mineralized tissues as two-phase composites of organic and mineral phases that combine to produce the mechanical response.Reference Oyen, Ferguson, Bembey, Bushby and Boyde21, Reference Currey42, Reference Katz43 In traditional composites theory, these two phases can be combined as discrete particles in a matrix (Hashi–Shtrikman)Reference Hashin and Shtrickman44 or as stiff fiber composites (Voigt–Reuss).Reference Herakovich45 In Fig. 7, all data for mineralized tissues fall within the particle composites lines, as previously observed.Reference Oyen, Ferguson, Bembey, Bushby and Boyde21, Reference Katz43 At a specific value of MV%, the connectivity of mineral and organic phases determines where modulus values fall within the composite bounds. A more highly connected mineral phase will fall near the top of the composite range, while a less connected mineral phase as stiff particles in a soft matrix would fall near the bottom of the range. In the current study, shark cartilage, carp dermal bone, and bobcat bulla were all near the lower composite bound, suggesting less connected mineral phase. Further, these collected data span nearly the entire range from the lower to the upper Hashi–Shtrikman bounds indicating that no single relationship exists between composition and modulus.
IV. CONCLUSIONS
We have developed tunable amorphous reference materials that are easy to produce and overcome the limitations of the more commonly used metallic reference materials. The glasses encompass a large range of MV% from 17% to 157%, allowing quantification of mineral in a wide variety of mineralized tissue. Further, these reference materials can be applied to quantify composition in other materials that contain variations in atomic density. The adjustable composition of these references allows for selection of a narrower range of MV% for study of more uniform tissue to increase resolution. Measurements of MV% with qBSE were validated by statistically significant correlation to measurements of microCT density and ash MV%. Overall, tunable glass reference materials are cost-effective, easily reproduced, and increase the availability of the qBSE imaging technique.
ACKNOWLEDGMENTS
We thank Prof. Ted Bateman and Eric Livingston (Department of Bioengineering, Clemson University) for collection of microCT data and Alicia Ortega (Department of Mechanical Engineering, University of Colorado) for collection of DSC data. Commercial equipment, instruments, or materials are identified only to adequately specify certain procedures. In no case does such identification implies recommendation or endorsement by the National Institute of Standards and Technology, nor does it implies that the products identified are necessarily the best available for the purpose. Publication of NIST, an agency of the U.S. government, not subject to copyright in the United States.