Endocannabinoids (ECs), such as 2-arachidonoyl glycerol (2-AG) and anandamide (AEA), play a crucial role in regulating energy balance by modulating food intake and energy expenditure through the activation of cannabinoid receptor 1 (CB1) in central and peripheral systems. The intestinal EC system is involved in regulating hunger and lipid preference(Reference DiPatrizio, Igarashi and Narayanaswami1,Reference DiPatrizio, Astarita and Schwartz2) . Studies have shown that EC levels are elevated in the intestines of healthy rodents upon food deprivation, whereas refeeding or duodenal nutrient infusion can reduce these levels to those observed in free-feeding conditions(Reference DiPatrizio, Igarashi and Narayanaswami1,Reference Izzo, Piscitelli and Capasso3,Reference Fu, Astarita and Gaetani4) . Blocking the CB1 receptor has been shown to reduce food intake during refeeding in rodents, suggesting that intestinal CB1 receptor activation is involved in the sensation of hunger(Reference DiPatrizio, Igarashi and Narayanaswami1). Furthermore, stimulating the intestinal EC system in hungry rodents requires efferent vagal activation of muscarinic acetylcholine receptors in the intestine(Reference DiPatrizio, Igarashi and Narayanaswami1,Reference Pradhan and Roth5) . Therefore, the peripheral EC system is constantly regulated by the vagal nervous system, which adapts to the gut’s nutritional status to maintain energy homoeostasis.
There is mounting evidence supporting the involvement of the EC system in obesity and related metabolic disorders. In particular, elevated levels of circulating ECs have been observed in both obese humans and animal models(Reference Monteleone, Matias and Martiadis6–Reference Di Marzo9). Previous studies have indicated dysregulation of gut ECs in high-fat diet (HFD)-induced or genetically obese rodents(Reference Izzo, Piscitelli and Capasso3,Reference Avalos, Argueta and Perez10–Reference Suriano, Manca and Flamand12) . Pharmacological blockage of peripheral CB1 receptors has been shown to reduce food intake and eating rate in HFD-induced obese models(Reference Argueta and DiPatrizio11,Reference Argueta, Perez and Makriyannis13) . Intestinal epithelium-specific CB1 receptor-knockout (KO) mice did not exhibit a preference for HFD(Reference Avalos, Argueta and Perez10). On the other hand, in genetically obese mouse models such as ob/ob or db/db mice, pharmacological blockade of peripheral CB1 receptors with JD 5037 did not affect food intake or body weight under standard diet conditions(Reference Tam, Cinar and Liu14). Accordingly, dysregulation of intestinal EC synthesis appears to be linked to hyperphagia in the obese mice caused by dietary or genetic factors, but the effectiveness of blocking peripheral CB1 receptor in attenuating hyperphagic behaviour in obese rodents remains unclear.
An obese mouse model, KK-A y , was established by crossing diabetic KK mice, a polygenic mouse model of non-insulin-dependent diabetes, with obese A y mice carrying a heterozygous mutation of the agouti gene (Ay)(Reference Suto, Matsuura and Imamura15,Reference Reddi and Camerini-Davalos16) . In A y mice, the intact agouti-signalling protein (ASP), homologous to agouti-related protein (AGRP), is ubiquitously overexpressed under the control of the Raly promoter and acts as an antagonist of melanocortin receptors (MCR), except for MCR3, resulting in obesity phenotypes such as hyperphagia(Reference Adan, Tiesjema and Hillebrand17–Reference Michaud, Bultman and Klebig21). Therefore, KK-A y mice develop the onset of obesity phenotypes and diabetic pathology earlier and more severe than KK or A y mice. Although obesity and hyperphagia are observed in KK-A y , KK, and A y mice, no study to date has investigated the dysregulation of the intestinal EC system, which has been elucidated in other mouse models of obesity.
Therefore, in this study, we investigated changes in intestinal arachidonic acid (AA) metabolites, including ECs, and meal behaviour in KK-A y mice, an obesity model, to enhance our understanding of the relationship between the intestinal EC system and hyperphagic responses in obesity.
Materials and methods
Animals
KK-A y and BALB/c mice (male, 8 weeks old) were obtained from Japan SLC Inc. The mice were acclimatized to the animal facility and individually housed and fed CLEA Rodent Diet CE-2 (CLEA Japan, Inc.). Mice were acclimatized for 2 weeks and used in experiments at the age of 10–12 weeks. Housing conditions were maintained at 20°C–25°C, 40 %–60 % humidity and a 12/12 h light–dark cycle. Animal experiments were conducted following the guidelines of the Committee on the Ethics of Animal Experiments of Saitama Medical University and the Tokyo University of Agriculture and Technology, with approval from the Animal Research Ethics Subcommittees (Saitama Medical University permit number 4077; Tokyo University of Agriculture and Technology permit number 28–87).
Experimental design
As shown in Figure 1, four experiments were performed in the present study.
Schematic diagram of the experimental design. (a) Experiment 1: Food intake was assessed in mice under free-feeding conditions. (b) Experiment 2: Meal pattern was analysed in mice using a feeding measurement system. (c) Experiment 3: Effects of five drugs (AM6545, KT109, LEI-401, ibuprofen and acetaminophen) and oleoyl ethanolamide (OEA, a satiety inducer) on food intake and latency in mice were investigated. (d) Experiment 4: Mice were euthanised, and samples were collected for biochemical and molecular biological analyses. Lipid measurements were performed in the jejunum and plasma of mice, and mRNA expression levels of related genes were analysed in the jejunum of mice.

Experiment 1. Food intake measurement
Food intake was assessed through manual weighing of food before and after feeding periods in various experiments. To evaluate food intake under ad libitum conditions, fresh pellets were provided at 20.00, and the remaining food weight was measured after 24 h. For food intake assessment under refeeding conditions, mice were food-deprived for 24 h (10.00–10.00) and then given access to food for 5 h (10.00–15.00).
Experiment 2. Meal pattern analysis
The meal pattern was investigated in mice following 24 h of food deprivation and subsequent refeeding. Feeding activities were recorded using a feeding measurement system MFI-01 equipped with an FIC-001 sensor (Muromachi Kikai Co., Ltd). The system monitored both access to the food container and the weight of the food in the container. Data were collected every 5 min using the system with the CompACT AMS software. Each test session was videotaped to verify the exact time of access to the food container by the mice. The mice were acclimatised to the system and food containers for at least 3 d before the session. Meal pattern analysis was conducted as described in previous studies with some modifications(Reference Igarashi, Hayakawa and Tanabe22–Reference Gaetani, Oveisi and Piomelli25): meal latency (minutes), the time from the onset to the first eating episode; meal duration (minutes), the time from the start to the finish of the meal; meal interval (minutes), the interval time between meals; frequency (times/session), the number of meals in the session period; and meal size (g/mouse), the amount of food consumed during the meal. The minimum meal intervals and meal durations were set at 5 and 1 min, respectively, and a meal was defined as a feeding period that included a bout.
Experiment 3. Effects of drugs and oleoyl ethanolamide on food intake
To study the impact of drugs on food intake and latency, mice underwent a 24-h food deprivation period (10.00–10.00) followed by intraperitoneal drug administration. Twenty minutes later, the mice were exposed to the food, and latency to feeding was measured, with food intake quantified at 3 h. The study involved treatment with five drugs: AM6545 (peripheral cannabinoid CB1 receptor antagonist, 10 mg/kg in 0·5 ml/kg dimethyl sulfoxide (DMSO); Sigma-Aldrich), KT109 (selective inhibitor of diacylglycerol lipase-β, 30 mg/kg in 0·5 ml/kg DMSO; Sigma-Aldrich), LEI-401 (N-acylphosphatidylethanolamine phospholipase D inhibitor, 30 mg/kg in 0·5 ml/kg DMSO; Sigma-Aldrich), ibuprofen (cyclo-oxygenase (COX) inhibitor, 30 mg/kg in 0·5 ml/kg DMSO; Tokyo Chemical Industry), acetaminophen (COX inhibitor, 30 mg/kg in 0·5 ml/kg DMSO; Tokyo Chemical Industry) and oleoyl ethanolamide (OEA, satiety inducer, 20 mg/kg in 0·5 ml/kg DMSO; Cayman).
Experiment 4. Biochemical and molecular biological analyses
Biochemical and molecular biological analyses were performed using jejunum and plasma samples collected at the age of 12 weeks. For sample collection, the mice were fasted for 5 h, and blood glucose levels were measured using a portable glucometer with compatible glucose test strips (OneTouch® Ultra®; LifeScan). Next, the mice were anaesthetised with isoflurane (Pfizer), and blood samples were collected from the inferior vena cava using heparinised tubes (heparin sodium, Mochida Pharmaceutical Co., Ltd). Plasma was separated by centrifugation (7000 g for 5 min at 4°C), and tissues were harvested, weighed and stored at –80°C.
LC–MS/MS analysis of the arachidonic acid metabolites
Intestinal AA metabolites were quantified using an LC–MS/MS system, following a previously described method with some modifications(Reference Hijioka, Futokoro and Ohto-Nakanishi26,Reference Nakagawa-Yagi, Hara and Ohto27) . Briefly, lipids were extracted from 90 mg frozen jejunum samples with internal standards (2 ng each of PGE2-d4, PGF2α -EA-d4, AEA-d8, 18:1-d8 MG, and 20 ng of AA-d8; Cayman Chemicals). The lipid fraction containing the AA metabolites was semipurified using solid-phase extraction with Oasis HLB columns (Waters Corporation). The AA metabolites were separated using a high-performance LC system (Nexera LC-30AD, Shimadzu Corporation) equipped with an XBridge C18 column (particle size 3·5 µm, length 150 mm, inner diameter 1·0 mm; Waters) and analysed on a triple quadrupole mass spectrometer (LCMS-8040; Shimadzu). The electrospray ionisation interface was set in the negative ionisation mode for most metabolites, except for monoacylglycerol, which was analysed in the positive ionisation mode. AA metabolites were identified based on retention time and quantified using calibration curves for each compound. The extraction recoveries were monitored using deuterated internal standards. Data were analysed using LabSolutions software (Shimadzu Corporation).
mRNA extraction and quantitative PCR analysis
Total RNA was extracted from the jejunum using the RNAiso Plus reagent (Takara Bio Inc.) and purified with the NucleoSpin® RNA Plus kit (MACHEREY-NAGEL GmbH & Co. KG). The extracted RNA was reverse transcribed to first-strand complementary DNA using the ReverTra Ace® quantitative PCR (qPCR) RT Master Mix (TOYOBO CO., LTD). qPCR was performed using the Mx3000p qPCR system (Agilent Technologies) with the SYBR® Premix Ex Taq™ II (Takara). The primer sequences are listed in online Supplementary Table 1. Gene expression was analysed using the comparative cycle threshold method, with mRNA levels of target genes normalised to 18S rRNA as the housekeeping gene.
Other analyses
Plasma triacylglycerol, total cholesterol and plasma non-esterified fatty acid (NEFA) levels were determined using the LabAssay™ Triglyceride Kit (Wako), LabAssay™ Cholesterol Kit (Wako) and LabAssayTM NEFA (Wako), respectively.
Statistical analysis
All measured values were expressed as means and standard errors of the means. Statistical analysis was conducted using GraphPad Prism version 7.04 (GraphPad Software Inc.). Statistical significance was assessed using unpaired Student’s t tests, Mann–Whitney test, one-way ANOVA and two-way ANOVA. Post hoc analyses were conducted using Dunnett’s or Bonferroni’s multiple comparison test to compare means in case of significant differences. Differences between groups were considered statistically significant when P-values were less than 0·05.
Results
Physiological parameters of KK-A y mice
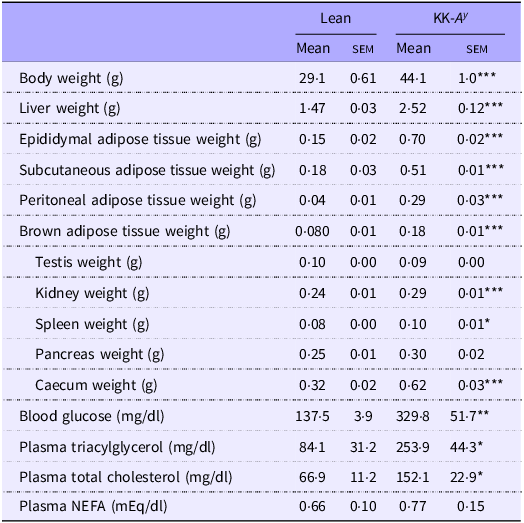
At 12 weeks, KK-A y mice exhibited higher body weight than lean mice (Table 1). The tissue weight of the liver, adipose tissue (epididymal, subcutaneous, peritoneal and brown adipose tissues), kidney, spleen and caecum was significantly higher in KK-A y mice than in lean mice, while the testis and pancreas weights were not different. Blood glucose, plasma triacylglycerol and plasma total cholesterol levels were elevated in the KK-A y group, but plasma NEFA did not differ between the lean and KK-A y groups.
Body and tissue weights and blood biochemistry in KK-A y and lean mice at 12 weeks

Table 1 Long description
A table comparing body and tissue weights and blood biochemistry in lean and KK-Ay mice at 12 weeks. The table has 13 rows and 5 columns. The columns are labeled Lean Mean, Lean SEM, KK-Ay Mean, and KK-Ay SEM. The rows are labeled with different measurements: Body weight (g), Liver weight (g), Epididymal adipose tissue weight (g), Subcutaneous adipose tissue weight (g), Peritoneal adipose tissue weight (g), Brown adipose tissue weight (g), Testis weight (g), Kidney weight (g), Spleen weight (g), Pancreas weight (g), Caecum weight (g), Blood glucose (mg/dl), Plasma triacylglycerol (mg/dl), Plasma total cholesterol (mg/dl), and Plasma NEFA (mEq/dl). Each row provides the mean and standard error of the mean (SEM) for each measurement in both lean and KK-Ay mice. Notable trends include higher body weight, liver weight, adipose tissue weights, kidney weight, spleen weight, and caecum weight in KK-Ay mice compared to lean mice. Blood glucose, plasma triacylglycerol, and plasma total cholesterol levels are also elevated in KK-Ay mice, while plasma NEFA levels do not differ significantly between the two groups.
NEFA, non-esterified fatty acid.
Values are expressed as mean and standard error of the mean. n 3–4.
*P < 0·05, **P < 0·01, ***P < 0·001.
mRNA expression of agouti-signalling protein, agouti-related protein and melanocortin receptors
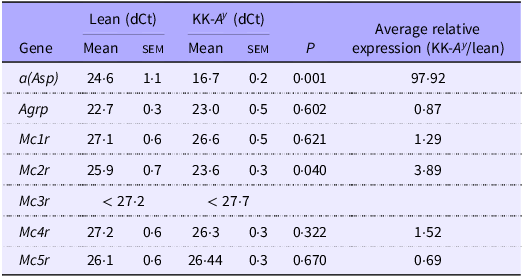
We analysed the mRNA expression of ASP, AGRP and MCRs in the mice intestine. Asp expression was confirmed in the mice intestine, and it was 98 times higher than that in lean mice (Table 2). Intestinal Agrp expression showed no significant difference between lean and KK-A y mice (Table 2). Mc2r expression level was 3·9 times higher in KK-A y mice than in lean mice. Mc1r, Mc4r and Mc5r expression levels remained unchanged between lean and KK-A y mice, with Mc3r being minimally detected in the intestine of both groups. These findings suggest that intestinal function may be locally affected by ASP in KK-A y mice.
mRNA expression levels of ASP, AGRP and melanocortin receptors in the intestine of lean and KK-A y mice

Table 2 Long description
A table comparing mRNA expression levels of ASP, AGRP, and melanocortin receptors in the intestines of lean and KK-Ay mice. The table has 7 rows and 6 columns. The columns are labeled as follows: Gene, Lean (dCt) Mean, Lean (dCt) SEM, KK-Ay (dCt) Mean, KK-Ay (dCt) SEM, P, and Average relative expression (KK-Ay/lean). The rows are labeled with the following genes: a(Asp), Agrp, Mc1r, Mc2r, Mc3r, Mc4r, and Mc5r. Row 1: a(Asp), Lean (dCt) Mean 24.6, Lean (dCt) SEM 1.1, KK-Ay (dCt) Mean 16.7, KK-Ay (dCt) SEM 0.2, P 0.001, Average relative expression (KK-Ay/lean) 97.92. Row 2: Agrp, Lean (dCt) Mean 22.7, Lean (dCt) SEM 0.3, KK-Ay (dCt) Mean 23.0, KK-Ay (dCt) SEM 0.5, P 0.602, Average relative expression (KK-Ay/lean) 0.87. Row 3: Mc1r, Lean (dCt) Mean 27.1, Lean (dCt) SEM 0.6, KK-Ay (dCt) Mean 26.6, KK-Ay (dCt) SEM 0.5, P 0.621, Average relative expression (KK-Ay/lean) 1.29. Row 4: Mc2r, Lean (dCt) Mean 25.9, Lean (dCt) SEM 0.7, KK-Ay (dCt) Mean 23.6, KK-Ay (dCt) SEM 0.3, P 0.040, Average relative expression (KK-Ay/lean) 3.89. Row 5: Mc3r, Lean (dCt) Mean less than 27.2, Lean (dCt) SEM not applicable, KK-Ay (dCt) Mean less than 27.7, KK-Ay (dCt) SEM not applicable, P not applicable, Average relative expression (KK-Ay/lean) not applicable. Row 6: Mc4r, Lean (dCt) Mean 27.2, Lean (dCt) SEM 0.6, KK-Ay (dCt) Mean 26.3, KK-Ay (dCt) SEM 0.3, P 0.322, Average relative expression (KK-Ay/lean) 1.52. Row 7: Mc5r, Lean (dCt) Mean 26.1, Lean (dCt) SEM 0.6, KK-Ay (dCt) Mean 26.44, KK-Ay (dCt) SEM 0.3, P 0.670, Average relative expression (KK-Ay/lean) 0.69.
ASP, agouti-signalling protein; AGRP, agouti-related protein.
Values are expressed as mean and standard error of the mean. n 3–4.
Arachidonic acid metabolites and related gene expression in the gut of KK-A y mice
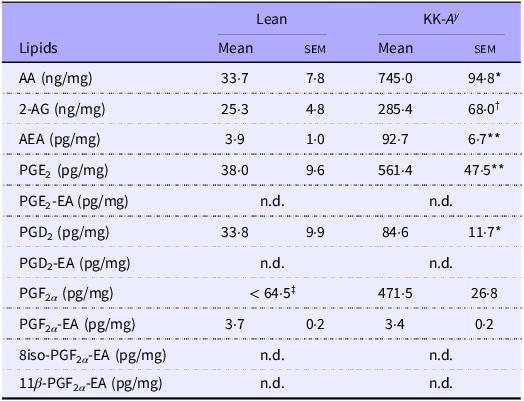
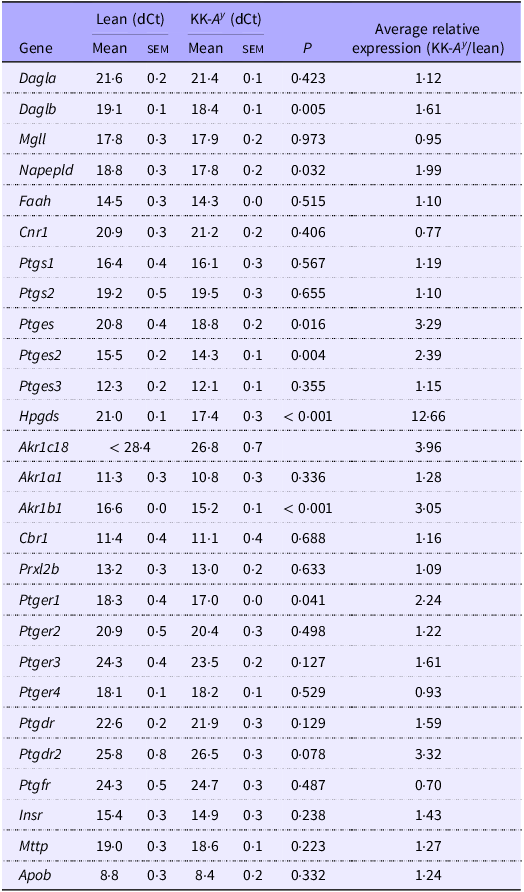
The primary question of this study was to determine whether the levels of intestinal ECs were increased in KK-A y mice, similar to that reported in other rodent models of obesity. Analytical results revealed that 2-AG and AEA levels were elevated in the intestines of KK-A y mice compared with lean mice (Table 3). The increase in ECs was associated with elevated expression of Daglab and Napepld in the intestine of KK-A y mice (Table 4). In addition, free AA levels were increased in the gut of KK-A y mice, whereas the expression of Mgll and Faah remained unchanged between lean and KK-A y mice. These results indicate that EC elevation in KK-A y mice occurs through up-regulation of EC synthesis rather than inhibition of degradation. Furthermore, PGs and their ethanolamides were analysed in the gut of KK-A y mice due to AA elevation. PGE2, PGD2 and PGF2α levels were much higher in KK-A y mice than in lean mice (Table 3). In addition, the expression of related genes such as Ptges (PGE synthase), Ptges2 (PGE synthase 2), Hqgds, Akr1c18 and Akr1b1, but not Ptgs2, increased in the intestine of KK-A y mice. Among the five prostamides measured in this study, PGF2α -EA was detectable under our analytical conditions, with no significant change between lean and KK-A y mice. Overall, the synthesis of ECs and PGs is enhanced in the intestine of KK-A y mice, potentially contributing to their hyperphagic behaviour.
Levels of arachidonic acid metabolites in the intestine of KK-A y and lean mice

Table 3 Long description
A table comparing lipid levels in lean and KK-Ay mice. The table has 10 rows and 5 columns. The columns are labeled Lipids, Lean Mean, Lean SEM, KK-Ay Mean, and KK-Ay SEM. The row labels include various lipids such as AA, 2-AG, AEA, PGE2, and others. Each row provides the mean and standard error of the mean (SEM) for lean and KK-Ay mice. For example, the first row shows AA levels with a mean of 33.7 ng/mg and SEM of 7.8 for lean mice, and a mean of 745.0 ng/mg and SEM of 94.8 for KK-Ay mice. The table highlights significant differences in lipid levels between lean and KK-Ay mice, with notable increases in several lipids in KK-Ay mice.
2-AG, 2-arachidonoyl glycerol; AA, arachidonic acid; AEA, anandamide; n.d., not detected (below the limit of detection).
Values are expressed as mean and standard error of the mean. n 3.
*P < 0·05, **P < 0·01.
† P = 0·0614.
‡Average of two samples.
mRNA expression levels of arachidonic acid metabolism-related genes in the intestine of KK-A y and lean mice

Table 4 Long description
A table comparing mRNA expression levels of genes related to arachidonic acid metabolism in the intestine of KK-Ay and lean mice. The table has 30 rows and 7 columns. The columns are labeled as follows: Gene, Lean (dCt) Mean, Lean (dCt) SEM, KK-Ay (dCt) Mean, KK-Ay (dCt) SEM, P, and Average relative expression (KK-Ay/lean). The rows list various genes and their corresponding values for each column. For example, the first row shows: Gene: Dagla, Lean (dCt) Mean: 21.6, Lean (dCt) SEM: 0.2, KK-Ay (dCt) Mean: 21.4, KK-Ay (dCt) SEM: 0.1, P: 0.423, Average relative expression (KK-Ay/lean): 1.12. The table provides a detailed comparison of gene expression levels between KK-Ay and lean mice, highlighting differences and similarities in their intestinal mRNA expression profiles.
Values are expressed as mean and standard error of the mean. n 3–4 for lean mice, n 3 for KK-A y mice.
Food intake and meal pattern in the KK-A y mice
KK-A y mice consumed more food than lean mice in free-feeding and refeeding conditions (Figure 2). In addition, food intake was found to be two times higher in KK-A y mice than in lean mice under refeeding conditions following 24 h of food deprivation (Figure 2(b)).
Food intake in lean and KK-A y mice. (a) Daily food intake (g/24 h/mouse) was measured in lean or KK-A y mice under free-feeding conditions (n 11 for lean mice; n 10 for KK-A y mice). (b) Food intake (g/5 h/mouse) was measured in lean or KK-A y mice under refeeding conditions after 24 h of food deprivation (n 6 for lean mice; n 5 for KK-A y mice). Data are expressed as mean and standard error of the mean. *P < 0·05; **P < 0·01 compared with the lean group.

Meal patterns were analysed in KK-A y and lean mice under refeeding conditions using a feeding measurement system (Figure 3). Consistent with the manual food intake measurements in Figure 2(b) (5-h refeeding), food intake measured using the system was significantly higher at 3 h and 4 h in KK-A y mice compared with lean mice (Figure 3(a)). The increased food consumption in KK-A y mice was attributed to a rise in meal frequency (Figure 3(c)) rather than a change in meal size (Figure 3(f) and (j)). Furthermore, the first, average and total meal durations were shorter in KK-A y mice than in lean mice (Figure 3(d), (e) and (i)), resulting in increased eating rates (Figure 3(g) and (k)). There was no difference in the meal interval between KK-A y and control mice (Figure 3(h) and (l)). These findings suggest that the regulation of hunger control rather than satiation or satiety may be dysregulated in KK-A y mice.
KK-A y mice exhibited increased food intake and meal frequency for subsequent meals under refeeding conditions. After 24 h of food deprivation, lean or KK-A y mice were individually placed in a cage with food in the feeding behaviour analysis system, and their behaviour was recorded for up to 5 h. The following feeding parameters were analysed in the first 3 h: (a) cumulative food intake, (b) latency, (c) meal frequency, (d) total meal duration, (e) first meal duration, (f) first meal size, (g) first eating rate, (h) first meal interval, (i) average meal duration, (j) average meal size, (k) average eating rate and (l) average meal interval. Data are expressed as mean and standard error of the mean (n 6 for lean mice; n 4 for KK-A y mice). *P < 0·05, **P < 0·01 and ***P < 0·001 compared with the lean group.

Effects of pharmacological blockade of the intestinal endocannabinoid system on food intake
We investigated the effects of the pharmacological blockade of the EC system on food intake and latency in KK-A y mice (Figure 4). Peripheral CB1 receptor blockade with AM6545 reduced food intake in KK-A y and lean mice (Figure 4(a) and (b)), suggesting that increased EC levels were associated with hyperphagia in KK-A y mice. The blockage of the peripheral CB1 receptor did not influence latency in either the lean or the KK-A y mice (Figure 4(c) and (d)). Next, we utilised KT109 (a diacylglycerol lipase-β inhibitor) and LEI-401 (an N-acylphosphatidylethanolamine phospholipase D inhibitor) to identify EC involved in the activation of the CB1 receptor in these mice (Figure 4). KT109, but not LEI-401, reduced food intake in both KK-A y and lean mice, suggesting that 2-AG activated the peripheral CB1 receptor to induce hunger in this condition. KT109 increased latency in lean mice only (Figure 4(c)), whereas AM6545, KT109 and LEI-401 had no effect on latency in KK-A y mice (Figure 4(d)).
2-Arachidonoyl glycerol and cannabinoid receptor 1 control food intake in lean and KK-A y mice. Mice were intraperitoneally treated with AM6545, KT109, LEI-401 or dimethyl sulfoxide (DMSO) as a control after 24 h of food deprivation and then exposed to food for 3 h after 20 min of treatment. Food intake for 3 h ((a) and (d)) and latency ((c) and (d)) were measured in lean ((a) and (c)) or KK-A y ((b) and (d)) mice. AM6545, 10 mg/kg in 0·5 ml/kg DMSO; KT109, 30 mg/kg in 0·5 ml/kg DMSO; LEI-401, 30 mg/kg in 0·5 ml/kg DMSO; DMSO, 0·5 ml/kg DMSO. Data are expressed as mean and standard error of the mean (n 5). **P < 0·01 compared with the DMSO-treated group.

Effects of cyclo-oxygenase inhibitors on food intake
Lipidomics analysis revealed an increase in several PGs, such as PGE2, PGD2 and PGF2α , which are COX-derived AA metabolites, in KK-A y mice (Table 3). Furthermore, the gene expression analysis revealed that the mRNA expression of Ptges, Ptges2 and Ptger1 (PGE receptor 1) was increased in KK-A y mice (Table 4). To investigate the impact of COX inhibitors on food intake and latency, we treated mice with ibuprofen (a COX inhibitor, one of the non-steroidal anti-inflammatory drugs) and acetaminophen (a COX-2 inhibitor at high doses) (Figure 5). Both drugs reduced food intake in lean and KK-A y mice (Figure 5(a) and (b)). Additionally, latency was increased in lean mice treated with either drug, while no significant effect was observed in KK-A y mice (Figure 5(c) and (d)).
Effects of cyclo-oxygenase inhibitors on food intake and latency in mice. Mice were intraperitoneally treated with ibuprofen, acetaminophen and dimethyl sulfoxide (DMSO) as a control after 24 h of food deprivation and exposed to food for 3 h after 20 min of treatment. Food intake for 3 h ((a) and (d)) and latency ((c) and (d)) were measured in lean ((a) and (c)) or KK-A y ((b) and (d)) mice. Ibuprofen, 30 mg/kg in 0·5 ml/kg DMSO; acetaminophen, 30 mg/kg in 0·5 ml/kg DMSO; DMSO, 0·5 ml/kg DMSO. Data are expressed as mean and standard error of the mean (n 5). *P < 0·05; **P < 0·01 compared with the DMSO-treated group.

Effects of oleoyl ethanolamide on food intake
In this study, we investigated the effects of OEA, a satiety factor, on food intake in KK-Ay mice. Our results indicated that intraperitoneal administration of OEA (10 mg/kg) led to a significant reduction in food intake in KK-A y and lean mice compared with the vehicle control (Figure 6(a) and (b)). In addition, there were no significant effects of OEA on latency in the lean and KK-A y mice (figure 6(c) and (d)).
Effects of oleoyl ethanolamide (OEA) on food intake and latency in mice. Mice were intraperitoneally treated with OEA and dimethyl sulfoxide (DMSO) as a control after 24 h of food deprivation and exposed to food for 3 h after 20 min of treatment. Food intake for 3 h ((a) and (d)) and latency ((c) and (d)) were measured in lean ((a) and (c)) or KK-A y ((b) and (d)) mice. OEA, 20 mg/kg in 0·5 ml/kg DMSO; DMSO, 0·5 ml/kg DMSO. Data are expressed as mean and standard error of the mean (n 5). **P < 0·01; ***P < 0·001 compared with the DMSO-treated group.

Discussion
The present study found that KK-A y mice, a model of obesity and diabetes(Reference Yagihashi28,Reference Wang, Sun and Sun29) , consumed more food compared with lean mice and exhibited increased meal frequency without changes in meal size or interval. In addition, dysregulation of intestinal EC and PG production was observed in KK-A y mice. Pharmacological blockage of the CB1 receptor with AM6545 and diacylglycerol lipase with KT109 effectively reduced food intake in both KK-A y and lean mice. These results indicate that overactivation of the intestinal 2-AG-dependent CB1 receptor induces hyperphagia in KK-A y mice without affecting satiety or satiation signals, resulting in an obese phenotype.
The EC system plays a critical role in regulating energy balance by controlling feeding behaviour and energy expenditure(Reference DiPatrizio and Piomelli30,Reference Jesudason and Wittert31) . Importantly, intestinal EC levels fluctuate based on feeding status, with food deprivation increasing levels and refeeding reducing them in healthy rodents(Reference DiPatrizio, Igarashi and Narayanaswami1,Reference Izzo, Piscitelli and Capasso3,Reference Fu, Astarita and Gaetani4,Reference Gomez, Navarro and Ferrer32) . This suggests that the intestinal EC system is influenced by energy status and nutrient availability in the gut, implicating them in obesity. Elevated levels of intestinal ECs have been observed in diet-induced obesity and genetically obese models associated with hyperphagia(Reference Izzo, Piscitelli and Capasso3,Reference Argueta and DiPatrizio11–Reference Argueta, Perez and Makriyannis13) . Similarly, KK-A y mice, a genetically obese model, exhibited high intestinal EC levels (Table 3), increased gene expression (Table 4) and elevated food intake (Figure 2). In addition, pharmacological blockade of peripheral EC signalling with AM6545 and KT109 reduced food intake after food deprivation in KK-A y mice (Figure 4(a) and (b)), similar to a diet-induced obese model(Reference Argueta and DiPatrizio11). Thus, abnormal activation of 2-AG-dependent CB1 receptors in the intestine is associated with hyperphagic behaviour in KK-A y mice.
KK-A y mice exhibited hyperphagia, consistent with the findings from previous studies(Reference Sano, Ryu and Sasase33–Reference Huszar, Lynch and Fairchild-Huntress35). Meal pattern analysis revealed that satiation and satiety were controlled in KK-A y mice similarly to lean mice (Figure 3). The results showed that pharmacological OEA treatment had a comparable effect on food intake and latency in lean and KK-A y mice (Figure 6). Furthermore, blocking CB1 receptors reduced food intake but did not affect meal latency (Figure 4(a) and (b)), suggesting that intestinal 2-AG-dependent CB1 activation plays a role in regulating food intake by affecting meal frequency. Ghrelin, an orexigenic hormone that stimulates appetite and food consumption, can alter meal patterns by increasing feeding frequency without affecting meal size when centrally administered(Reference Faulconbridge, Cummings and Kaplan36). In addition, activation of gut CB1 receptors modulates ghrelin production through the mammalian target of rapamycin (mTOR) pathway(Reference Senin, Al-Massadi and Folgueira37). Therefore, we suggest that the abnormal elevation of 2-AG-dependent CB1 receptor activation leads to obesity by affecting meal frequency via the modulation of ghrelin function. Consistent with this hypothesis, a study in healthy humans demonstrated that hedonic eating was associated with elevated plasma levels of ghrelin and 2-AG(Reference Monteleone, Piscitelli and Scognamiglio38). The alteration in meal frequency in KK-A y mice is unlikely to be due to a constitutive antagonism of MCRs by ASP, which is overexpressed in these mice, as MC4R primarily affects meal size or choice rather than meal frequency(Reference Adan, Tiesjema and Hillebrand17). The KK mouse, characterised by polygenic obesity and insulin-independent diabetes, exhibits hyperphagia(Reference Wang, Sun and Sun29). Although limited information is available on gene mutations in KK mice, Bwq1 (Zc3h4) is related to body weight gain, while Bwq2 is related to increased obesity in the A y mutation(Reference Suto, Matsuura and Imamura15,Reference Suto and Sekikawa39) . Risk variants of Zc3h4 have been linked to emotional eating, a behaviour characterised by overeating in response to negative emotions independent of BMI(Reference Cornelis, Rimm and Curhan40). In this study, KK-A y mice exhibited signs of negative emotion in meal behaviour, such as increased eating rates and latency (Figure 3). It is hypothesised that Bwq1 (Zc3h4) may be one of the genes contributing to obesity by altering meal behaviour through intestinal 2-AG-dependent CB1 activation, warranting further investigation in future studies.
The intestinal EC system is upregulated in diet-induced and genetically obese rodents, although the mechanism is still unknown(Reference Izzo, Piscitelli and Capasso3,Reference Argueta and DiPatrizio11,Reference Argueta, Perez and Makriyannis13) (Table 3). Intestinal ECs were increased in genetically obese mice fed standard chow, suggesting that low-grade inflammation caused by HFD or consumption of a high level of n-6 PUFA is not the reason for elevated intestinal ECs(Reference Izzo, Piscitelli and Capasso3) (Table 3). In addition, EC levels were much higher in the intestine of KK-A y mice compared with HFD-induced obese, ob/ob, or db/db mice (Table 2)(Reference Izzo, Piscitelli and Capasso3,Reference Avalos, Argueta and Perez10–Reference Suriano, Manca and Flamand12) . In this study, KK-A y mice were used, in which the central MC system was inhibited by the ubiquitous overexpression of ASP; therefore, cholinergic parasympathetic preganglionic neurons in the dorsal motor nucleus of the vagus might be inhibited in the mice(Reference Sohn, Harris and Berglund41). Furthermore, the stimulation of the intestinal EC system in the hunger state requires efferent vagal activation of muscarinic acetylcholine receptors in the intestine(Reference DiPatrizio, Igarashi and Narayanaswami1,Reference Pradhan and Roth5) . Overall, in the obese condition, efferent vagal activation of muscarinic acetylcholine receptors might be necessary to increase EC levels.
Nonetheless, CB1R, which are expressed in the afferent vagus nerve, are suggested to control feeding behaviour and energy balance by directly modifying gut–brain vagal signalling(Reference Burdyga, Varro and Dimaline42,Reference Burdyga, Lal and Varro43) . Intestinal ECs are high in mice with diet-induced and genetic obesity as well as in lean mice under fasting conditions(Reference DiPatrizio, Igarashi and Narayanaswami1,Reference Fu, Astarita and Gaetani4,Reference Burdyga, Varro and Dimaline42,Reference Burdyga, Lal and Varro43) , suggesting a link between the activation of the intestinal EC system and hunger feelings. However, the pharmacological blockade of peripheral CB1R reduced food intake in HFD diet-induced and KK-A y mice, but not in ob/ob and db/db mice with genetically defective leptin signalling(Reference Argueta and DiPatrizio11,Reference Argueta, Perez and Makriyannis13,Reference Tam, Cinar and Liu14) . Cb1r KO mice exhibited increased leptin sensitivity, whereas chronic blockade of peripheral CB1R attenuated hyperleptinemia in mice with HFD-induced obesity(Reference Tam, Cinar and Liu14,Reference Tam, Vemuri and Liu44,Reference Ravinet Trillou, Delgorge and Menet45) . Therefore, leptin signalling might be necessary for anti-obesity effects induced by reducing food intake via CB1R blockage in the gut, similar to its effect in the brain(Reference Di Marzo, Goparaju and Wang46).
Lipidomics analysis revealed an increase in COX metabolites from AA, such as PGE2, PGD2 and PGF2α , along with the up-regulation of related gene expression in the intestine of KK-A y mice (Tables 3 and 4). In addition, blockade studies using COX inhibitors, ibuprofen and acetaminophen, led to reduced food intake in both lean and KK-A y mice (Figure 5), suggesting that feeding behaviour is partially controlled through PGs(Reference Burstein47). In addition, the expression of Ptger1, Ptges and Ptges2 was found to be elevated in the intestine of KK-A y mice compared with lean mice (Table 4), indicating that increased PGE2 signalling via EP1 receptor in the intestine may contribute to hyperphagia in KK-A y mice. In a human study, intraduodenal infusion of PGF2α altered the interdigestive motility pattern by inducing intense contractile activity, while PGE2 infusion delayed the initiation of motility(Reference Tollstrom, Hellstrom and Johansson48). Conversely, centrally administered PGE2 suppressed food intake via the EP4 receptor, whereas PGD2 increased food intake via the DP1 receptor(Reference Ohinata and Yoshikawa49,Reference Ohinata, Suetsugu and Fujiwara50) . Notably, ibuprofen, acetaminophen and KT109, but not AM6545, increased meal latency only in lean mice (Figure 3 and 4). PGs and ECs act locally through specific receptors, with their effects varying depending on the tissues or cell types. Therefore, further investigation focusing on the role of PGs and their receptors in the gut could provide valuable insights for the development of anti-obesity drugs.
Intestinal OEA, synthesised from dietary oleic acid, acts as a satiety factor. Previous studies have demonstrated that the systemic administration of OEA can reduce food intake in rodent models of HFD-induced obesity and genetic obesity, such as the Magel2 KO mice and Zucker rats(Reference Igarashi, Narayanaswami and Kimonis23,Reference Fu, Oveisi and Gaetani51) . In addition, the intraperitoneal administration of OEA led to a significant reduction in food intake in KK-A y mice in the present study. However, studies have noted variable intestinal OEA levels in obese model rodents, such as the Magel2 KO mice(Reference Igarashi, Narayanaswami and Kimonis23,Reference Igarashi, DiPatrizio and Narayanaswami52–Reference Lacroix, Pechereau and Leblanc54) . These results suggest that the administration of exogenous OEA, but not endogenous OEA, reduced food intake in these mouse models of obesity, indicating that the primary mechanism underlying exogenous OEA-induced satiety is functional in the obese models. Therefore, OEA supplementation may be considered to control hyperphagia through satiety induction; however, further investigation is warranted to confirm the safety of this approach.
Supplementary material
For supplementary material/s referred to in this article, please visit https://doi.org/10.1017/S000711452610676X
Acknowledgements
The authors would like to thank Dr Yoshikatsu Eto at the Southern TOHOKU Research Institute for Neuroscience for providing his support for the resources. The authors would like to thank Enago (www.enago.jp) for the English language review.
This work was supported by the Japan Society for the Promotion of Science (JSPS) KAKENHI (grant nos. 20K05920 and 23K05122 to MI and 21K06807 to KY) and an internal grant by Saitama Medical University (grant no: 23-B-1-05 and 24-B-1-10 to KY).
M. I.: Conceptualization, Data Curation, Funding Acquisition, Investigation, Project Administration, Resources, Supervision, Validation, Visualisation, Writing – Original Draft, and Writing – Review and Editing. K. I.: Investigation and Writing – Review and Editing. S. Y.: Investigation and Writing – Review and Editing. T. O-N.: Investigation, Writing – Original Draft (partially) and Writing – Review and Editing. I. K.: Resources and Writing – Review and Editing. K. Y.: Resources, Data Curation, Supervision, Funding Acquisition, and Writing – Review and Editing. All authors approved the final version of the manuscript for submission.
There are no conflicts of interest.
The data are available on request from the corresponding author.