INTRODUCTION
The hydrographic Great Basin (GB) of the American Southwest encompasses an area of ~520,000 km2 where waters drain into interior evaporative basins. Contained within this region are more than 600 mountain ranges, including at least 37 whose summits extend 3050 meters above sea level (m asl) (Grayson, Reference Grayson2011; Charlet, Reference Charlet2020). The mountain complexes are isolated by broad basin networks with floors that reach 750–1800 m asl. The physiography of the semiarid GB supports contemporary ecosystems from cold, alpine mountain to hot, dry desert habitats. In part due to physical and biotic diversity, and also promoted by dry conditions that allow excellent preservation of organic and inorganic materials, the GB has been the focus of extensive paleoclimatic study. Multiple proxies are available for reconstruction of past environments, including sediment cores taken from Pleistocene lake beds in valley basins (e.g., Benson and Thompson, Reference Benson and Thompson1987) and from mountain lake bottoms (e.g., Reinemann et al., Reference Reinemann, Porinchu, Bloom, Mark and Box2009); packrat (Neotoma spp.) middens containing rich suites of plant fossils from rocky slopes (e.g., Thompson and Mead, Reference Thompson and Mead1982); and dendrochronological records extracted from conifers in woodland (e.g., Biondi et al., Reference Biondi, Jamieson, Strachan and Sibold2011) to subalpine communities (e.g., LaMarche, Reference LaMarche1974). Each proxy gives insight into specific environmental attributes, collectively providing comprehensive understanding of past climates at temporal scales from inter-annual to multi-millennia, and from local to regional spatial scales.
For the Late Holocene, literature concerning GB climates is especially robust. Low-frequency climate variability has been documented with multiple proxies, defining the spatial and temporal bounds of multi-centennial climate episodes at a relatively high resolution. The Late Holocene Dry Period (LHDP), for example, was an approximately 950-yr period (2800–1850 yr BP) of persistent aridity in the central GB (Tausch et al., Reference Tausch, Nowak, Mensing, Chambers and Miller2004; Mensing et al., Reference Mensing, Sharpe, Tunno, Sada, Thomas, Starratt and Smith2013). Severe, prolonged drought at this time is indicated by lakes, rivers, and marshes becoming desiccated or reaching low stands, e.g., Walker Lake (Adams, Reference Adams2007), Mono Lake (Stine, Reference Stine1990, Reference Stine1994), and Pyramid Lake (Mensing et al., Reference Mensing, Benson, Kashgarian and Lund2004, 2008), and by expansion of dry-adapted vegetation (Nowak et al., Reference Nowak, Nowak and Tausch2017). Mensing et al. (Reference Mensing, Sharpe, Tunno, Sada, Thomas, Starratt and Smith2013) narrowed the geographic boundaries for the LHDP, describing the northern extent at ~40–42°, and documenting extreme drought in the western GB and a weaker signal in the eastern GB.
Similarly, the Medieval Climate Anomaly (MCA), documented in many parts of the Northern Hemisphere, has been extensively examined in the GB. From multiple proxies, the MCA is described as a 450-yr interval (1200–750 yr BP) of severe aridity that affected much of the GB (Graumlich, Reference Graumlich1993; Scuderi, Reference Scuderi1993; Stine, Reference Stine1994; Mensing et al., Reference Mensing, Benson, Kashgarian and Lund2004, 2008; Millar et al., Reference Millar, King, Westfall, Alden and Delany2006; Adams, Reference Adams2007; Salzer et al., Reference Salzer, Bunn, Graham and Hughes2014a; Hatchett et al., Reference Hatchett, Boyle, Putnam and Bassett2015; Bacon et al., Reference Bacon, Lancaster, Stine, Rhodes and Holder2018). Extending into the modern era, the global Little Ice Age (LIA; AD 1400–1920) brought cold and wet conditions to much of the mountainous GB. Multiple proxies indicate this interval to be a time of increased precipitation and cooler temperatures, especially lower summer minimum temperatures relative to current conditions (LaMarche, Reference LaMarche1974; Feng and Epstein, Reference Feng and Epstein1994; Lloyd and Graumlich, Reference Lloyd and Graumlich1997; Osborne and Bevis, Reference Osborne and Bevis2001; Bowerman and Clark, Reference Bowerman and Clark2011).
In addition to delineating the temporal and spatial extents of climate episodes, mechanisms have been described to explain occurrences of climate episodes in the Great Basin. Higher frequency climate modes, including the Atlantic Multidecadal Oscillation (AMO) and Pacific Decadal Oscillation (PDO), have been implicated in GB climate episodes during paleo-historic intervals as well as contemporary times. B. Cook et al. (Reference Cook, Smerdon, Seager and Cook2014) analyzed the expression of paleo-historic droughts in the GB, including, but not limited to, intervals such as the MCA, and linked them to positive values of the Southern Oscillation Index (SOI). Strong drivers influencing dry/wet conditions in the GB related to winter and spring PDO, and winter and spring AMO (B. Cook et al. Reference Cook, Smerdon, Seager and Cook2014; Wise, Reference Wise2016). Mensing et al. (Reference Mensing, Sharpe, Tunno, Sada, Thomas, Starratt and Smith2013) implicated patterns of the SOI, AMO, and related climate modes as mechanisms likely contributing to extreme aridity in the GB during the LHDP, and these modalities have been commonly described as drivers of climate intervals for much of the GB (B. Cook et al., Reference Cook, Smerdon, Seager and Cook2014; Wahl et al., Reference Wahl, Starratt, Anderson, Kusler, Fuller, Addison and Wan2015; Noble et al., Reference Noble, Ball, Zimmerman, Maloney, Smith, Kent, Adams, Karlin and Driscoll2016; Bacon et al., Reference Bacon, Lancaster, Stine, Rhodes and Holder2018).
Historic vegetation of the GB has also been widely studied (Grayson, Reference Grayson2011). Many of these studies have emphasized movements and changing compositions of plant communities in elevation and space at glacial to interglacial scales (e.g., Wells, Reference Wells1983; Thompson, Reference Thompson, Huntley and Webb1988, Reference Thompson, Betancourt, Van Devender and Martin1990). For Holocene conditions, attention has focused on elevation of alpine tree lines as a proxy for plant community response to climate, with expected shifts upslope documented for warm intervals such as the MCA and downslope for cool intervals such as the LIA (LaMarche and Mooney, Reference LaMarche and Mooney1972; LaMarche, 1973; Lloyd and Graumlich, Reference Lloyd and Graumlich1993; Bruening et al., Reference Bruening, Tran, Bunn, Weiss and Salzer2017).
Less studied have been the growth responses of GB trees to climate. Early work on Great Basin bristlecone pine (Pinus longaeva) elucidated a temperature response in trees growing at upper tree line and a contrasting precipitation response at lower tree line (LaMarche, Reference LaMarche1974; LaMarche and Stockton, Reference LaMarche and Stockton1974; Hughes and Funkhouser, Reference Hughes and Funkhouser2003). Recent work on this species revealed contrasting fine-scaled growth responses to microclimate within the highest elevation zone, i.e., near upper tree line, with precipitation playing a factor in warmer sites and temperature in cooler sites (Salzer et al., Reference Salzer, Larson, Bunn and Hughes2014b; Tran et al., Reference Tran, Bruening, Bunn, Salzer and Weiss2017; Bunn et al., Reference Bunn, Salzer, Anchukaitis, Bruening and Hughes2018).
To expand understanding of subalpine tree response to historic climate, we studied growth in limber pine populations of the GB. We did not seek to reconstruct climate or dissect climate mechanisms but rather to explore ecological implications of known historic climate variability on a common tree species. Limber pine, Pinus flexilis James (Pinaceae), is the widest ranging subalpine conifer in the GB (Griffin and Critchfield, Reference Griffin and Critchfield1976; Burns and Honkala, Reference Burns and Honkala1990; Charlet, Reference Charlet2020). It is the sole high elevation conifer in many GB mountain ranges, occurring ~2700 m asl, and regularly forms the upper tree line. From prior studies, growth and demographics in the species have been shown to have a complex response to climate, with moisture a primary driver (Millar et al., Reference Millar, Westfall and Delany2007, Reference Millar, Westfall, Delany, Flint and Flint2015, Reference Millar, Charlet, Delany, King and Westfall2019). The objective of this study was to assess the response of limber pine growth to periods of historic climate along a transect of central GB populations, and to evaluate responses at increasing distances from the Pacific Ocean (the primary source of winter precipitation), and at locations that experience variable climates and rain-shadow effects within the overall GB climate regime. We therefore address the following ecological questions in this study: What relationships of growth to contemporary climate exist for the limber pine populations? What were responses to climate that characterized growth in limber populations across the western to central Great Basin over centuries and millennia? And, how did limber pine growth respond to known climate intervals (LHDP, MCA, LIA) across the GB, and to mid- to high frequency climate modes (AMO, PDO)?
METHODS
Study sites
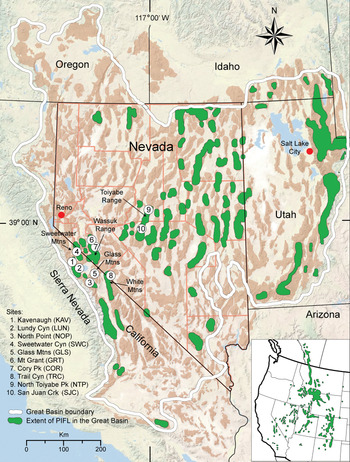
We selected ten study sites along a transect in the central GB, extending from the eastern Sierra Nevada, California, east into central Nevada (Fig. 1, Table 1). This included at least two sites (north/south) at each longitudinal position (hereafter referred to as zones) along the transect, with the intent to assess local variation at each zone as well as responses to climate inland into the GB. Site locations were constrained by the geography of GB mountain ranges, the distribution of limber pine populations, and the status of populations in those ranges. For development of long chronologies, we searched for large populations that contained abundant live mature trees, as well as deadwood with indications of long-term preservation. Some sites we initially sampled yielded records that were too short in time, or sample sizes that were too small to be of value, so these were excluded. Locations used in final analyses (Table 1; Fig. 1, 2), classified in increasing distance from the Sierra Nevada crest (indicating their relative position in the Great Basin), included three sites in the eastern Sierra Nevada, extending from Bridgeport, CA to June Lake, CA (Zone 1); one site each in the Sweetwater Mountains and the Glass Mountains, CA (Zone 2); two sites in the Wassuk Range, NV, and one site in the northern White Mountains, CA (Zone 3); and two sites in the Toiyabe Range, NV (Zone 4). Mean site elevations ranged from 2798–3155 m asl. At each site, we sampled 1–10 local stands. One new field collection was made from the Wassuk Range to extend analysis to the present date; otherwise, field collections and most analyses for the Wassuk sites derive from a previous study by Millar et al. (Reference Millar, Charlet, Delany, King and Westfall2019).
(color online) Study region and study areas in the Great Basin (GB), southwestern USA, showing GB boundary and mountain ranges, distribution of limber pine (PIFL) in the GB, and location of the ten study sites in the central GB. Inset shows extent of limber pine distribution in green for the western United States and southwestern Canada. Crk, Creek; Pk, Peak; Mtns, Mountains. Basemap modified from 2011 National Geographic Society i-cubed, accessed August 13, 2017 from Data Basin, https://databasin.org/.

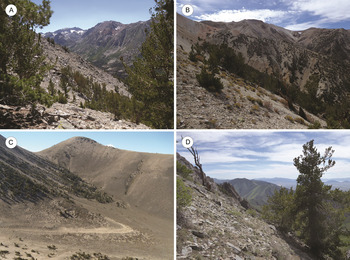
(color online) Photos of limber pine in the study sites across the four zones of the central Great Basin (increasing distance from the Sierra Nevada crest. (A) Zone 1; Kavenaugh Crest, Sierra Nevada, CA. (B) Zone 2; Sweetwater Canyon, Sweetwater Mountains, CA. (C) Zone 3; Trail Canyon, White Mountains, CA. (D) Zone 4; North Toiyabe Peak, Toiyabe Range, NV.

Locations of ten limber pine study sites in the central Great Basin. Zones (mountain groups) ordered by increasing distance inland from the Sierra Nevada crest; sites are ordered north to south within zones. Coordinates given in latitude/longitude for general center of sites. Aspect and general substrate information given for each study site. Abbreviations for sites used in text and figures given in parentheses.

Contemporary climates of the sites vary by location, but generally reflect increasing continentality eastward from the Sierra Nevada. Sites in the western Great Basin tend to receive higher winter precipitation with less summer convection or monsoon-driven precipitation relative to the interior GB, although conditions depend highly on local orographic and topographic effects as well as synoptic patterns. To summarize climate near our study locations, we extracted temperature and precipitation data from the five weather stations nearest our sites (https://wrcc.dri.edu/Climate/west_coop_summaries.php, accessed 15 July 2020): Lee Vining and Bridgeport, CA, and Hawthorne, Montgomery, and Austin, NV. In all cases, the stations are > 600 m below our study sites, and all but two (Austin, NV; Montgomery, NV) are in valleys outside of the mountain ranges; thus, they only broadly reflect climates at our sites. To better describe local climate at each location, we downloaded climate means from the 30 arc-sec (800 m tile) normal PRISM (Parameter-elevation Regressions on Independent Slopes Model) climate data (Daly et al., Reference Daly, Neilson and Phillips1994) for the time period AD 1981–2010, and intersected the data at the coordinates of each study site using QGIS vs. 3.14Pi (QGIS Development Team, 2020).
Field, laboratory, and chronology-building methods
At each site, we extracted increment cores from live limber pines, and cores and stem cross-sections from deadwood. In the field, we recorded latitude, longitude, elevation, and aspect for all samples. In the laboratory, air-dried increment cores and stem cross-sections were processed using standard dendrochronological techniques (Stokes and Smiley, Reference Stokes and Smiley1968; Holmes et al., Reference Holmes, Adams and Fritts1986; Cook and Kairiukstis, Reference Cook and Kairukstis1990). The annual ring sequence of each sample was measured to 0.001 mm accuracy using a Velmex measuring system interfaced with MEASURE J2X measurement software (VoorTech Consulting, 2005).
The program COFECHA was used to assess measurement quality and perform cross-dating correlation analyses (Holmes, Reference Holmes1999; Grissino-Mayer, Reference Grissino-Mayer2001). A 10–15-year cubic smoothing spline (50% frequency response) was employed in COFECHA v6.06p (Holmes, Reference Holmes1999; www.ldeo.columbia.edu/res/fac/trl/public/publicSoftware.html, accessed 15 July 2020). Cross-dating was confirmed by comparing the sample measurement series to the limber pine chronologies developed for the Wassuk Range (Millar et al., Reference Millar, Charlet, Delany, King and Westfall2019), to bristlecone pine tree-ring chronologies obtained from the International Tree-Ring Data Bank (White Mountains Master ITRDB CA506, Campito Mountain ITRDB CA533, Methuselah Walk ITRDB CA535) (ITRDB, 2020), and to other limber pine chronologies developed from nearby locations (Millar et al., Reference Millar, Westfall and Delany2007, Reference Millar, Westfall, Delany, Flint and Flint2015).
To develop master chronologies for climate reconstruction at each site, we screened the initial chronologies to contain series with correlations ≥ 0.40 (compared to a master record assembled from remaining series) to maximize series intercorrelation and minimize the number of generated COFECHA error flags. We developed standardized master chronologies for each site with the program ARSTAN v.44h3 (Cook and Krusic, Reference Cook and Krusic2014), using the regional curve standardization method (RCS; Esper et al., Reference Esper, Cook and Schweingruber2002) with a moderately stiff 200-yr spline for long chronologies and a 66% n cubic spline for shorter chronologies. Both had 50% cutoff, variance stabilization with 90% n cutoff, where n is the series length, and with the robust bi-weight mean to eliminate ancillary stand factors. We used the 200-yr spline to highlight low-frequency time-period trends. For the shorter period-length chronologies, we adjusted the spline length to emphasize higher-frequency variability exhibited by those intervals.
An issue is that there is a potential bias in climate signals from the standard application of RCS detrending and the correction of this bias by the signal-free method. This is an important concern in climate reconstructions. However, our goal in this study was not to reconstruct climate but to assess growth correlations among populations over time, and their correlations with climate. Also, when we applied the RCS signal-free method (RCSigFree; E. Cook et al., Reference Cook, Krusic and Melvin2014) to our longest chronologies, we did not find an increase in correlations with climate in the signal-free chronologies. From ARSTAN, we also assessed inter-tree correlations, or the Expressed Population Signal (EPS), for each site chronology by 50-yr intervals. We did not use an EPS cutoff in our chronologies. Instead, as Melvin and Briffa (Reference Melvin and Briffa2008) suggested, we used EPS diagnostically to indicate sections of the chronology with low coherence.
To assess correlations in growth patterns among locations we used principal components analysis (PCA; SAS, 2015) for the common time period of all chronologies, wherein the chronologies were the variables in the analysis. We chose PCA because it partitions the correlation matrix (or multivariate hyperelipse) structurally. The first principal component represents the common growth trend, whereas the second principal component reflects the degree of relatedness among chronologies. Later principal components represent outlier growth patterns in individual chronologies. Using PCA in this manner, we could evaluate growth trends that were similar among sites for varying time periods of interest (“synchrony”). A further benefit of PCA was that we could construct a composite chronology from the first principal component that combined data from all sites.
To examine recurring behavior of ring widths in the chronologies, we decomposed the time series using wavelet analysis into periodic modes and time using the Gaussian Morlet wavelet and Gabor transform, a complex Morlet wavelet, in Mathematica (Wolfram Research, 2017).
Analysis of growth-climate relationships
To assess climate influences on annual radial growth during the historic period, we followed methods of Millar et al. (Reference Millar, Charlet, Delany, King and Westfall2019) to develop a climate dataset using weather station records. We extracted monthly data from four NOAA Historical Climate Network (HCN) Stations’ long meteorological observations that were nearest to our Sierra Nevada study sites (Zones 1–3) and five nearest to the Toiyabe Range (Zone 4) sites and elevations (https://www.ncdc.noaa.gov/ushcn/data-access, accessed 10 October 2020; Table 2). Using PCA, the data from individual stations were combined into a composite record (AD 1895–2020) for mean annual minimum (Tmin), maximum (Tmax), and annual temperature (Tann); summer minimum temperatures; summer maximum temperature; annual and water-year precipitation (ANNprecip, WYprecip). We also extracted indices of the AMO (https://www.esrl.noaa.gov/psd/data/correlation/amon.us.long.data, 17 May 2020) and of the PDO (http://research.jisao.washington.edu/AMO/PDO.latest.txt, 17 May 2020) for correlation analyses with radial growth.
Weather stations providing long-term data used to assess climatic relationships and radial growth in limber pine. Data provided by the Historical Climate Network (USHCN), with periods of record for all stations 1895–2018, National Climate Data Center (www.ncdc.noaa.gov/oa/climate/research/ushcn, accessed 10 October 2020). Eastern Sierra Nevada and western Nevada stations were used for all sites except the two Toiyabe Range sites (NTP, SJC; see Table 1 for abbreviations), for which the North-Central Nevada stations were used.

Lead cross-correlations were assessed by transfer function analysis in the time series platform in JMP (SAS, 2015), whereby standardized tree-ring width was the dependent variable and climate variables were the independent variables. Where there were significant lead correlations, we summed the data over 1–4 lead years. To test relationships of climate variables to standardized annual ring width, we analyzed simple linear correlations as well as nonlinear relationships. For the latter, we conducted a second-order, least squares-response surface model (JMP, SAS, 2015) with Tmin, Tmax, WYprecip, PDO, and AMO, using annual and seasonal (and lead years, where appropriate) measures from the composite climate dataset. The behavior of these variables was evaluated in second-order response models of the form (x + y + …) + (x + y + …)2 in which redundant interactions were omitted. The behavior of variables included canonical analysis of the model and determining the position of the stationary point, whereby the value of the response neither rises nor falls away from that point (Box and Draper, Reference Box and Draper1987; JMP, SAS, 2015).
To further correlate climate at each location with growth, we used climate means from the 30 arc-sec (800 m tile) normal PRISM climate data (Daly et al., Reference Daly, Neilson and Phillips1994) for the time period AD 1981–2010. We focused on climate variables known from our prior limber pine studies to be important for growth, including: minimum and maximum annual temperatures, annual precipitation, July dewpoint temperature, and minimum and maximum vapor-pressure-deficits. From these, we computed winter and summer means for temperature, and winter, spring, and summer sums for precipitation, where seasons were defined as 1) winter: December, January, February; 2) spring: April, May, June; and 3) summer: July, August, September.
We computed mean raw ring widths for the period AD 1981–2010 (corresponding to the period of the PRISM data) that represented growth rates related to the climate data. Due to limited degrees-of-freedom in the data, we assessed correlations of mean growth with climate at each location by PCA (SAS, 2015). Climatic variables selected for the analysis were those with absolute correlations > 0.4 to mean growth: winter, spring and summer precipitation, annual and winter TMax, July dewpoint temperature (TD07), and minimum vapor pressure deficit (VPDmin).
RESULTS
Characterization of chronologies
Core and wood samples retrieved from ten Great Basin sites yielded 1696 dated tree ring series (Table 3; Supplemental Fig. 1). Considering all series and sites together, dates extended from the present (outer complete ring; AD 2019) to 1983 BC (inner ring), cumulatively covering 4002 years without gaps. Age depth varied by site (Table 3; Figs. 3, 4): two sites had chronology lengths that extended > 2400 yr (Mt. Grant and North Point). Of the remainder, all but one extended > 1000 yr; San Juan Creek was the shortest set with an overall series length of 861 yr. None of the individual site chronologies had gaps. The oldest living tree had 988 rings, and the longest deadwood stem had 1575 rings; these derived from the Wassuk Range collection. Mean raw ring widths for AD 1981–2010 increased from the Sierra Nevada (Zone 1) to the Toiyabe Range (Zone 4), with northern sites in each zone having larger ring widths than southern sites (Table 3).
Limber pine live trees and deadwood sampled for dendrochronological analysis at ten sites in the Central Great Basin, with number of cores dated, mean raw ring widths in mm, age ranges, and series length in years. Mean raw ring widths are based on the period 1981–2010, and were used for climate analysis with PRISM data.

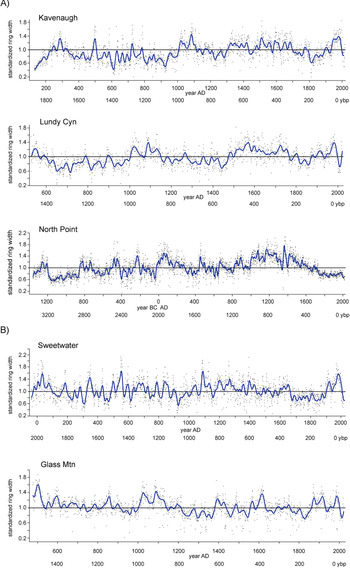
Full chronologies for (A) Zone 1, Sierra Nevada; (B) Zone 2, Sweetwater and Glass Mountains sites. Standardized ring width is plotted by calendar date and ybp, which here refers to “years before 2020.” Black points are individual year ring widths. Smoothing was done with a cubic spline with lambda = 1000 (blue curve; SAS, 2015). Black line references standardized ring width mean for the duration of the site chronology. (For interpretation of the references to color in this figure legend, the reader is referred to the web version of this article.)

(color online) Full chronologies for (A) Zone 3, Wassuk Range (all sites combined), White Mountains; (B) Zone 4, Toiyabe Range sites. Standardized ring width is plotted by calendar date and ybp, which here refers to “years before 2020.” See Fig. 3 for further explanation.

Sample depth for the chronologies varied by site and time interval (Fig. 5). With important exceptions, sample depth generally decreased from current to oldest dates in each chronology. While some portions of the chronologies had < 15 series per 50-yr intervals, most had 15–80 series. EPS values were generally high (≥ 0.80) throughout much of the time depth of the chronologies, even in periods of low sample depth, and indicated high intra-site, inter-series correlation in tree growth (Fig. 5). Extreme low spikes in EPS (Fig. 5, Table 4) occurred in all the chronologies; these were not consistently related to sample depth. Low EPS spikes, especially where sample numbers were high, suggest local or regional influences that caused trees to respond individualistically within and/or between sites. Periods of relative synchrony of EPS low spikes include: 200 BC to AD 400 (6 sites), AD 600 to AD 800 (3 sites), AD 840 to AD 900 (2 sites), and AD 1200 to AD 1400 (3 sites) (see Table 4). Low EPS events occurred at other times in individual chronologies. Because of the 50-yr intervals of EPS calculation, values more recent than AD 2000 are not assessed.
(color online) Expressed population signal (EPS) and sample depth for nine study sites, assessed in 50-yr intervals. Plotted using Mathematica (Wolfram, 2017). Time is indicated by calendar date and ybp, which here refers to “years before 2020.” Site abbreviations: KAV, Kavenaugh; LUN, Lundy Canyon; NOP, North Point; SWC, Sweetwater Canyon; GLS, Glass Mountains; WAS, Wassuk; TRC, Trail Canyon; NTP, North Toiyabe Peak; SJC, San Juan Creek.

Date intervals when site chronology EPS values spiked < 0.8. Low EPS spikes, especially with high sample numbers (see Table 3), suggest local or regional influences that caused trees to respond individualistically both within and/or between sites.

Periods when changes in sample depth occurred, also illustrated by histograms of sample time spans (Fig. 6, Supplemental Fig. 1), reveal times of potentially unusual influence on tree growth and survival. This is most likely during periods of low tree establishment that occur during times of otherwise routine levels of recruitment, and, to a lesser degree, periods of clustered death dates. At the North Point (NOP) stand, for instance, a low sample-depth period was characterized by a break in series with pith dates from AD 1100 to AD 1425. Death dates also cluster around AD 1350 in series from this time interval at NOP. Declines in sample depth also occurred during extended droughts such as the MCA, suggesting a demographic response to climate. Other periods of low sample depth occurred during the oldest intervals of the chronologies. These more likely reflect decreasing wood preservation rather than unusual pressures on tree establishment and growth.
Example of tree-ring series showing clustered birth and death periods. 186 limber pine live and dead series from North Point in the Sierra Nevada, CA, ordered chronologically by inside ring date and including all dated stems. Time is indicated by calendar date and ybp, which here refers to “years before 2020.”

Chronologies of standardized ring width illustrate variability and trends in ring width within and among sites at different temporal scales. Circum-twentieth century excerpts (AD 1890–2020) from the full length site chronologies illustrate sites that had synchronies of high and low growth during the instrumental period and also indicate growth in this period relative to the mean of the full chronologies (standardized ring width 1.0; Figs. 7, 8). The twentieth century began at all sites except NOP with an approximately 35 year period of moderate to slightly above average growth, followed by a synchronous 10 year, low-growth dip from AD 1927–1937 at all sites except those in the Toiyabe Range and TRC. For the Toiyabe stands, a dip in growth occurred earlier (AD 1910–1923), high growth occurred during the next ten years, and a low growth period occurred from AD 1933–1937. This was followed at all sites by an extended period of moderate growth, varying in timing by site, from AD 1965–2000. Subsequently, starting at AD 2000, growth rapidly declined at all sites, and, for most chronologies, to the lowest values of the 130 year interval. The period of extreme low growth continued at all sites until AD 2014, when growth rapidly increased and continued to increase to the present (outer ring sampled), except at Trail Canyon, where growth continued to decline. At all sites except North Point, growth in the 130 year modern period fluctuated around the long-term means; at North Point, growth throughout this period was considerably and consistently below the long-term mean. At North Toiyabe Peak and San Juan Creek, growth fluctuated around the long-term mean briefly, but most ring widths were above the mean.
AD 1890–AD 2020 chronologies for (A) Zone 1, Sierra Nevada sites; (B) Zone 2, Sweetwater and Glass Mountains sites. Standardized ring width is plotted by calendar date and ybp, which here refers to “years before 2020.” Black points are individual year ring widths. Smoothing was done with a cubic spline with lambda = 1 (blue curve; SAS, 2015). Black line references standardized ring width mean of each full-length site chronology. (For interpretation of the references to color in this figure legend, the reader is referred to the web version of this article.)

(color online) AD 1890–AD 2020 chronologies for (A) Zone 3, Wassuk Range (all sites combined) and White Mountains sites, and (B) Zone 4, Toiyabe Range sites. Standardized ring width is plotted by calendar date and ybp, which here refers to “years before 2020.”
See Fig. 7 caption for further explanation.

The twentieth century variability is seen in perspective relative to mid-frequency trends in excerpts from the full chronologies for the past 620 years (Figs. 9, 10). This interval captures the LIA (AD 1400–1920) through present, and shows some sites with synchronies at this scale and others having different patterns. At most of the sites, growth during the first half of the LIA (AD 1400–1650) was highly variable, with moderate swings of increased and decreased growth around the mean, and with periods of increased ring width predominant. Exceptions occurred in the Trail Canyon and North Toiyabe Peak stands, which had significant but asynchronous intervals of low growth. Conversely, in the Wassuk stands, intervals of extremely high growth occurred in this period. During the latter portion of the LIA (AD 1700–1900), sustained low or near-average/low growth occurred at all sites. The low-growth spike after AD 2000 (noted from the twentieth century excerpts as described previously), documents, at this multi-century scale, the lowest or near-lowest growth during the 620 year period for all sites except Kavenaugh and the stands in the Toiyabe Range.
AD 1400–AD 2020 chronologies for (A) Zone 1, Sierra Nevada sites; (B) Zone 2, Sweetwater and Glass Mountains sites. Standardized ring width is plotted by calendar date and ybp, which here refers to “years before 2020.” Black points are individual year ring widths. Smoothing was done with a cubic spline with lambda = 100 (blue curve; SAS 2015). Black line references standardized ring width mean of the full-length site chronology. (For interpretation of the references to color in this figure legend, the reader is referred to the web version of this article.)

(color online) AD 1400–AD 2020 chronologies for (A) Zone 3, Wassuk Range (sites combined) and White Mountains sites; (B) Zone 4, Toiyabe Range sites. Standardized ring width is plotted by calendar date and ybp, which here refers to “years before 2020.”
See Fig. 9 caption for further explanation.

The full chronologies (Figs. 3, 4) put the low and high frequency variability of recent centuries in deeper time perspective, and document variability and trends in the pre-AD 1400 yr period. Despite intervals of low sample depth for the sites whose chronologies extended older than 800 BC (North Point and Wassuk Range sites), there are corresponding patterns in their chronologies at those times. Both North Point and Wassuk Range stands showed low growth before 1300 BC, a short subsequent interval of high growth, then sustained low growth from 1200 BC to 850 BC. Sample depth for these stands was high for the subsequent 1000 yr period from 800 BC to AD 100, during which interval there was considerable growth variability but with intersite synchronies; the period is dominated by low growth broken by short spikes of high growth. Low growth characterized the periods 400 BC–300 BC and 50 BC–AD 100, the latter being especially extreme in the Wassuk chronologies. Growth response was highly individualistic by site for the next 700 years. Subsequently, all eight sites that included the age range from AD 800–1000 had a low growth dip during or at the end of that period (KAV, LUN, SWC, GLS, GRT, COR, TRC; See Table 1, Fig. 1 for abbreviations). All ten sites had a high growth spike from AD 1000–1175, followed by 150 years (AD 1175–1350) of low growth at all sites except North Point and Trail Canyon.
The PCA among all sites revealed patterns of synchrony in growth among locations (Fig. 11a). Fifty-eight percent of the variation was described by the first two principal components (PC); correlations of the California chronologies with PC1 were > 0.6 except North Point, which was uncorrelated. The Toiyabe Range locations were weakly correlated to PC1 (~0.5). North Point was highly correlated with PC2 and North Toiyabe Peak was negatively correlated. This distinction of North Point from the other California sites was based primarily on its diminished growth over the past 850 years, whereas growth at North Toiyabe Peak tended to increase. Plotting the scores of PC1 gave a composite chronology from AD 1150–2020, which documents prominent features for all sites combined (Fig. 11b). This chronology shows the generally low growth at AD 1175–1350, subsequent above average growth until AD 1650, sustained low growth from AD 1700–1900, increasing growth rates thereafter until AD 1990, and the steep decline in growth of the past 30 years.
(color online) Principal components analysis of ring widths based on all sites. (A) Principal components plot showing relationships of sites. Principal components (PC) 1 and 2 described 58% of the total variation in the data. GRT (Mt. Grant) and COR (Cory Peak) sites are included in WAS (Wassuk Range). (B) Composite chronology of standardized ring widths from all sites based on scores from PC1. In both graphs, PC scores are standardized. Standardized ring width is plotted by calendar date and ybp, which here refers to “years before 2020.” NOP, North Point; SWC, Sweetwater Canyon; WAS, Wassuk; KAV, Kavenaugh; TRC, Trail Canyon; LUN, Lundy Canyon; GLS, Glass Mountains; SJC, San Juan Creek; NTP, North Toiyabe Peak.

Climate of the study sites
Climate values summarized from the NOAA weather stations and PRISM model 30-yr normal data characterize recent climate at the study sites and provide input for analyses with ring widths. Weather station data, despite their lower elevations and relative distance from the mountain sites, showed expected trends in precipitation and general decrease in annual precipitation and snow depth from west to east across the transect of our study (Table 5a). The stations are strongly influenced, however, by site elevations, with records from low, dry sites (e.g., Hawthorne, NV) indicating location on a basin floor as well as in a triple rain shadow. The higher elevation sites (e.g., Lee Vining, CA, and Austin, NV) showed expected lower temperatures and higher precipitation.
Historic climate data for ten study sites. (A) NOAA COOP weather station summaries (https://wrcc.dri.edu), POR—period of record; DJFM—December, January, February, March. (B) Data extracted for the locations of the study sites from the PRISM climate model, 30 arc-sec data, for the period AD 1981–AD 2010. PPT-ann, annual precipitation; PPT-DJF, precipitation; December, January, February precipitation; PPT-AMJ, April, May, June precipitation; PPT-JAS, July, August, September precipitation; T-ann, annual temperature; Tmin-ann, annual minimum temperature; Tmin-DJF, December, January February minimum temperature; Tmin-JAS, July, August September minimum temperature; Tmax-ann, maximum annual temperature; Tmax DJF, December, January, February maximum temperature; Tmax-JAS, July August, September maximum temperature; VPD-vapor pressure deficit. In data processing, the VPDmax were truncated to whole integers.

PRISM model values arguably indicate local site climate better than station data in that they estimate conditions at local pixels (Table 5b). These values highlighted the variability among the sites, with annual precipitation ranging from 742 mm (Sweetwater Canyon) to 418 mm (Cory Peak), winter precipitation ranging from 397 mm (North Point) to 109 mm (Trail Canyon), and summer precipitation ranging from 80 mm (San Juan Creek) to 45 mm (North Point). The greater amount of summer precipitation in the eastern sites relative to the Sierra Nevada may explain the high annual precipitation values for Austin, NV, as indicated by the weather station data. Temperatures from PRISM were more consistent relative to geographic proximity, with the Sierra Nevada sites generally warmer and wetter annually and in winter than interior Great Basin sites.
Growth-climate relationships
From PCA of the site locations and PRISM climate data, the first two principal components (PC) described 78% of the variation (Fig. 12). For PC1, the highest negative correlations in the climate data were with spring and summer precipitation and minimum vapor-pressure-deficit (VPDmin; −0.90 > r < −0.76), and highest positive correlations with annual- and winter maximum temperature, winter precipitation, and July dewpoint temperature (TD07; 0.60 > r < 0.91). For PC2, the highest positive correlations were with annual and winter maximum temperatures, and winter minimum temperatures (0.42 > r < 0.77) (Fig 12a). In addition, mean ring width was negatively correlated with PC1 (r = −0.88) and uncorrelated with PC2. With this, mean growth rate was positively correlated with spring and summer precipitation and negatively with winter precipitation and temperature. Thus, locations with low PC1 scores, including NTP and SJC, tended to have high mean growth associated with higher spring and summer precipitation and VPDmin and lower annual and winter TMax, winter precipitation, and TD07 (Fig. 12b, see Table 1 for site abbreviations). The opposite occurred for locations such as NOP and GLS, which had high PC1 scores. Locations GRT, COR, and SWC were near mean values for the first vector (Fig 12b, Table 5b). Most zones tended to cluster together on the first PC, and SJC, GR, and GL were above the mean in PC2 scores.
(color online) Principal components analysis of ten limber pine study site locations (see Table 1 for site names and abbreviations and Fig. 1 for map) and 7 PRISM climate data values extracted for the site locations (see Table 5 for climate variables and abbreviations). Only climatic variables with correlations > 0.4 with mean growth at the locations were used in analysis. (A) PCA plot showing correlations of climate variables with PC 1 and 2. See text for climate variables; “raw rw,” raw ring widths. (B) PCA scores from PC 1 and 2 showing site correlations. Polygons enclose sites in mountain zones progressively east from the Sierra Nevada crest (Zone 1, Sierra Nevada; Zone 2, Sweetwater Mountains and Glass Mountains; Zone 3, Wassuk Range and White Mountains; Zone 4, Toiyabe Range). PC scores are standardized and range from 4 to −4.

Model correlations of ring width with composites of the NOAA HCN weather station data varied from 0.36–0.78, with the lowest model correlations for the LUN and Toiyabe Range sites (mean 0.6; Table 6). Significant correlations occurred with most of the climate variables. Negative correlations to annual maximum temperature (mean r = −0.7) were common to sites in all zones; negative correlations to summer maximum temperature (mean r = −0.7) occurred for sites in Zones 1–3 but were not significant for the Toiyabe sites. Strong negative correlations also occurred in sites from all zones for summer Tmin (mean r = −0.5), with the exception of the Kavenaugh site, which had a strong positive correlation (r = 0.9). All sites had significant positive correlations to WYprecip (mean r = 0.4). All sites except Kavenaugh had significant negative correlations to the AMO (mean r = −0.6), whereas only the Wassuk sites were significantly correlated with the PDO (mean r = 0.4). The composite site model had significant negative correlations with annual Tmin, summer Tmax, and the AMO, and significant positive correlations with WYprecip. We did not find differences in correlations with precipitation and temperature related to elevation or aspect as in bristlecone pine (Salzer et al., Reference Salzer, Larson, Bunn and Hughes2014b), although in most of our sites, samples were at multiple aspects, and at two locations there were no living trees on the several aspects where there was deadwood that we analyzed.
Climate correlations and expressed population signal (EPS) for limber pine chronologies, based on NOAA Historic Climate Network (HCN) station data. Correlations are with predicted standardized ring widths. Only significant correlations (p < 0.05) are given. GRT, Mt. Grant; COR, Cory Peak. EPS is mean value by site for the HCN period-of-record used, 1905–2020. Annual Tmax, maximum annual temperature; Summer Tmax, maximum summer (July–September) temperature; Annual Tmin, minimum annual temperature; Summer Tmin, minimum summer temperature; WYprecip, water-year precipitation; Pacific Decadal Oscillation, PDO; Atlantic Multidecadal Oscillation, AMO.

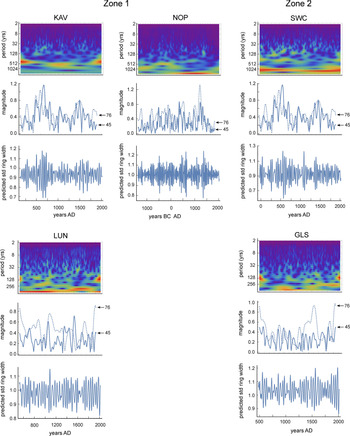
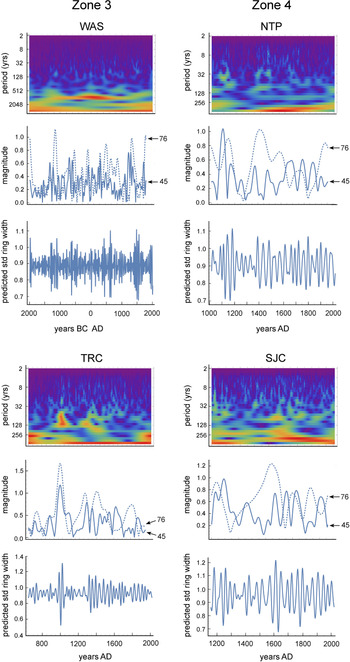
Wavelet analyses for each site highlight low to high frequency quasi-cyclic patterns in ring width for the duration of each chronology (Figs. 13, 14), some of which correspond to known climate modes and/or intervals, such as the LIA, MCA, and the LHDP. Periodicities of 200–550 yr showed correlated intervals of high power (magnitude) among sites from AD 2000–1700 (KAV, LUN, NOP, SWC, GLS, TRC, NTP, and SJC; see Table 1 for abbreviations); from AD 1400–900 (all sites); and from AD 300–600 BC (all four sites that include this time depth: KAV, NOP, LUN, WAS). Mid-frequency variability associated with AMO periodicity (45–76 yr) also showed higher magnitude and synchrony among the sites (Figs. 13, 14; Supplemental Fig. 2). Intervals of high AMO magnitude occurred during AD 1900–1750 (KAV, LUN, GLS, NTP, SJC) and AD 1700–1300 (KAV, LUN, SWC, GLS, TRC, NTP, and SJC). For the sites with longer chronologies, correlated periods of strong AMO amplitude and thus magnitude occurred during AD 700–400 (KAV, LUN, SWC, GLS, and WAS) and 500 BC–700 BC (NOP, WAS).
Wavelet analyses of standardized ring widths for Zones 1 and 2 sites over their full chronologies. For each site, the top figure is the wavelet power spectrum; warmer colors (red) indicate higher power for periods ranging from 2 yr to >254 yr at specific time intervals. Middle plots show the power (magnitude) of the signal across the time of each chronology for periods of 45 yr and 76 yr, which characterize the span of the AMO mode. Bottom graphs plot modeled ring widths over time of each chronology based on AMO variability within the 45–76 yr AMO periodicity range. KAV, Kavenaugh; NOP, North Point; SWC, Sweetwater Canyon; LUN, Lundy Canyon; GLS, Glass Mountains. (For interpretation of the references to color in this figure legend, the reader is referred to the web version of this article.)

(color online) Wavelet analyses of standardized ring widths for Zones 3 and 4 sites over their full chronologies. See Fig. 13 caption for explanation. WAS, Wassuk; NTP, North Toiyabe Peak; TRC, Trail Canyon; SJC, San Juan Creek.

DISCUSSION
Chronology attributes and climate
A striking aspect from the ten limber pine chronologies was the highly individualistic response for each site. While climate-related trends were apparent in the data, local site characteristics, including local weather, and likely topography and geology, exerted considerable influence. We expected wood preservation (chronology length) to relate to moisture, with drier sites promoting longer preservation. Considering the age depth of chronologies at the ten sites, the oldest was from the Mt. Grant stands (4002 years in 2019) and third oldest from Cory Peak (2408 yr) in the Wassuk Range. Onsite, this range appears extremely dry, with sparse, arid, low-stature, non-arboreal vegetation. Situated in a triple rain shadow from the Sierra Nevada crest, the Wassuk range stands are, along with Trail Canyon in the White Mountains, the driest of our sites. Winter precipitation totals are less than half of that from the Sierra Nevada stands, and spring and summer precipitation totals are also low. However, the second-longest chronology was from North Point (3380 yr) in the Sierra Nevada, an isolated summit east of the range crest that nonetheless receives the highest annual and winter precipitation of all the sites. In addition to aridity, the condition of the substrate (well-draining granitics) and extreme sparsity of understory vegetation likely contribute to longevity of wood preservation at these three stands. However, similar conditions occurred at the Trail Canyon stands in the White Mountains, which was the driest of all ten sites, yet it was also where chronology length (1372 yr) was only one-third the length of the Wassuk stands. By far the strongest pattern of preservation with climate was in the two Toiyabe Range stands (Zone 4), whose chronologies had the shortest time depth (mean = 932 yr), and where the annual precipitation was high, and spring precipitation was twice the mean and summer precipitation 1.5 times the mean of the Sierran sites. Wet springs and summers clearly limited wood preservation.
The continuous nature (without gaps in time) of all site chronologies is noteworthy, given the large variability of climate over the past 631–4002 yr of stand persistence, with contrasting multi-centennial periods of warm-dry and wet-cold conditions. In the Wassuk Range, whereas stands on drier aspects experienced extirpations that were not strongly related to climate intervals, north-aspect stands were continuous through more than three millennia of climate variability (Millar et al., Reference Millar, Charlet, Delany, King and Westfall2019). Such record continuities are not unique to limber pine, nor are the time depths of our chronologies. In the White Mountains, CA, Great Basin bristlecone pine chronologies are famously known for their length, with continuity in one stand of 8847 years (in AD 2020), making it the longest existing single-site tree chronology in the world (Salzer et al., Reference Salzer, Pearson and Baisan2019). Furthermore, individual bristlecone pines can live longer than the ages of our oldest chronology, with the still-living Methuselah tree (White Mountains) estimated at > 4800 years old (Schulman, Reference Schulmann1958), and the Prometheus (Currey) tree at > 4900 years old when it was cut down (Salzer and Baisan, Reference Salzer and Baisan2013). Nonetheless, for many western conifers, and conifers outside the GB, chronologies longer than 1000 years are unusual.
Whereas all sites had continuous records over the duration of their chronologies, sample depths varied by time intervals. For most sites, the oldest time periods had the fewest samples, as is to be expected when preservation is at an extreme. Low samples periods occurred in other cases that were not obviously correlated across sites or related to climate. The case of the Sierran site at North Point, where low sample depth occurred between AD 1100 and AD 1425, with death dates clustering around AD 1350, points to a singular local environmental event. A major volcanic eruption of Glass Flow Dome, part of the Inyo Crater complex, occurred in AD 1350, and devastated forests in the vicinity (Millar et al., Reference Millar, King, Westfall, Alden and Delany2006). North Point lies < 2 km from the eruptive center, and many trees in the limber pine population died there, as also happened elsewhere. Low growth that began in the North Point population in the MCA continued to the present, a situation unique among our populations, and may be related to enduring environmental effects of the eruption, with deep pumice deposition on the peak.
Growth and climate
Consistent across all sites was a strong, positive response of growth to water-year precipitation. A primary influence of moisture, even at uppermost elevations, has been reported previously in GB limber pine (Millar et al. Reference Millar, Westfall and Delany2007, Reference Millar, Westfall, Delany, Flint and Flint2015, Reference Millar, Charlet, Delany, King and Westfall2019), and in GB bristlecone pine from low elevations through dry, high-elevation micro-sites (LaMarche Reference LaMarche1974; Salzer et al., Reference Salzer, Larson, Bunn and Hughes2014b; Tran et al., Reference Tran, Bruening, Bunn, Salzer and Weiss2017). After the effects of precipitation, the role of temperature was significant but varied across sites. Decreasing growth with increasing minimum and maximum temperatures was most common, a response previously documented for limber pine (Millar et al., Reference Millar, Westfall and Delany2007, Reference Millar, Westfall, Delany, Flint and Flint2015, Reference Millar, Charlet, Delany, King and Westfall2019). Whereas in more mesic regions, increasing warmth during the twentieth century relative to LIA conditions stimulated growth (Graumlich et al., Reference Graumlich, Brubaker and Grier1989), in the semi-arid GB mountains, moisture limitations appear to dominate, and increasing warmth likely exacerbates evaporative stresses, reducing growth. This is corroborated by the Zone 4 Toiyabe Range stands, where temperature influences on growth were not as strong as those for populations to the west. Spring and summer precipitation in the Toiyabe Range were high relative to the western populations, and increasing growth in the Toiyabe Range that is associated with those variables may override evaporative effects of relative warmth. The unusual situation of the Kavenaugh stand in the Sierra Nevada, which had a strong, positive association of growth with increasing summer minimum temperatures, may similarly indicate the availability of moisture on this cool, high, north-aspect slope of a deep, narrow canyon. Limber pines growing there appear to benefit, at least for now, by temperatures that are limiting in the other stands.
For sites with time depth greater than 2500 years (Wassuk Range stands and North Point), assumed precipitation sensitivity of growth was consistent with depressed ring widths during the LHDP, corroborating persistent drought implicated for this interval (Mensing et al., Reference Mensing, Sharpe, Tunno, Sada, Thomas, Starratt and Smith2013). Wavelet analyses corroborated low-frequency variability of this interval. However, quasi-cyclic episodes of increased and decreased growth lasting 125–250 yr, also corroborated by wavelet analyses, punctuated growth during this long interval. Transition dates between the growth responses were: 850 BC, 650–7255 BC, 500–550 BC, 400–425 BC, 250 BC, 25 BC–10 AD, and AD 20. Similar to other extended climate intervals of the Late Holocene, it is not surprising that the LHDP was characterized by climate variability, as suggested by the temperature and precipitation effects of a glacial advance in the Sierra Nevada early in the LHDP (Bowerman and Clark, Reference Bowerman and Clark2011) and synchronous cool periods in eastern NV (Reinemann, et al., Reference Reinemann, Porinchu, Bloom, Mark and Box2009). As other proxies become available for this interval, it will be important to assess whether the apparent variability in moisture and timing of growth seen in limber pine during the LHDP are replicated elsewhere. Relative to the full chronologies at those sites, years of absolute lowest growth occurred during the LHDP, which is consistent with the LHDP signal being strongest in the western GB, as documented and predicted by Mensing, et al. (Reference Mensing, Sharpe, Tunno, Sada, Thomas, Starratt and Smith2013).
Limber pine growth showed response to the alternating dry-wet-dry intervals of the MCA. Stine (Reference Stine1994) defined this anomalous period using exposed stumps below present day river and lake levels of eastern California as two extensive drought periods, from ~AD 912–AD 1112 and ~AD 1210–AD 1350. Further evidence from submerged logs near Lake Tahoe, CA corroborated drought persisting from earlier than AD 1030 to AD 1250 (Kleppe et al., Reference Kleppe, Brothers, Kent, Biondi, Jensen and Driscoll2011). Pollen evidence from several western GB lakes indicates a century-long drought ending in AD 1150, with one record documenting a second extended drought period ending in AD 1400 (Mensing et al., Reference Mensing, Smith, Norman and Allan2008). Low stands in Owens Lake, eastern California, occurred at AD 1060–AD 1280 (Bacon et al., Reference Bacon, Lancaster, Stine, Rhodes and Holder2018). From a western GB lake record, Hatchett et al. (Reference Hatchett, Boyle, Putnam and Bassett2015) discriminated a 50-yr pluvial period, AD 1075–AD 1125, that separated the two extended droughts. From tree-ring records, LaMarche (1973) noted depressed growth in bristlecone pines of the White Mountains from AD 1100–AD 1500, attributing it to dry and cold conditions. Anomalous warmth, by contrast, was interpreted from high-elevation conifer tree rings in the Sierra Nevada (Graumlich, Reference Graumlich1993; Scuderi, Reference Scuderi1993), where an anomalous mixed-conifer forest that grew at high elevation during this period was interpreted as having drier and warmer growing conditions than the mid-twentieth century (Millar et al., Reference Millar, King, Westfall, Alden and Delany2006).
For our eight limber pine stands with adequate time depth, all showed decreased growth during the first MCA drought (~AD 800–AD 1000), corroborating this as a dry (and possibly warm) interval. All ten stands had a spike in high growth from AD 1000–AD 1175, suggesting a return to wetter (and possibly cooler) conditions. This growth response appears to have started earlier and lasted longer than the 50-yr pluvial suggested by Hatchett et al. (Reference Hatchett, Boyle, Putnam and Bassett2015). In contrast to the valley lake lower elevations, at high elevations of the limber pine stands, conditions possibly became wetter and/or cooler earlier; similarly, they may have persisted longer at the pine stands. Limber pine populations also responded with decreased growth during the second MCA drought, although not at all stands. Notably, the high spike and second depressed growth period occurred not only in the western limber pine populations but also in the Toiyabe Range, where contemporary conditions of elevated spring and summer precipitation create high relative growth. Low growth during the MCA suggests that drought extended into the central Nevada populations as well as the western Great Basin.
Response of limber pine to cool, wet conditions of the LIA, described from many areas of the GB using multiple proxies, was much less consistent than the responses to extended drought periods. The LIA has been observed in other GB subalpine pines as a multi-century period of depressed growth and lowered tree lines (LaMarche, Reference LaMarche1973, Reference LaMarche1974; Graumlich, Reference Graumlich1993; Scuderi, Reference Scuderi1993; Feng and Epstein, Reference Feng and Epstein1994). Tree ring evidence that documented rapid cooling began ~AD 1600, with maximum cold ~AD 1700–1900 (Feng and Epstein, Reference Feng and Epstein1994). Renewed glacial advances in the high western GB mountains during these centuries indicate summer minimum temperatures decreases of 0.2°–2°C and precipitation increases of 2–26 cm (Bowerman and Clark, Reference Bowerman and Clark2011).
Relative to these proxies, limber pine growth from AD 1400–AD 1650 was highly varied. Each site had repeating cycles of increased and decreased growth lasting several decades. For most sites, this growth fluctuated around the long-term mean, with a tendency toward above-mean growth. This suggests that the initial wet conditions of the LIA promoted average and increased growth, unlike the persistent depressed growth response observed in other subalpine species for the entire LIA. Growth was persistently high at the Wassuk sites from AD 1400–AD 1650, suggesting that these particularly dry sites benefited from increased moisture and reduced evaporative stress of the early LIA. All ten sites responded to the second half of the LIA with depressed growth, suggesting that this period might have been drier than the prior centuries, as well as having been cold.
Increased growth of limber pine subsequent to ~AD 1900 at all sites except the North Point stand match up with proxy conditions as well as instrumental records for climate amelioration following the end of the LIA. Increasing effective moisture and warming led to growth increases in other GB high elevation pines (LaMarche, Reference LaMarche1973, Reference LaMarche1974; Graumlich, Reference Graumlich1993; Lloyd and Graumlich, Reference Lloyd and Graumlich1997; Millar et al., Reference Millar, Westfall, Delany, Flint and Flint2015, 2019). Growth decline for all limber pine sites during the drought of the 1930s, with populations from the Sierra Nevada to Toiyabe Range having minimum growth ca. AD 1935, likely reflects a lag in response to cumulative dry years. High growth at all sites except North Point during the mid- and late twentieth century indicates a period of potentially optimum climatic conditions for limber pine growth relative to millennial-long conditions.
Noteworthy is the response of limber pine to the severe and hotter droughts of the late twentieth and early twenty-first centuries, starting in the mid-1980s. Growth of limber pine plummeted at all sites during this period, equaling and surpassing low growth of any time in the long term chronologies. Ten years of increased temperatures and decreased precipitation, ~AD 1985–AD 1995, drove widespread, insect-related pine mortality in western North American pines (Bentz et al., Reference Bentz, Régnière, Fettig, Hansen, Hayes, Hicke, Kelsey, Negrón and Seybold2010), and affecting eastern California limber pine (Millar et al., Reference Millar, Westfall and Delany2007). Decreases in growth that started and worsened into the twenty-first century were previously recorded for limber pine populations in the eastern Sierra Nevada, White Mountains, and Wassuk Range populations, corresponding to the drought of AD 2011–AD 2015 (Millar et al. Reference Millar, Westfall, Delany, Flint and Flint2015, Reference Millar, Charlet, Delany, King and Westfall2019). Extreme heat as well as severe dry conditions of this twenty-first century drought (winters without snow) have been documented as climatically the most severe drought period of the last 1000 years, exceeding the MCA in severity (Cook et al, Reference Cook, Ault and Smerdon2015; Hatchett et al., Reference Hatchett, Boyle, Putnam and Bassett2015). Hotter and drier droughts than in prior decades and centuries have been connected to anthropogenic climate warming, leading to concerns for increasing megadrought conditions and worsening ecological impacts in the future (Millar and Stephenson, Reference Millar and Stephenson2015; Williams et al., Reference Williams, Cook, Smerdon, Cook, Abatzoglou, Bolles, Baek, Badger and Livneh2020). Rebounds in growth at sites from all regions of our study subsequent to AD 2015, however, suggest that limber pine is able to recover rapidly from such intense (albeit short relative to historic periods) drought. The growth rebounds correlated with recovery from severe drought and return of heavy snow winters in water years 2017, 2018, and 2019 (NRCS, 2020). However, dry conditions of early water-year 2021 may portend renewed stress on limber pine growth that might be worsened by cumulative effects from the severe drought of the early twenty-first century. At the very dry Trail Canyon site, increased moisture in the 2017 and 2018 growing seasons (the outermost ring sampled) apparently was inadequate to promote growth recovery.
Influence of inter-annual to decadal climate modes, including the SOI, PDO, and AMO, has been implicated in high- to medium-frequency climate variability in the GB (Mensing et al., Reference Mensing, Sharpe, Tunno, Sada, Thomas, Starratt and Smith2013; B. Cook et al., Reference Cook, Krusic and Melvin2014; Wise, Reference Wise2016), including extensive drought of the LHDP and MCA. Although our transect of limber pine sites was within a broad transition zone for the expression of these dipolar climate modes, growth in all our limber pine sites showed strong influence of AMO periodicity. Droughts noted by Wise (Reference Wise2016) that were related to strong pressure ridges and atmospheric blocking occurred at AD 1560–AD 1580, which was seen as decreased growth at all but the North Point site; AD 1780, which did not depress growth significantly in limber pine; and AD 1840–AD 1860, which is reflected by decreased limber pine growth, as were growth reductions at all sites for the AD 1920–AD 1930s drought. A role for AMO influence has been documented previously in limber pine in the GB, where ring width was associated with AMO, and seedling recruitment was favored in wet water years and wet autumns associated with AMO cyclicity (Millar et al., Reference Millar, Westfall, Delany, Flint and Flint2015). Growth increases at all GB sites in the present study were associated with negative AMO episodes in the early and mid-twentieth century.
CONCLUSIONS
High-elevation limber pine populations at ten sites in the Great Basin, extending from the Sierra Nevada crest inland to central Nevada, persisted through high climate variability of the past 861 to 4003 years. Populations were continuous (live trees) through this time despite extended periods of severe heat, cold, drought, and wetness. Growth responses, governed primarily by growing-season precipitation and moderate temperatures, allowed resilience of these limber pine populations across environmental and climatic heterogeneity to multi-century droughts of the LHDP, MCA, as well as to the contrasting cold, wet conditions of the LIA. Whereas populations from the Sierra Nevada and western Nevada showed relatively similar patterns of growth at long and short temporal scales, analyses of patterns of growth from interior Nevada populations in the Toiyabe Range showed clustering of growth patterns related to some climatic features. Relative to the long-term means, increasing growth over the past three centuries in the Toiyabe stands may indicate increasing development of spring and summer precipitation in that region, while the westerly populations remained under (intensifying) summer drought. Apart from climate, only a severe volcanic event that devastated stands in its vicinity and covered our sample site with thick ash enforced long-term depressed pine growth that began in the MCA.
From the standpoint of future health of limber pine in the Great Basin, results from this study provide space-for-time insight into potential effects of increasing heat and drought on the species’ growth and persistence. Concern for the currently high-precipitation Sierra Nevada populations under, e.g., future hotter droughts, might be alleviated by results from the very dry stands included in this study, such as the northern White Mountains and Wassuk Range, which have retained adequate growth for survival. Rapid growth recovery in response to drought termination, as well as drought-mediated twentieth and twenty-first century bark-beetle insect mortality events, also suggests resilience in the limber pine population as it faces increasing pressure from future climates.
Supplementary material
Acknowledgments
We thank Chrissy Howell (USFS) for review of the draft manuscript. Millar, Delany, and Westfall were supported by operating funds from the USFS.